

Key Points
A DLBCL cell-of-origin classifier integrating both genetic and gene expression signatures shows robust predictive values in DLBCL cohorts.
Targeted NGS and AI enable potential application of fast and reliable DLBCL classification assays in clinical practice.

Abstract
Diffuse large B-cell lymphoma (DLBCL) is a heterogeneous entity of B-cell lymphoma. Cell-of-origin (COO) classification of DLBCL is required in routine practice by the World Health Organization classification for biological and therapeutic insights. Genetic subtypes uncovered recently are based on distinct genetic alterations in DLBCL, which are different from the COO subtypes defined by gene expression signatures of normal B cells retained in DLBCL. We hypothesize that classifiers incorporating both genome-wide gene-expression and pathogenetic variables can improve the therapeutic significance of DLBCL classification. To develop such refined classifiers, we performed targeted RNA sequencing (RNA-Seq) with a commercially available next-generation sequencing (NGS) platform in a large cohort of 418 DLBCLs. Genetic and transcriptional data obtained by RNA-Seq in a single run were explored by state-of-the-art artificial intelligence (AI) to develop a NGS-COO classifier for COO assignment and NGS survival models for clinical outcome prediction. The NGS-COO model built through applying AI in the training set was robust, showing high concordance with COO classification by either Affymetrix GeneChip microarray or the NanoString Lymph2Cx assay in 2 validation sets. Although the NGS-COO model was not trained for clinical outcome, the activated B-cell–like compared with the germinal-center B-cell–like subtype had significantly poorer survival. The NGS survival models stratified 30% high-risk patients in the validation set with poor survival as in the training set. These results demonstrate that targeted RNA-Seq coupled with AI deep learning techniques provides reproducible, efficient, and affordable assays for clinical application. The clinical grade assays and NGS models integrating both genetic and transcriptional factors developed in this study may eventually support precision medicine in DLBCL.
Introduction
Diffuse large B-cell lymphoma (DLBCL) is the most common B-cell lymphoma and is clinically heterogeneous. Gene expression profiling (GEP) classified DLBCL into 2 major molecular subtypes according to their cell of origin (COO): germinal-center B-cell–like (GCB) and activated B-cell–like (ABC) DLBCL.1 ABC-COO is associated with poorer clinical outcomes in DLBCL irrespective of treatment: CHOP (cyclophosphamide, doxorubicin, vincristine, and prednisone), rituximab (R)-CHOP,1-3 obinutuzumab (G)-CHOP,4 or classical salvage chemotherapy R-DHAP (rituximab, dexamethasone, high-dose cytarabine, and cisplatin) followed by intensive therapy plus autologous stem cell transplantation.5 However, several novel agents, including lenalidomide,6-8 ibrutinib,8,9 and bortezomib alone10 or in combination with durvalumab (anti–PD-L1),11 showed selective or better clinical efficacy in ABC- vs GCB-DLBCL. The prognostic and therapeutic differences between ABC- and GCB-DLBCL have a molecular basis, such as higher frequencies of mutations in CD79, MYD88, CARD11, PRDM1, and TNFAIP3,12 chronic active B-cell receptor signaling,13 and more frequent MYC/BCL2 double expression in the absence of genetic MYC/BCL2 double hit14 in ABC-DLBCL. In addition, the subcellular distribution and mechanism of action of doxorubicin in ABC-DLBCL are different from those in GCB-DLBCL.15 To guide clinical therapeutics, distinction of the GCB vs ABC/non-GC subtype has become the standard practice according to the 2016 revision of the World Health Organization classification of lymphoid neoplasms.16
Significant efforts have been put into establishing clinically applicable assays and accurate classification of DLBCL, and methodology to determine COO has been evolving in the last 2 decades. The original Lymphochip spotted cDNA microarray and the gold standard classification algorithm are robust in COO classification but impracticable for routine clinical practice.1-3 Researchers thus developed algorithms to distinguish GC from non-GC subtypes based on protein expression of 3 to 5 biomarkers in formalin-fixed, paraffin-embedded (FFPE) tissue samples readily assessed by immunohistochemistry (IHC) in the clinic.17-24 However, the accuracy of these IHC algorithms and the prognostic significance of COO subtypes determined by IHC algorithms5,25 are not consistent.23,26-28 To enable GEP by DNA microarrays to classify DLBCL using clinical FFPE tissues that yield highly fragmented RNA samples, new RNA amplification and labeling techniques and classification models were developed, including a 100-gene classifier for Affymetrix GeneChip (Affymetrix, Inc) data29 and a 20-gene DLBCL Automatic classifier for Illumina WG-DASL platform (Illumina United Kingdom) data30 developed from a previous platform-independent 27-gene DLBCL subgroup predictor31 that showed reproducibility and prognostic value.
To simplify the GEP process for FFPE samples, a multiplexed quantitative nuclease protection assay (qNPA) was developed that directly hybridizes mRNA in situ using 50-mer probes for genes of interest, followed by probe capture and quantitative imaging, thereby reliably detecting mRNA levels in FFPE samples without RNA exaction and amplification.32-34 The qNPA platform (HTG Molecular Diagnostics, Inc.) can accurately classify DLBCL using a 14-gene signature.35 The current HTG EdgeSeq DLBCL COO assay has been applied in a clinic trial.36 However, the most successful simplified variation of microarray for rapid COO determination is the NanoString nCounter System (NanoString Technologies), which elegantly detects target mRNA of interest in extracted nonamplified RNA samples using a capture probe and a color-coded reporter probe, followed by purification, immobilization, and digital readout.37 Several different small gene panel-based DLBCL-COO assays, including the most wildly used Lymph2Cx 20-gene assay,38 have been applied in research studies and clinical trials,4,39-45 although a large gene panel (145 genes) was also achievable for the NanoString nCounter system.46 COO determined by Lymph2Cx 20-gene assay either exhibited high concordance with GEP-determined COO or showed significant prognostic value in 4 retrospective studies47-50 and a clinical trial,51 but not in 2 clinical trials52 and 1 retrospective study.53
Reverse transcriptase–multiplex ligation-dependent probe amplification, which ligates the left and right probes annealed to cDNA target sequences, permitting amplification of specific genes,54 is another type of assay that has been applied for DLBCL-COO classification based on expression of 14 or 21 genes.55,56 This method is sensitive and cost-effective without using a dedicated platform but has relatively poor dynamic range and is unable to include some COO-specific genes.55
DLBCL outcome predictors that link GEP signatures directly to clinical outcome instead of COO have also been developed,2,3,57,58 but the reproducibility between different studies was poor, and the predictive value for therapies other than the standard treatment is uncertain. In contrast, COO classification with underlying biology basis9 also have predictive values for novel therapies, as demonstrated in phase 1/2 and 2/3 clinical trials.6-8,10,11 However, recent clinical trials for adding ibrutinib (phase 336 ) and bortezomib (phases 259 and 360 ) to the standard R-CHOP in previously untreated ABC (by Hans algorithm and HTG EdgeSeq36 or by Illumina DASL assay60 ) or non-GC (by Hans algorithm and Nanostring Lymph2Cx assay59 ) DLBCL patients failed to show improved clinical outcome.
To better classify DLBCL biologically guiding therapeutic clinical trials, genetic alteration signatures have been explored to subtype DLBCL in large numbers of patients, as genetic upstream of the oncogenic biology in DLBCL can define the response to novel targeted therapies. Schmitz et al61 used a GenClass algorithm, and Chapuy et al62 used an nonnegative matrix factorization (NMF) consensus clustering algorithm to analyze high-content genetic data of 574 and 304 patients, respectively, and uncovered genetically distinct subtypes within or independent of COO subtypes, most of which demonstrated robust prognostic significance and potential therapeutic relevance.61,62 However, the pathogenic driver roles of many mutations in signatures vary or have not been validated,63,64 and how to accurately assign a genetic subtype to new individual patients at presentation in real time is less clear than the current COO classification. In a phase 3 GOYA study (NCT01287741),43 approximation of EZB, BN2, N1, and MCD subtypes based on presence of subtype founder gene alterations in targeted next-generation sequencing (NGS) data of 465 genes did not find prognostic effect, whereas clusters (C) C2, C3, and C5 identified by applying NMF consensus clustering to the study cohort showed poorer prognosis compared with C0, C1, and C4 clusters. In another prospective study from the LNH03B LYSA (Lymphoma Study Association) clinical trials with targeted NGS of 34 key genes and genomic copy number variation analysis, none of the genetic subtypes identified by the GenClass algorithm or NMF consensus clustering showed prognostic significance.65 The inconsistent prognostic values could result from the highly variable sequencing panels and NGS data quality in different studies, inaccurate subtyping, and the clinical heterogeneity within defined genetic subtypes underscored by phenotypic biologic (eg, MYC/BCL2 expression66 ) heterogeneity arising from many other underlying mechanisms, for example, epigenetic deregulation and genetic alterations in noncoding regions.67 In fact, in the cohort of Schmitz et al, MCD patients with MYD88/CD79B double mutations had better survival compared with other MCD patients,66 and the EZB subtype has been further divided into the unfavorable EZB-MYC+ and favorable EZB-MYC─ subtypes recently by a LymphGen algorithm.68 A LymphGen webtool has been public accessible and able to assign genetic subtypes to patients if the input is from a cohort but not if from only 1 patient.
Based on these previous studies, we hypothesized that combined high-throughput genetic and gene expression signature analysis may improve the DLBCL classification for prognostic stratification and therapeutic implication. To be clinically applicable, fast and economical assays on FFPE samples that provide both genetic and expression data with low sample input are needed. We therefore implemented targeted RNA sequencing (RNA-Seq) of 1408 genes with NGS technology that simultaneously sequences and quantitates expressed mRNA molecules in a single assay. Artificial intelligence (AI) was implemented to build predictive models based on both genetic and gene expression data of a large number of DLBCL FFPE samples. The robustness of the predictive models was tested in validation cohorts supporting our hypothesis.
Patients and methods
Patients
RNA-seq was performed for 444 patients with de novo DLBCL diagnosed in 1998 to 2008 treated with R-CHOP at 22 medical centers. Cases were organized for retrospective studies as part of the DLBCL Consortium Program,69 which has been approved by the institutional review board of each participating medical center and conducted in accordance with the Declaration of Helsinki. Patients with transformed DLBCL, primary mediastinal large B-cell lymphoma, primary central nervous system DLBCL, or primary cutaneous DLBCL have been excluded. Molecular characterization of the study cohort has been previously summarized.70,71 Fluorescence in situ hybridization identified 12 of 293 cases as high-grade B-cell lymphoma with MYC and BCL2 and/or BCL6 rearrangements (7 MYC/BCL2 double/triple-hit and 5 MYC/BCL6 double-hit cases).
Data for 418 cases were further analyzed after data quality control. GEP was performed in 366 of the 418 patients using Affymetrix GeneChip Human Genome U133 Plus 2.0 (deposited in Gene Expression Omnibus GSE#31312).24 Using a Bayesian model, 172, 160, and 34 cases were determined as GCB, ABC, and unclassified DLBCL, respectively. For the 34 GEP-unclassified cases, the Visco-Young IHC algorithm24 was applied, which assigned 15 cases to GCB and 19 cases to ABC. For the other 52 cases in which GEP was not performed, the Visco-Young algorithm classified 22 cases as GCB and 23 cases as ABC.
To further validate the COO model, 60 independent DLBCL samples were obtained and classified into ABC/GCB subtypes using the Lymph2Cx NanoString nCounter assay according to the manufacturer’s instructions.
GEP analysis
Raw RNA-Seq and Affymetrix GEP data were preprocessed and normalized by robust multichip average using the R package (version 1.65.1).72 Two-class unpaired significance analysis of microarrays were performed to identify significantly differentially expressed genes (DEGs) between the 2 groups.73 Gene expression data were analyzed via CLUSTER software using the average linkage metric and then displayed by JAVA TREEVIEW (https://www.java.com/en).74
RNA library construction and sequencing
The Agencourt FormaPure Total 96-Prep Kit was used to extract both DNA and RNA from the same FFPE tissue lysates using an automated KingFisher Flex and protocols as recommended by each manufacturer. Samples were selectively enriched for 1408 cancer-associated genes using reagents provided in an Illumina TruSight RNA Pan-Cancer Panel. The cDNA was generated from the cleaved RNA fragments using random primers during the first- and second-strand synthesis. Then, sequencing adapters were ligated to the resulting double-stranded cDNA fragments. The coding regions of expressed genes were captured from this library using sequence-specific probes to create the final library. Sequencing was performed on an Illumina NextSeq 550 System platform. Ten million reads per sample in a single run was required. The read length was 2 × 150 bp. The sequencing depth was 10× to 1739×, with a median of 41×. An expression profile was generated from the sequencing coverage profile of each individual sample using Cufflinks. Expression levels were measured using fragments per kilobase of transcript per million and further normalized using the B-cell PAX5 RNA expression levels to adjust for variability in the percentage of DLBC cells in samples.
Alignment of sequencing data and variant calling were performed with the DRAGEN Somatic Pipeline (Illumina) using tumor-only analysis against the GRCh37 reference genome to identify 2 classes of mutations: single nucleotide variants and indels. Tumor samples were analyzed without a matching normal.
DLBCL COO classification and clinical risk prediction modeling
To build robust DLBCL classification models, we randomly selected 60% of cases to fit (train) the model and then validated using the remaining 40% (validation set). Sixty independent DLBCL samples classified by Nanostring Lymph2Cx assay were used as a second validation set.
First, univariate significance tests were used to screen the large number of variables. Normalized RNA expression data and mutation data were included as variants to build a classification model. For interpretability and simplicity, we divided the gene expression values into 4 or 10 equal parts using the quartiles (Q1, Q2, and Q3) and deciles and selected mutation data of 39 highly recurrent genes that had mutations in at least 10 patients. Fisher’s exact test was used after discretizing RNA expressions using their quartiles, and 228 variables were statistically significant with P < .01. After adjusting for multiple hypothesis testing using Benjamini-Hochberg’s method and setting the cutoff for false discovery rate (FDR) at 0.01, statistically significant variables were narrowed down to 129. Finally, setting the cutoff for FDR at 0.0001, 48 variables were selected with either small adjusted P values or high area under the receiver operating curve (AUC).
We selected 252 DLBCLs with high confidence COO assignment to develop risk stratification models directly correlating with survival. We randomly selected 60% (152) of subjects as the training set to fit the model and tested the performance in the remaining 40% (100) patients. Kaplan-Meier and Cox proportional hazards (CPH) analysis was used to identify variables with significant prognostic impact.
Multiple statistical approaches were tested for modeling performance, and models built through deep learning techniques75,76 were most predictive and robust. We used autoencoders for nonlinear transformations of autoencoded features into 2-dimensional latent space. Logistic regression and CPH models were used for building the COO model and clinical risk models, respectively. A flowchart of the study is provided in supplemental Figure 1.
Results
Mutation spectrum, GCB/ABC association, and prognostic significance in DLBCL
In 418 patients, RNA-Seq data fulfilled the quality control criteria (supplemental Table 1) and were further analyzed. In total, 2207 nonsynonymous mutations occurred in 598 genes in 412 patients. In the study cohort, each patient had 0 to 30 genes harboring mutations (median, 4 mutated genes); 322 genes had mutations in at least 2 patients. Figure 1A shows the case distribution of mutations in 66 genes occurred in at least 6 patients. The corresponding mutation and clinical data are in the supplemental Data. The clinical features of the 418 patients are summarized in Table 1.
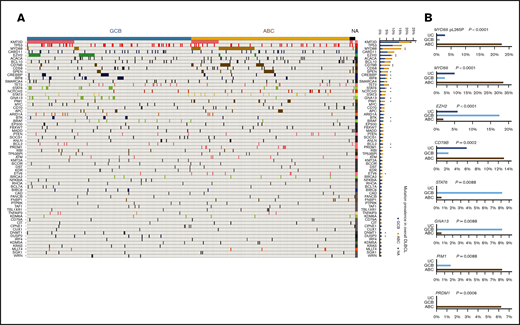
Case distribution and prevalence of gene mutations detected by RNA-seq in GCB and ABC subtypes of DLBCL. (A) Heatmap for distribution of gene mutations in GCB/ABC subtypes of DLBCL. Only genes mutated in ≥6 patients are shown. Each column is for each patient, and each row is for each gene. Frequency (prevalence) of mutations in overall DLBCL is on the right. Genes with significantly differential prevalence in GCB and ABC subtypes (determined by Affymetrix and/or IHC) are marked by asterisks. (B) Differential prevalence of mutations in DLBCL COO subtypes classified by gene expression profiling. Only the most significant genes are shown. UC, unclassified.
Case distribution and prevalence of gene mutations detected by RNA-seq in GCB and ABC subtypes of DLBCL. (A) Heatmap for distribution of gene mutations in GCB/ABC subtypes of DLBCL. Only genes mutated in ≥6 patients are shown. Each column is for each patient, and each row is for each gene. Frequency (prevalence) of mutations in overall DLBCL is on the right. Genes with significantly differential prevalence in GCB and ABC subtypes (determined by Affymetrix and/or IHC) are marked by asterisks. (B) Differential prevalence of mutations in DLBCL COO subtypes classified by gene expression profiling. Only the most significant genes are shown. UC, unclassified.
Clinical features of the overall study cohort and GCB and ABC subtypes of DLBCL newly defined in the current study
| Overall, n (%) | GCB, n (%) | ABC, n (%) | GCB vs ABC, P | |
|---|---|---|---|---|
| Patients | 418 (100) | 202 (100) | 216 (100) | |
| Sex | ||||
| Male | 229 (54.8) | 110 (54.5) | 119 (55.1) | .92 |
| Female | 189 (45.2) | 92 (45.5) | 97 (44.9) | |
| Age, y | ||||
| ≤60 | 178 (42.6) | 100 (49.5) | 78 (36.1) | .0075 |
| >60 | 240 (57.4) | 102 (50.5) | 138 (63.9) | |
| Stage of disease | ||||
| I-II | 185 (46.0) | 106 (54.6) | 79 (38.0) | .0009 |
| III-IV | 217 (54.0) | 88 (45.4) | 129 (62.0) | |
| Serum LDH level | ||||
| Normal | 144 (37.0) | 80 (42.6) | 64 (31.8) | .036 |
| Elevated | 245 (63.0) | 108 (57.4) | 137 (68.2) | |
| ECOG performance status | ||||
| 0-1 | 313 (82.6) | 154 (86.0) | 159 (79.5) | .10 |
| ≥2 | 66 (17.4) | 25 (14.0) | 41 (20.5) | |
| No. of extranodal sites involved | ||||
| 0-1 | 295 (74.3) | 145 (76.3) | 150 (72.5) | .42 |
| ≥2 | 102 (25.7) | 45 (23.7) | 57 (27.5) | |
| IPI risk group | ||||
| 0-2 | 246 (60.9) | 133 (68.9) | 113 (53.6) | .0022 |
| 3-5 | 158 (39.1) | 60 (31.1) | 98 (46.4) | |
| B-symptoms | ||||
| Absence | 267 (66.8) | 141 (73.8) | 126 (60.3) | .0042 |
| Presence | 133 (33.3) | 50 (26.2) | 83 (39.7) | |
| Tumor size, cm | ||||
| <5 | 189 (58.9) | 91 (59.5) | 98 (58.3) | .91 |
| ≥5 | 132 (41.1) | 62 (40.5) | 70 (41.7) | |
| COO by Affymetrix GEP | ||||
| GCB | 172 (47.0) | 149 (86.1) | 23 (11.9) | <.0001 |
| ABC | 160 (43.7) | 8 (4.6) | 152 (78.9) | |
| UC | 34 (9.3) | 16 (8.7) | 18 (9.3) | |
| COO by GEP and IHC | ||||
| GCB | 209 (50.9) | 180 (90.5) | 29 (13.7) | <.0001 |
| ABC | 202 (49.1) | 19 (9.5) | 183 (86.3) | |
Significant P values are in boldface.
ECOG, Eastern Cooperative Oncology Group; LDH, lactate dehydrogenase; IPI, International Prognostic Index.
Mutation profile was compared between GCB and ABC subtypes classified by GEP and/or IHC (GCB, n = 209; ABC, n = 202). Mutations in EZH2 (P < .0001), KMT2D (MLL2), CREBBP, IRF8, STAT6, GNA13, BTK, BRAF, BCL2, DNMT1, and DUSP2 were significantly more frequent in GCB than in ABC, whereas mutations in MYD88 (P < .0001), CD79B (P < .0001), and SPEN, PIM1, PRDM1, ETV6, and NOTCH2 (borderline P = .054) were significantly more frequent in ABC than in GCB (Fisher’s exact test; asterisks for significant genes in Figure 1A). The majority (69%) of MYD88 mutations in ABC were pL273P (L265P), whereas almost half of MYD88 mutations in GCB were pS219C.
Comparisons between GEP-classified GCB (n = 172) and ABC (n = 160) cases showed largely similar results (top significant genes are shown in Figure 1B), except that the associations of NOTCH2 with ABC and DUSP2 mutations with GCB became insignificant, and additionally BIRC6 mutation and IRF4 mutation showed significant association with GCB and ABC subtype, respectively. In addition, the 34 GEP-unclassified cases had higher frequencies of CREBBP and BRAF mutations than both GCB and ABC subtypes.
Mutation status of each gene was analyzed for prognostic significance. Table 2 lists frequently mutated genes with significant mutational effects on overall survival (OS) by univariate analysis. Among genes with mutations occurring in at least 9 patients, TP53, TET2, KMT2D (in overall cohort, P = .0005, .011, and .012, respectively), NOTCH2 (in GCB, P = .005), and ATM (in ABC, P = .003) mutations showed significantly adverse effects, whereas EZH2 and GNA13 mutations genes showed significantly favorable effects (P = .007 and .047, respectively).
List of genes with >2% mutational prevalence and significant impact on OS rate in DLBCL
| Gene | Effect on OS | In DLBCL | In GCB | In ABC | |||
|---|---|---|---|---|---|---|---|
| Mutation frequency, % | P for OS | Mutation frequency, % | P for OS | Mutation frequency, % | P for OS | ||
| KMT2D | Unfavorable | 23.7 | .012 | 28.5 | .005 | 17.5 | — |
| TP53 | Unfavorable | 16.3 | .0005 | 19.8 | .024 | 13.1 | .034 |
| EZH2 | Favorable | 9.3 | .007 | 17.4 | .04 | 1.9 | — |
| TET2 | Unfavorable | 5.5 | .011 | 6.4 | .011 | 4.4 | — |
| NOTCH2 | Unfavorable | 4.5 | (.061) | 2.9 | .005 | 6.9 | — |
| GNA13 | Favorable | 4.1 | .047 | 8.1 | (.09) | 0.6 | — |
| ATM | Unfavorable | 2.2 | (.085) | 1.7 | — | 2.5 | .003 |
The DLBCL group had 418 patients. The GCB group, determined by gene-expression profiling, had 172 patients. The ABC group, determined by gene-expression profiling, had 160 patients. The impact on OS was based on univariate analysis for each gene. Marginal P values are in the parentheses. Dashes indicate not prognostic.
Development and validation of the NGS-COO classification model
RNA-Seq gene expression (supplemental Data), gene fusion, and mutation data were used to develop a model for DLBCL-COO classification in the training set. Fisher’s exact test and multiple hypothesis testing adjustment were used to identify RNA-Seq variables showing significant difference between GCB and ABC subtypes. DEGs between GEP-classified GCB and ABC subtypes are visualized in Figure 2A (FDR < 0.1, fold change ≥ 1.42). Finally, the top 48 variables (Table 3; Figure 2B) that were significantly differed between GCB and ABC subtypes with FDR < 0.0001 or high AUC were chosen to build a new classification model for RNA-Seq data, including 2 genes (MYD88 and EZH2)′s mutation status and 46 genes′ RNA expression levels.
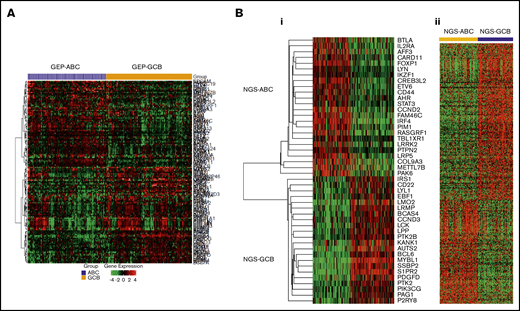
Heatmaps for significant differential gene expression between GCB and ABC subtypes classified by Affymetrix GeneChip or RNA-seq. (A) RNA-seq expression data (significant genes with FDR < 0.10 and fold change ≥ 1.42) of previous GCB/ABC subtypes classified by Affymetrix GeneChip DNA microarray data. (Bi) RNA-seq expression data (top 46 genes selected for the new NGS-COO classifier) of the new GCB/ABC groups. (Bii) Affymetrix GeneChip microarray data of the new GCB/ABC groups.
Heatmaps for significant differential gene expression between GCB and ABC subtypes classified by Affymetrix GeneChip or RNA-seq. (A) RNA-seq expression data (significant genes with FDR < 0.10 and fold change ≥ 1.42) of previous GCB/ABC subtypes classified by Affymetrix GeneChip DNA microarray data. (Bi) RNA-seq expression data (top 46 genes selected for the new NGS-COO classifier) of the new GCB/ABC groups. (Bii) Affymetrix GeneChip microarray data of the new GCB/ABC groups.
List of 48 variables (46 for gene expression level and 2 for gene mutation status) in the DLBCL NGS-COO classifier
| AFF3 | AHR | AUTS2 | BCAS4 | BCL6 | BTLA |
| CARD11 | CCND2 | CCND3 | CD22 | CD44 | COL9A3 |
| CREB3L2 | EBF1 | ETV6 | FAM46C | FOXP1 | IKZF1 |
| IL2RA | IRF4 | IRS1 | KANK1 | LCK | LMO2 |
| LPP | LRMP | LRP5 | LRRK2 | LYL1 | LYN |
| METTL7B | EZH1 mutation | MYD88 mutation | MYBL1 | P2RY8 | PAG1 |
| PAK6 | PDGFD | PIK3CG | PIM1 | PTK2 | PTK2B |
| PTPN2 | RASGRF1 | S1PR2 | SSBP2 | STAT3 | TBL1XR1 |
Several statistical models were built on the 48 variables in the training set (without knowing classification) and then tested in the validation sets. The COO model based on autoencoder, an unsupervised deep learning technique, showed the best performance. An autoencoder neural network was built with 5 hidden layers.75,76 The first 2 layers and the last 2 layers each had 100 neurons; the middle layer (bottleneck) had 2 neurons, which captured latent (unobserved) features of the data. The values of these 2 neurons formed a low-dimensional (2) representation of the data; that is, it aggregated the 48 variables into 2 latent features. The top 7 contributing variables to the latent features were MYD88 mutation, EZH2 mutation, RASGRF1 expression, MYBL1 expression, S1PR2 expression, SSBP2 expression, and IRF4 expression. Based on the latent features, a logistic regression model was built for GCB/ABC classification (named as NGS-COO classifier). As shown in Figure 3A, the autoencoder transformed the high-dimensional data into a 2-dimensional space where the 2 subtypes were easily separable (linearly) roughly with a diagonal line from (−1, −1) to (1, 1).
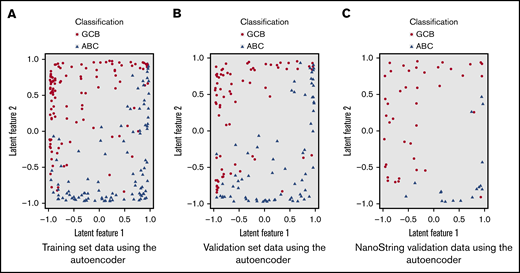
Two-dimensional representation of the training and validation set data using the autoencoder. (A) Training set data using the autoencoder. (B) Validation set data using the autoencoder. (C) NanoString validation data using the autoencoder.
Two-dimensional representation of the training and validation set data using the autoencoder. (A) Training set data using the autoencoder. (B) Validation set data using the autoencoder. (C) NanoString validation data using the autoencoder.
The NGS-COO classifier developed from the training set was then applied to the validation set. A probability of scoring was generated for each case. Approximately 30% of the cases had a score between 0.5 and 0.75, indicating low confidence for classification. For the remaining 70% with high confidence for assigning to 1 of the 2 subtypes (probability of 0.8 or higher), the ABC vs GCB classification showed sensitivity and specificity of 96% and 97% for classification in the validation set. The accuracy/concordance rate with previous GCB/ABC classification was 95.6%. The corresponding AUC was 96.2%.
In the training and validation sets, in total, 216 cases were determined as the ABC subtype and 202 cases as the GCB subtype. Differential expression of the 46 genes constituting the NGS-COO classifier in the study cohort is visualized in Figure 2B. The new GCB/ABC cases were also associated with 1319 significant DEGs with FDR < 0.0001 in GEP analysis using our previous Affymetrix GeneChip DNA microarray data (Figure 2B) and multiple biomarkers characterized in previous studies by our Consortium program (supplemental Table 2).
To further evaluate the performance of the NGS-COO classification model, we applied the same approach to 60 independent cases as an external validation cohort. Our NGS-COO model showed sensitivity and specificity of 96% and 97%, respectively, with the previous COO classification by the NanoString Lymph2Cx assay. The concordance rate was 92.9%. The corresponding AUC was 95.7%. As shown in Figure 3B-C, the pattern of separation by the autoencoder was similar between training, validation, and independent sets. They all showed separation between ABC and GCB with a diagonal line from (−1, −1) to (1,1), although the independent 60 cases were collected from a completely different set of samples and the sequencing was performed separately.
The performance of our NGS-COO classifier was also evaluated by correlating with survival outcomes. Although the autoencoder was only trained for COO classification in the training set, the NGS-COO classifier was significantly associated with OS and progression-free survival (PFS) in DLBCL, similar to the previous COO classification (Figure 4A-C). The relative risk of the new ABC compared with the new GCB group was 1.53. The prognostic significance was slightly improved if comparing within high-confidence cases only (risk for OS, 1.81, P = .007; risk for PFS, 1.77, P = .0046).
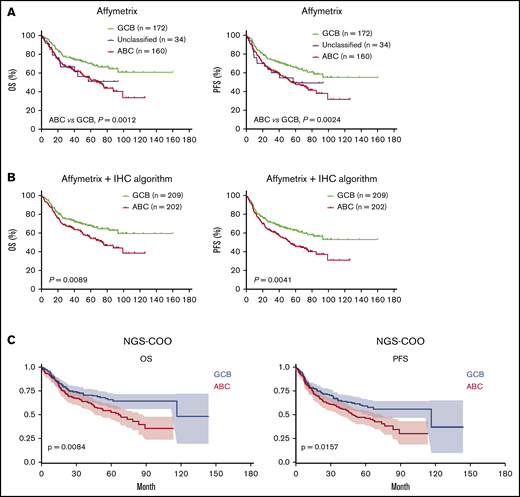
Survival curves for GCB vs ABC subtypes of DLBCL defined by previous classification methods and the new NGS-COO classifier. (A) Three subtypes defined by a 100-gene-classifier for gene-expression profiled cases using Affymetrix GeneChip. (B) GCB and ABC subtypes defined by a 100-gene-classifier and the Visco-Young IHC algorithm as described in "Patients and methods." (C) GCB and ABC subtypes defined by the new NGS-COO classifier.
Survival curves for GCB vs ABC subtypes of DLBCL defined by previous classification methods and the new NGS-COO classifier. (A) Three subtypes defined by a 100-gene-classifier for gene-expression profiled cases using Affymetrix GeneChip. (B) GCB and ABC subtypes defined by a 100-gene-classifier and the Visco-Young IHC algorithm as described in "Patients and methods." (C) GCB and ABC subtypes defined by the new NGS-COO classifier.
Development of prognostic models for DLBCL risk stratification
To build robust prognostic models aggregating small contributions of a large number of variables directly to patient survival, we used a similar procedure and the AI method to develop models in the training set and test the performance in the validation set based on both gene expression and genetic variables plus 2 additional factors: age and sex of patients. We first screened for significant variables using Kaplan-Meier and CPH for OS in the training set. Although 61 variables showed significant prognostic effects by log-rank test and 110 variables by CPH regression (P < .05), only the TP53 mutation remained statistically significant after adjusting for multiple hypothesis testing (FDR < 0.0001). Therefore, we selected 57 variables with the top 2% AUC values or P < .01 (either based on log-rank test or CPH; Table 4).
List of 57 variables (55 for gene expression level and 2 for gene mutation status) selected for building the NGS-OS risk model
| AFF3 | Age >60 | ASPSCR1 | BCL2 | BCL6 | BCORL1 |
| BHLHE22 | BTK | CARD11 | CCND2 | CD58 | CHEK2 |
| CIT | CREB3L2 | DST | ETS1 | EYA2 | FANCF |
| FZD6 | GAS5 | HMGA1 | HOXA9 | IRF4 | KDM5C |
| KLK2 | LFNG | LMO2 | MACROD1 | MALAT1 | MEF2B/MEF2BNB-MEF2B |
| MFNG | MLLT4 | MTCP1 | TET2 mutation | TP53 mutation | MYC |
| PIM1 | POLD1 | PPP3CA | RABEP1 | RAD51B | RBM6 |
| RECQL4 | RHBDF2 | RLTPR | RTEL1-TNFRSF6B | SMAD3 | SPTBN1 |
| SRRM3 | ST6GAL1 | SULF1 | SYP | TEAD2 | TFAP2A |
| TGFBR3 | U2AF2 | ZIC2 |
We used a similar neural network architecture as described for COO modeling and again included 2 neurons in the bottleneck layer to reduce the data into 2 dimensions (latent features). The top 7 variables contributing to the 2 latent features are age >60, TP53 mutation, CARD11 expression, BCL6 expression, MALAT1 expression, RABEP1 expression, and BCORL1 expression. A simple CPH model was built based on the 2 latent features obtained from the autoencoder (which are nonlinear combinations of the 57 variables) and provided a risk score (NGS-OS score) for each case, which was normalized to be between 0 (lowest risk) and 100 (highest risk). As shown in Figure 5A, we divided the training set into 3 equal subgroups based on the NGS-OS risk score and found the high-risk group had strikingly poorer survival than the low- and intermediate-risk groups (P < .0001). We then applied the NGS-OS model into the validation set and stratified patients using the same NGS-OS risk score cutoffs established in the training set and found that 3 resulting risk groups in the validation set showed incremental survival rates. The relative OS risk for the 3 subgroups was roughly 1, 4, and 9.
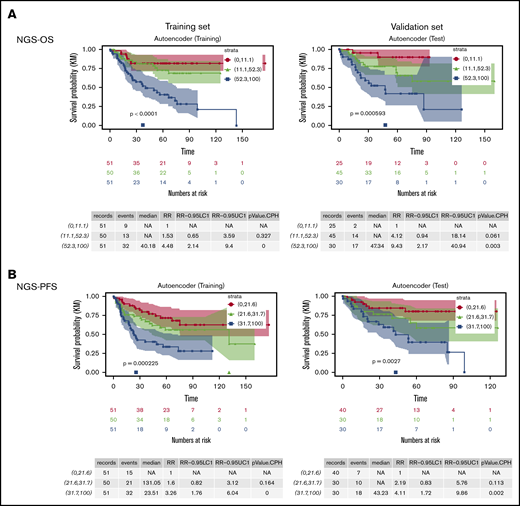
Risk stratification of DLBCL patients by the new NGS-survival risk scores from Cox proportional hazards models based on two latent features of the data obtained from the autoencoders. (A) OS curves of 3 risk groups defined by the NGS-OS risk scores. (B) PFS curves of 3 risk groups defined by the NGS-PFS risk scores.
Risk stratification of DLBCL patients by the new NGS-survival risk scores from Cox proportional hazards models based on two latent features of the data obtained from the autoencoders. (A) OS curves of 3 risk groups defined by the NGS-OS risk scores. (B) PFS curves of 3 risk groups defined by the NGS-PFS risk scores.
We followed a similar procedure to build a CPH model for PFS with 50 selected variables based on a 2-dimensional feature set obtained from an autoencoder (Table 5). The top 7 variables contributing to the model are TP53 mutation, CDK8 expression, LMO2 expression, BCR expression, TGFBR2 expression, CHD2 expression, and ETS1 expression. Although 24 variables are shared by the NGS-OS and NGS-PFS models, there are only 7 genes (AFF3, BCL6, CARD11, CCND2, IRF4, LMO2, and PIM1) shared by the NGS-COO and NGS-OS models and 5 genes (AFF3, BTLA, CREB3L2, FOXP1, and LMO2) shared by the NGS-COO and NGS-PFS models.
List of 50 variables (49 for gene expression level and TP53 gene mutation status) selected for building the NGS-PFS risk model
| AFF1 | AFF3 | ASPSCR1 | ATM | BCL2 | BCR |
| BTG2 | BTK | BTLA | CDK12 | CDK8 | CHD2 |
| CHEK2 | CIRH1A | CREB3L2 | DDIT3 | EDNRB | EPHB6 |
| ETS1 | FANCF | FOXP1 | FZD6 | GAB1 | GAS5 |
| GPR34 | IQCG | ITGA7 | KDM5C | KDSR | LAMA5 |
| LFNG | LIFR | LMO2 | MACROD1 | MAP2K5 | MFNG |
| TP53 mutation | MYC | NCSTN | NR6A1 | POU2AF1 | PRKCB |
| RLTPR | RPL22 | SHC2 | SMAD3 | SPTBN1 | ST6GAL1 |
| TEAD2 | TGFBR2 |
Similar with the NGS-OS risk scores, NGS-PFS risk scores identified one third of the training set and 30% of the validation set as high-risk patients (Figure 5B). The relative risk for the low-, intermediate-, and high-risk groups in the validation sets was roughly 1, 2, and 4, respectively.
Discussion
In this study, we developed novel DLBCL classification models based on both genetic and transcriptional variables derived from comprehensive RNA-Seq annotation and quantitative data. Molecular classification methods based on tumor biology can be categorized according to whether the model is based on normal or abnormal signatures and whether the measure is at the DNA (genetic), RNA (transcriptional), or protein level (summarized in the visual abstract according to the literature1-3,14,17-24,57,58,61,62,68,77,78 ). The mandatory COO classification for DLBCL with significant prognostic and therapeutic prediction values is originally based on unaltered normal B-cell GEP signatures and currently assayed by protein IHC algorithms in clinical practice, whereas the recently developed DLBCL genetic subtyping defines subtypes with shared genetic abnormalities based on co-occurring genetic alterations or coordinate genetic signatures. Therefore, genetic subtypes, such as the MCD/C5 subtype in ABC-DLBCL and the C3/EZB subtype in GCB-DLBCL,61,79 reduce the heterogeneity in COO subtypes with respect to pathogenic mechanisms (potentially also response to targeted therapies). However, the functional consequences of different genetic alterations defining a genetic subtype may vary, and pathogenic subtyping can also be achieved with phenotypic gene expression signatures.3 Different from genetic subtyping that assigned MYC/BCL2 double-hit lymphoma into multiple genetic subtypes (visual abstract),61,62 molecular high-grade (MHG) GEP signature or double-hit transcriptomic gene-expression signature (DHITsig) defined a distinct MHG or DHITsig-positive (DHITsig-pos) subgroup with poor prognosis in GCB-DLBCL.77,78 Only 36% of MHG and 52% of DHITsig-pos cases had MYC/BCL2 genetic double hit60,77,78; certain mutations and the EZB genetic subtype were enriched (but not exclusively or inclusively; overlapping percentages shown in visual abstract) in the MHG/DHITsig-pos DLBCL subgroup. In contrast to the COO classification and nuclear factor κB–activating genetic mutations that failed to predict clinical outcome of bortezomib,60 MHG GEP signature identified cases showing improved PFS with the addition of bortezomib to standard R-CHOP therapy (P = .08).77 Therefore, both genetic and phenotypic variables have advantages and disadvantages, and a combinational approach may better correlate DLBCL biology to therapeutic vulnerability and clinical outcome.
Our results demonstrated that both the NGS-COO classifier and NGS survival predictors were robust, and AI was able to assign COO/risk scores to new DLBCL cases (patients in the validation sets). Our NGS-COO classifier shared 8 genes with the 27-gene predictor by Wright et al (BCL6, CCND2, ETV6, IRF4, LMO2, LRMP, MYBL1, and PIM1),31 8 genes with the 20-gene DLBCL Automatic classifier by Barrans et al (BCL6, CCND2, ETV6, FOXP1, IRF4, LMO2, LRMP, and PIM1),30 7 genes with the 14-gene-qNPA assay (BCL6, CCND2, IRF4, LMO2, LRMP, MYBL1 and PIM1),35 and 3 genes with the NanoString Lymph2Cx assay (CREB3L2, MYBL1, and S1PR2).38 Seven of the total 11 common genes (BCL6, CCND2, CREB3L2, FOXP1, IRF4, LMO2, and PIM1) are also shared by our NGS survival predictors, consistent with the association of COO with clinical outcome. The NGS-OS/PFS risk predictors had more significant P values in prognostic analysis than the NGS-COO classifier in the same patient cohort, suggesting that COO is only one of the biological contributors to DLBCL clinical outcome. However, the performance of NGS-OS/PFS risk predictors for other therapies is unknown. Different from previous COO/prognostic models, we integrated genetic abnormalities: MYD88 and EZH2 mutations in the NGS-COO classification model, TP53 and TET2 mutations in the NGS-OS risk model, and TP53 mutation in the NGS-PFS model. Future studies may reveal whether our models can improve the practical significance of DLBCL prediction models by including both GEP and genetic features.
The high-throughput RNA-Seq assays developed in this study using an NGS benchtop sequencer with approximately 3-day turnaround time have important practical implications. Although targeted NGS platforms have been implemented in the clinic to aid in diagnosis and therapeutic decisions,80 and AI is emerging as an efficient tool in health care for large data processing and sophisticate model construction,76,81 currently no NGS panels and AI implementation have been developed for lymphoma diagnosis and management. Our study supports the reliability and practicality of using targeted NGS along with AI in generating clinically useful objective information. Compared with current IHC assays, DNA microarrays, and other GEP analysis techniques used for DLBCL COO classification, targeted RNA-Seq has a balanced advantage of genome-wide coverage, dynamic range of quantification, reproducibility, high throughput, and accuracy, as well as high sensitivity, automation, affordability, short assay time, and flexibility.82 As RNA-seq has become less costly and been integrated into clinical practice,80 we expect that the generated RNA-seq data will be used not only to answer the COO and prognostic questions but also other diagnostic and clinical questions impacting clinical decisions, such as predicting clinical responses to novel therapies in clinic and in future prospective or retrospective studies.80,83
In conclusion, the current proof-of-principle study demonstrates the potential utility of the targeted RNA-Seq assay for accurate and reproducible DLBCL-COO subclassification in daily clinical practice using a commercial available NGS platform; streamline analysis of high-throughput RNA-Seq data, COO assignment, and risk prediction by AI can further improve the workflow. Data portal and streamline AI integration can be further developed based on results in this study, which may provide a reliable tool for precision medicine and decision making by clinicians. However, the predictive and therapeutic values of the COO and risk stratification models developed in this large cohort of DLBCL remain to be determined in future prospective clinical studies.
Data are in the supplemental data file with 2 worksheets available with the article.
Acknowledgments
This work is supported by the Cancer Prevention & Research Institute of Texas, Genomic Testing Corporative Collaboration Funds, and National Cancer Institute, National Institutes of Health grants (1R01CA233490-01A1, R01CA138688, R01CA187415, and 1RC1CA146299). K.H.Y. is also supported by The Hagemeister Lymphoma Foundation, Gundersen Foundation, and a Duke University Institutional Research grant award. The study is also partially supported by Duke Cancer Center Support Grant.
Authorship
Contribution: Z.Y.X.-M., B.X., M.A., and K.H.Y. conceived and designed the study; Z.Y.X.-M., Hongwei Zhang, B.X., M.A., and K.H.Y. performed research; Z.Y.X.-M., Hongwei Zhang, F.Z., A.T., G.B., C.V., K.D., A.C., W.T., Y.Z., E.D.H., H.Y., J.H., M.P., A.J.M.F., M.B.M., B.M.P., J.H.v.K., M.A.P., J.N.W., F.B.H., B.S., I.D.D., Hong Zhang, Y.L., B.X., M.A., and K.H.Y. provided study thought, materials, key reagents, and technology; Z.Y.X.-M., Hongwei Zhang, F.Z., A.T., G.B., C.V., K.D., A.C., W.T., Y.Z., E.D.H., H.Y., J.H., M.P., A.J.M.F., M.B.M., B.M.P., J.H.v.K., M.A.P., J.N.W., F.B.H., B.S., I.D.D., Hong Zhang, Y.L., B.X., M.A., and K.H.Y. collected and assembled the data under approved IRB and material transfer agreements; Z.Y.X.-M., Hongwei Zhang, B.X., M.A., and K.H.Y. performed data analysis and interpretation; Z.Y.X.-M., B.X., M.A., and K.H.Y. wrote the manuscript; and all authors provided final approval of the manuscript.
Conflict-of-interest disclosure: I.D.D. and M.A. are employees of Genomic Testing Corporative, LCA. K.H.Y. receives research support from Roche Molecular Diagnostics, Adaptive Biotechnologies, Gilead Sciences, Seattle Genetics, Daiichi Sankyo, Incyte Corporation, and HTG Molecular Diagnostics. The remaining authors declare no competing financial interests.
Correspondence: Ken H. Young, Division of Hematopathology, Department of Pathology, Duke University School of Medicine, Duke University Medical Center and Cancer Institute, 40 Duke Medicine Cir, Room 265M, Box 3712, Duke South, Green Zone, Durham, NC 27710; e-mail: ken.young@duke.edu; Bing Xu, The First Affiliated Hospital of Xiamen University, 55 Zhenhai Rd, Siming District, Xiamen, Fujian 361003, China; e-mail: xubingzhangjian@126.com; and Maher Albitar, Genomic Testing Cooperative LCA, 175 Technology Dr, Irvine, CA 92618; e-mail: malbitar@genomictestingcooperative.com.

