

Key Points
In DLBCL, extra copies of MYC, BCL2, and BCL6 were not associated with poor outcomes.
Standard R-CHOP is an appropriate therapy for these patients.

Abstract
High-grade B-cell lymphoma (HGBL) with translocations involving MYC and BCL2 or BCL6 comprises ∼10% of cases of diffuse large B-cell lymphoma (DLBCL) and carries a poor prognosis. The incidence, prognosis, and optimal therapy for DLBCL harboring extra copies of the genes MYC, BCL2, and BCL6, rather than their genetic translocations, are unknown. In this retrospective, single-center study we identified 144 DLBCL cases including 46 patients with classic HGBL with double-hit or triple-hit chromosomal translocations (DHL), 55 with extra copies of MYC in addition to aberrations (extra copies or translocations) of BCL2 and/or BCL6 but did not meet the criteria for HGBL (EC group), and 43 without any aberrations of MYC, BCL2, or BCL6 (wild type [WT]). Unfavorable baseline characteristics had similar frequency in the EC and WT groups, but were significantly more prevalent in the DHL group. With a median follow-up of 36 months, the 2-year event-free survival (EFS) was similar between the WT and EC groups at 77% (95% confidence interval [CI], 65-90) and 82% (95% CI, 72-93), respectively. In contrast, the 2-year EFS of the DHL group was 63% (95% CI, 51-79). The 2-year overall survival in the WT, EC, and DHL groups was 86% (95% CI, 76-97), 89% (95% CI, 81-98), and 74% (95% CI, 62-88), respectively. Among patients treated with R-CHOP (rituximab, cyclophosphamide, doxorubicin, vincristine, and prednisone), the EC group had outcomes similar to those of the WT group. Our results indicate that patients with DLBCL with extra gene copies of MYC, BCL2, and BCL6 fare differently from those with HGBL and respond well to standard R-CHOP therapy.
Introduction
Diffuse large B-cell lymphoma (DLBCL) is one of the most common types of non-Hodgkin lymphoma, accounting for ∼30% of all newly diagnosed cases worldwide.1 Survival rates for DLBCL have improved over the past few decades because of the addition of rituximab to anthracycline-based combinations.2 Currently, the standard of care for first-line therapy is R-CHOP (rituximab, cyclophosphamide, doxorubicin, vincristine, and prednisone), which is associated with a response rate of ∼80% and prolonged remissions of at least 5 years in 66% of cases.3,4 Patients who progress and require salvage therapy have a poor prognosis, with 3-year event-free survival (EFS) as low as 30%.5 Even in fit patients, ∼50% of those who respond to salvage chemotherapy and receive autologous stem cell transplant (ASCT) will ultimately relapse.6
In 2016, the World Health Organization classification for lymphoma included a new category termed "high-grade B-cell lymphoma (HGBL) with translocations involving MYC and BCL2 or BCL6."7 These lymphomas (previously known as double- and triple-hit lymphomas) include 7% to 10% of DLBCL cases and may carry a worse prognosis when compared with cases of DLBCL not otherwise specified. However, intensive therapies, such as dose-adjusted R-EPOCH (rituximab, etoposide, prednisone, vincristine, doxorubicin, and cyclophosphamide) have appeared superior to R-CHOP in retrospective series.8,9 The National Comprehensive Cancer Network guidelines state that, for patients with HGBLs with translocations of MYC and BCL2 and/or BCL6, R-CHOP has been associated with inferior outcomes, although no standard-of-care regimen has been formally established.10
In clinical practice, clinicians frequently receive a pathologic diagnosis that includes, not only the status of MYC, BCL2, and BCL6 translocations, but also the aberrations in their copy numbers. Although the presence of double or triple chromosomal translocations has been found to confer a poor prognosis, the clinical significance of copy number alterations in the same genes remains unknown. In a retrospective study, 76 of 663 patients with DLBCL were found to have extra copies of MYC, BCL2, or BCL6, and the researchers concluded that the presence of extra copies of MYC, either alone or in combination with extra copies of BCL2 or BCL6, was in fact associated with worse overall survival (OS). In addition, patients with either double- or triple-extra copy status treated with an intensive induction regimen did better than those who received standard R-CHOP.11 More recently, Schieppati et al12 reported that MYC extra copies were significantly associated with worse prognosis only if there were 3 or more. However, there are no guidelines or standard practices for treating or predicting outcomes of patients with extra copiesof these genes. With this background, we sought to assess treatment response and survival outcomes of patients with DLBCL who harbor a MYC extra copy gain in addition to a second gene aberration in BCL2 and/or BCL6 (EC) in comparison with a traditional high-risk group consisting of patients with "double- or triple-hit lymphoma" (DHL)and with a group of patients with no such aberrations (wild-type [WT] group).
Methods
This was a single-center retrospective study of all adults (age, ≥18 years) with DLBCL (including transformed indolent lymphoma and T-cell/histiocyte-rich large B-cell lymphoma) who were treated with an anthracycline-based regimen as the frontline therapy at Memorial Sloan Kettering Cancer Center (MSKCC) from 2001 through 2017 and who underwent fluorescence in situ hybridization (FISH) evaluation of their diagnostic pathologic sample. The study was approved by the Institutional Review Board and conducted in accordance with the Declaration of Helsinki. Eligible patients were identified by performing an institutional database query, and data were collected exclusively from electronic medical records.
The presence of translocations was defined as gene breakage occurring in at least 10% of the nuclei. Without a validated cutoff value for the number of involved nuclei, the presence of an extra copy was defined as at least 1 copy gain (ie, >2 signals) in at least 10% of the nuclei. In addition, analysis of a minimum of 100 cells was necessary. Gene amplifications were defined by 3 or more extra copies of MYC, BCL2, or BCL6. FISH analyses that were performed by the MSKCC Department of Pathology used Locus-Specific Identifier (LSI) dual-color, break-apart probes from Abbott Molecular, Inc (Des Plaines, IL). Of note, centromeric probes were not used, and thus it was not possible to distinguish between extra signal copies and cases of polyploidy. Cell of origin was determined by immunohistochemistry according to the Hans algorithm.13
Based on FISH results, patients were divided into 3 cohorts. The DHL group was defined as having a MYC translocation and a BCL2 and/or BCL6 translocation. The EC group was defined as having a MYC extra copy plus at least 1 additional gene aberration (either a translocation or extra copy) of BCL2 and/or BCL6. The WT group comprised all known cases of unaltered MYC, BCL2, and BCL6 (no translocation or extra copy). Cases with incomplete or missing FISH reports, or those in which the extra copy and translocation status of MYC, BCL2, and BCL6 was not clearly annotated were excluded from analysis.
The type of induction regimen was grouped into 2 categories based on treatment. The R-CHOP group included patients receiving standard R-CHOP therapy and those treated in clinical trials with an R-CHOP backbone. The intensive-therapy group included patients treated with DA-EPOCH-R (dose-adjusted EPOCH with rituximab), CODOX/M-IVAC (cyclophosphamide, vincristine, doxorubicin, high-dose methotrexate, ifosfamide, etoposide, and high-dose cytarabine), a sequential R-CHOP/R-ICE (ifosfamide, carboplatin, etoposide) regimen, and upfront ASCT consolidation.
Patients’ characteristics were compared across the EC, DHL, and WT groups by using χ2 and Fisher’s exact tests. The primary outcomes for this study were response, EFS, and OS, compared across the 3 FISH groups (WT, EC, and DHL). Disease response assessment, including complete response (CR), partial response, stable disease, and progressive disease were made according to the Lugano criteria.14 Fisher’s exact test was used to compare disease responses across the FISH groups.
EFS was defined as time from start of treatment until refractory, progressive, or relapsed disease or until death from any cause. OS was defined as time from diagnosis until death of any cause. Patients alive and without an event were censored on 1 September 2019. Kaplan-Meier methods were used for analysis of EFS and OS and to calculate 1- and 2-year event rates with 95% confidence intervals (CIs). Differences in EFS and OS in the EC, DHL, and WT groups were compared by using the log-rank test. Multivariable survival models were developed by performing univariable Cox regression models and including FISH group in addition to covariates that were significant in univariable analyses. Hazard ratios and 95% CIs are reported.
Subanalyses were performed comparing FISH groups within treatment regimens to describe outcomes. Because of small sample sizes and low event rates, multivariable analyses were not pursued. A subanalysis was also performed of patients in the EC group, to evaluate the impact of the presence of a gene amplification versus no amplification with respect to outcome variables. Last, outcomes were analyzed within an advanced-stage subgroup. All computations were performed in R v3.6.1 (Vienna, Austria). P < .05 indicates statistically significant results.
Results
Of 2068 patients with DLBCL treated at MSKCC from 2001 through 2017, 1155 patients were treated after the 2010, when FISH testing for MYC began. Of those, 356 patients (45%) had available FISH reports, and of those, 144 were classified into 1 of the 3 FISH groups (WT, EC, or DHL), to arrive at the final inclusion population and eligibility for this analysis. (Figure 1). FISH was performed at MSKCC in 119 (83%) cases and at outside institutions in 25 (17%) of cases. Forty-three (30%) patients were in the WT group, 55 (38%) were in the EC group, and 46 (32%) were in the DHL group. The EC group consisted of 22 (40%) cases with 2 gene aberrations and 33 (60%) with 3 gene aberrations. One case of T-cell/histiocyte-rich large B-cell lymphoma was included. Germinal center B-subtype was observed in 87% of the DHL group, 67% of the WT group, and 54% of the EC groups. History of transformed indolent disease was most common in the EC and DHL groups (22% and 15%, respectively) and least common in the WT group (2%). The DHL group had the highest frequency of bulky disease (45%), elevated lactate dehydrogenase (LDH) serum levels (75%), presence of 2 or more extranodal sites (46%), and high International Prognostic Index (IPI) (67%). No major differences were noted between the EC and the WT groups in the frequency of IPI categories, bulk, or extranodal sites (Table 1).

Consort. Of 2068 patients with DLBCL treated at MSKCC from 2001 through 2017, 1155 patients were treated after 2010, when FISH testing for MYC began. Of those, 356 patients (45%) had available FISH reports, and of those, 144 qualified for classification into 1 of the 3 FISH groups for the final inclusion population, including 46, 55, and 43 in the DHL, EC, and WT groups, respectively.
Consort. Of 2068 patients with DLBCL treated at MSKCC from 2001 through 2017, 1155 patients were treated after 2010, when FISH testing for MYC began. Of those, 356 patients (45%) had available FISH reports, and of those, 144 qualified for classification into 1 of the 3 FISH groups for the final inclusion population, including 46, 55, and 43 in the DHL, EC, and WT groups, respectively.
Patient and disease characteristics
| EC | DHL | WT | P | |
|---|---|---|---|---|
| No. of patients | 55 | 46 | 43 | |
| Age at diagnosis >60 y | 30 (55) | 28 (61) | 24 (56) | .80 |
| Sex | .56 | |||
| Female | 21 (38) | 19 (41) | 21 (49) | |
| Male | 34 (62) | 27 (59) | 22 (51) | |
| Histology | ||||
| DLBCL NOS | 54 (98) | 46 (100) | 43 (100) | |
| T-cell/histiocyte-rich | 1 (1.8) | 0 (0) | 0 (0) | |
| Cell of origin | .002 | |||
| GCB | 28 (54) | 39 (87) | 26 (67) | |
| ABC | 24 (46) | 6 (13) | 13 (33) | |
| Unknown | 3 | 1 | 4 | |
| De novo | 43 (78) | 39 (85) | 42 (98) | .014 |
| Transformed indolent | 12 (22) | 7 (15) | 1 (2) | |
| Ki67 ≥90% | 21 (40) | 23 (53) | 19 (45) | .44 |
| Unknown | 3 | 3 | 1 | |
| ECOG score >1 | 14 (25) | 14 (30) | 9 (21) | .59 |
| Stages III-IV | 36 (65) | 37 (80) | 28 (65) | .18 |
| B symptoms | 9 (16) | 4 (8.7) | 8 (19) | .37 |
| IPI ≥3 | 24 (44) | 31 (67) | 20 (47) | .040 |
| Bulk ≥10 cm | 15 (28) | 19 (45) | 9 (22) | .059 |
| Unknown | 2 | 4 | 2 | |
| Elevated LDH | 29 (53) | 33 (75) | 20 (47) | .017 |
| Unknown | 0 | 2 | 0 | |
| Extranodal sites >1 | 18 (33) | 21 (46) | 16 (37) | .1 |
| CNS involvement | ||||
| Negative | 8 (80) | 21 (88) | 17 (89) | |
| Positive | 2 (20) | 3 (12) | 2 (11) | |
| Unknown | 45 | 22 | 24 | |
| First-line treatment | <.001 | |||
| R-CHOP based | 37 (67) | 12 (26) | 28 (65) | |
| Intensive based | 18 (33) | 34 (74) | 15 (35) |
Unless stated otherwise, data are expressed as the number of patients (percentage of total patients in the group). Bold indicates statistically significant results.
ABC, activated B-cell type; CNS, central nervous system; DLBCL NOS, diffuse large B-cell lymphoma not otherwise specified; GCB, germinal center B-cell type; PMBCL, primary mediastinal B-cell lymphoma.
Across all groups, 77 patients (53%) were treated with R-CHOP–based therapy and 67 (47%) with intensive therapies. The majority of patients with DHL (74%) were treated with intensive therapies, whereas 67% of patients in the EC group and 65% of patients in the WT group were treated with R-CHOP (Table 1). Four patients underwent upfront ASCT consolidation: 2 patients in the DHL group and 2 in the EC group. After frontline therapy, patients in the WT and EC groups achieved an 86% and 93% CR rate, respectively, compared with a 67% CR rate in the DHL group (P = .003). In each of the 3 groups, the relapse rate after achieving a CR was similar at only 9% (Table 2).
Outcomes by FISH group
| EC | DHL | WT | P | |
|---|---|---|---|---|
| Total patients, n | 55 | 46 | 43 | |
| Response to induction, n (%) | .01 | |||
| CR | 51 (93) | 31 (67) | 37 (86) | |
| PR | 2 (3.6) | 2 (4.3) | 1 (2.3) | |
| SD or PD | 2 (3.6) | 11 (24) | 5 (12) | |
| Died | 0 (0) | 2 (4.3) | 0 (0) | |
| Progression after induction, n (%) | .10 | |||
| Refractory | 4 (7.3) | 12 (26) | 6 (14) | |
| Relapse | 5 (9.1) | 4 (8.7) | 4 (9.3) | |
| 2-y EFS, % (95% CI) | 82 (72-93) | 63 (51-79) | 77 (65-90) | .052 |
| 2-y OS, % (95% CI) | 89 (81-98) | 74 (62-88) | 86 (76-97) | .42 |
Unless stated otherwise, data are the number of patients (percentage of total patients in the group). Bold indicates statistically significant results.
PR, partial response; SD, stable disease; PD, progressive disease; ORR, overall response rate.
The median follow-up was 36 months (interquartile range, 16-88) among survivors. The median EFS and OS for all 144 patients were not reached. The 2-year EFS and OS were 74% (95% CI, 67-82) and 83% (95% CI, 77-90), respectively, for the entire cohort (Figure 2). The difference in EFS in the 3 groups trended toward statistical significance (P = .052), whereas there was not a statistically significant difference in OS (P = .42) (Figure 3; Table 2). However, by pairwise comparison, the EC group was found to have a significantly longer EFS than the DHL group (P = .02) and an EFS similar to that of the WT group (P = .55) (supplemental Figure 1). Kaplan-Meier curves for advanced-stage patients alone are depicted in supplemental Figure 2.
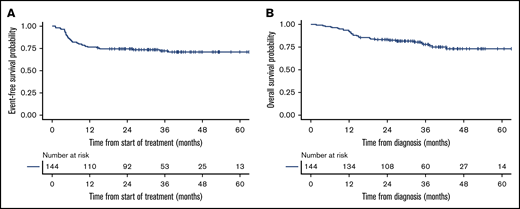
Kaplan-Meier curves of entire 144 patient inclusion population. EFS (A) and OS (B).
Kaplan-Meier curves of entire 144 patient inclusion population. EFS (A) and OS (B).
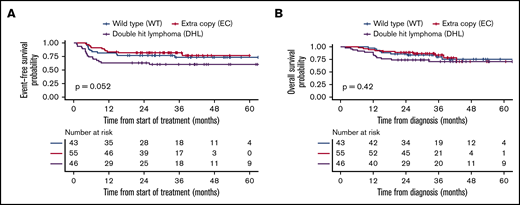
Kaplan-Meier curves stratified by FISH group. Comparison of EFS (A) and OS (B) in the 3 FISH groups.
Kaplan-Meier curves stratified by FISH group. Comparison of EFS (A) and OS (B) in the 3 FISH groups.
In univariable analyses, Eastern cooperative oncology group (ECOG) score, disease stage, B symptoms, elevated LDH serum levels, IPI, and number of extranodal sites were found to be significantly associated with both EFS and OS. The FISH group category was not statistically significant for EFS (P = .06) or OS (P = .4). In a multivariable analysis, only an ECOG score >1 was significantly associated with shorter EFS (P = .032) and OS (P = .006) (Table 3).
Univariable and multivariable analysis
| EFS | OS | |||||||
|---|---|---|---|---|---|---|---|---|
| Univariable HR | P | Multivariable HR | P | Univariable HR | P | Multivariable HR | P | |
| Age >60 y | 1.5 (0.8-2.9) | .2 | 1.7 (0.8-3.6) | .2 | ||||
| ABC subtype | 1.3 (0.7-2.4) | .5 | 1.4 (0.7-2.9) | .4 | ||||
| Ki67 ≥90% | 0.9 (0.5-1.8) | .8 | 1.2 (0.6-2.4) | .6 | ||||
| ECOG score >1 | 4.4 (2.4-8.3) | <.001 | 2.2 (1.1-4.5) | .032 | 6.1 (3.0-12.5) | <.001 | 3.3 (1.3-7.9) | .006 |
| Stages III-IV | 6.6 (2.0-21) | <.001 | 1.9 (0.5-7.3) | .3 | 4.8 (1.5-15.8) | .001 | 1.3 (0.3-5.5) | .7 |
| B symptoms | 2.4 (1.2-4.9) | .026 | 1.7 (0.7-3.7) | .2 | 3.0 (1.4-6.4) | .008 | 1.9 (0.8-4.5) | .2 |
| Bulk (≥10 cm) | 0.7 (0.3-1.5) | .3 | 0.5 (0.2-1.2) | .11 | ||||
| Elevated LDH | 5.9 (2.3-15) | <.001 | 2.5 (0.85-7.3) | .08 | 4.3 (1.6-11.1) | <.001 | 1.6 (0.5-5.2) | .4 |
| Extranodal sites >1 | 7.6 (2.3-25) | <.001 | 3.0 (0.8-11) | .2 | 8.1 (1.9-34.7) | .001 | 3.7 (0.77-17.9) | .11 |
| FISH | ||||||||
| WT | Ref | .063 | .2 | Ref | .4 | .5 | ||
| EC | 0.8 (0.3-1.8) | 0.8 (0.4-2.0) | 0.9 (0.4-2.3) | 1.1 (0.4-2.8) | ||||
| DHL | 1.8 (0.9-3.8) | 1.7 (0.8-3.9) | 1.5 (0.7-3.6) | 1.8 (0.7-4.5) | ||||
Data are HR (95% CI). Bold indicates statistically significant results.
ABC, activated B cell; ECOG, Eastern cooperative oncology group; HR, hazard ratio; Ref, reference.
Among the 77 patients who received R-CHOP induction, outcomes were poorest in the DHL group. Patients with DHL had a CR rate of 58% compared with the WT (100%) and EC (95%) groups (P < .001). Two-year EFS in this group was 58% (95% CI, 36-94) compared with 89% (95% CI, 79-100) and 84% (95% CI, 73-97) in the WT and EC groups, respectively (P = .047). These differences were mirrored in OS (though not statistically significant) with 2-year OS of 58% (95% CI, 36-94), 100%, and 92% (95% CI, 84-100) in the DHL, WT, and EC groups, respectively (P = .07) (Table 4; Figure 4). In the 67 patients treated with intensive therapies, there were no significant differences in EFS or OS in the 3 FISH groups (Table 4; Figure 5).
Outcomes by FISH status in the R-CHOP and intensive therapy subgroups
| Total no. | 2-y EFS | 2-y OS | CR | |
|---|---|---|---|---|
| WT | ||||
| R-CHOP | 28 | 89 (79-100) | 100 (100-100) | 100 |
| Intensive | 15 | 53 (33-86) | 60 (40-91) | 60 |
| EC | ||||
| R-CHOP | 37 | 84 (73-97) | 92 (84-100) | 95 |
| Intensive | 18 | 78 (61-100) | 83 (68-100) | 89 |
| DHL | ||||
| R-CHOP | 12 | 58 (36-94) | 58 (36-94) | 58 |
| Intensive | 34 | 65 (50-83) | 79 (67-94) | 71 |
Data are the percentage of the group (95% CI), unless otherwise indicated.

Kaplan-Meier curves for the R-CHOP subgroup. Comparison of EFS (A) and OS (B) in the 3 FISH groups.
Kaplan-Meier curves for the R-CHOP subgroup. Comparison of EFS (A) and OS (B) in the 3 FISH groups.

Kaplan-Meier curves for the intensive therapy subgroup. Comparison of EFS (A) and OS (B) in the 3 FISH groups.
Kaplan-Meier curves for the intensive therapy subgroup. Comparison of EFS (A) and OS (B) in the 3 FISH groups.
When FISH group and type of therapy were considered concurrently, patients in the WT group treated with R-CHOP had the best outcomes, followed closely by patients in the EC group treated with R-CHOP. The worst outcomes were seen in patients with DHL treated with R-CHOP and those in the WT group treated with intensive therapies. Outcomes for the EC group were similar to WT when R-CHOP was used. Moreover, use of intensive therapy rather than R-CHOP in the EC group did not lead to improvement in CR rates (89% vs 95%), 2-year EFS (78% vs 84%), or 2-year OS (83% vs 92%) (Table 4; supplemental Figure 3).
Last, a subgroup analysis was performed within the EC group to evaluate the prognostic impact of the presence of gene amplification. Of 55 patients, amplification status was reported in only 51 patients. Among these, 17 were determined to have an amplification, and 34 were not. The presence of an amplification was not associated with differences in the CR rate, EFS, or OS (supplemental Figure 4).
Discussion
The prognostic significance of extra copies of MYC, BCL2, and BCL6 as opposed to gene translocations is unclear. In this study, we wanted to compare clinical characteristics and treatment outcomes in patients with DLBCL harboring extra copies of MYC, in addition to aberrations in BCL2 and/or BCL6, but not meeting criteria for HGBL (ie, the EC group) compared with a WT group and classic HGBL. We found that patients in the EC group had a phenotype and disease course similar to those in the WT group, with both groups having considerably better outcomes than the DHL group.
The few prior studies investigating prognosis in patients with extra copies of MYC, BCL2, and/or BCL6 were heterogeneous, consisted of small samples, and presented conflicting results. Landsburg et al15 investigated MYC aberrations alone and reported that 22 patients with MYC amplifications had a similar 2-year OS compared with MYC-normal patients. Oki et al9 identified patients with extra copies in a single gene (MYC = 32; BCL2 = 16) and found no impact on EFS or OS. Haws et al16 also concluded there were no differences in outcomes in 33 cases of MYC extra copies. In contrast, Lu et al17 investigated both single- and dual-gene aberrations and determined that cases of MYC (n = 18) or BCL2 (n = 65) extra copies had worse PFS and OS relative to negative cases. In addition, the OS curves for the 9 cases of dual MYC/BCL2 extra copies were shown to overlap with the 7 cases of classic DHL. Quesada et al11 identified 43 cases of "double or triple extra copy lymphoma" that were defined by MYC extra copies in combination with an aberration in BCL2 or BCL6. Their analysis demonstrated inferior OS in those cases compared with cases of normal MYC status. Finally, the most recent study by Schieppati et al12 examined 55 cases with extra copies of MYC as well as a subset of 25 with extra copies of both MYC and BCL2. They determined that outcomes were inferior only when the MYC extra copy number was ≥3.
The current study presents data from a large retrospective series of patients with DLBCL harboring extra copies of MYC, BCL2, and/or BCL6. In addition, it identifies a unique category of patients inadequately characterized in the literature, which includes patients harboring a combination of extra copies and translocations of different genes (ie, the EC group). Baseline and disease characteristics in our study were generally consistent with a DLBCL population treated at a large research hospital. Patients with DHL had a higher frequency of poor prognostic factors, which would be expected from this group relative to the WT group.
Disease presentation and prognosis were found to be similar between the EC and WT FISH groups. Unfavorable characteristics, such as those that compose the IPI and have been validated to predict disease outcomes in the rituximab era, occurred with similar frequency in those 2 groups.18 In contrast, those factors were disproportionately represented in the DHL group. Patients in the EC group had an excellent response to frontline chemoimmunotherapy and exhibited EFS and OS that mirrored those of the WT group. As depicted by the Kaplan-Meier curves, the EFS of the DHL group was significantly worse than that of the EC group. Of note, the high percentage of treatment failures in the DHL group was mainly related to chemorefractory disease, whereas the relapse rate of those attaining a CR after frontline therapy in this group was similar to that seen in EC or WT patients. Overall, our findings support prior observations that DHL has uniquely aggressive biology and suggests that the clinical manifestations of the EC group may be more consistent with those of the WT group.
When groups were stratified into more homogeneous populations by first-line treatment category (ie, R-CHOP or intensive), the most notable observation was the inferior outcome of DHL compared with other FISH groups receiving R-CHOP in contrast to the similar survival curves of all 3 groups receiving intensive therapy. This finding suggests that use of intensive therapy may somewhat mitigate the adverse prognostic impact of DHL but may be associated with inferior outcomes in the EC and WT groups. When examining FISH groups and treatment regimens concurrently, intensive therapy appeared to be associated with better OS in DHL compared with R-CHOP (a finding supported in the literature), although there does not appear to be any benefit in outcomes, notably CR, EFS, or OS, in patients with EC or WT.
Several limitations of the current study should be noted. First, the EC cohort was a heterogeneous group, consisting of patients with 2 or 3 gene aberrations and both translocations and extra copies of BCL2 and/or BCL6. In attempt to make our groups more homogeneous, the total number of patients in the EC and WT groups was relatively small, which may have precluded the statistical significance of the data. In addition, our study excluded analysis of other potentially clinically important small subgroups (eg, extra copies of MYC without aberrations in BCL2 or BCL6), which limits the generalizability of our data. Also, treatment subgroups were heterogeneous. The R-CHOP group included patients with treatment protocols that contained added experimental agents, and the intensive therapy group included those treated with R-DA-EPOCH, sequential R-CHOP/R-ICE, and upfront ASCT. Even with combined therapies, only 12 patients with DHL were treated with R-CHOP and only 18 EC patients were treated with intensive therapy. These small numbers limited our ability to detect differences in response and survival outcomes between groups. In addition, the 15 patients in the WT group who were treated with intensive therapy had unexpectedly poor outcomes (most likely partially caused by treatment selection bias for patients presenting with aggressive disease). Finally, given the retrospective nature of this study, selection bias and heterogeneity between groups introduced many confounding variables. Multivariable analysis attempts to adjust for these differences between groups; however, in our study the total number of events and number of patients in each group were relatively small and may have limited our ability to detect a statistically significant difference in prognosis for the DHL group by using multivariable analysis.
In summary, the EC group was not found to have a worse prognosis than the WT group. In addition, using intensive therapy over R-CHOP did not provide a benefit in this group. Therefore, given the potential for increased toxicity, our findings do not support its use for these patients in the absence of other indications.
Original data are available by e-mail request to the corresponding author, Anas Younes (anas.younes@astrazeneca.com).
Acknowledgment
This work was supported by National Institutes of Health, National Cancer Institute Cancer Center Support Grant P30 CA008748 (A.Y.).
Authorship
Contribution: D. Sermer contributed to study formulation and design, data collection, data analysis, and manuscript preparation; J.A.L. and V.S. contributed to data analysis, interpretation of results, and manuscript preparation; and all other authors made substantial contributions to all aspects of the preparation of the manuscript.
Conflict-of-interest disclosure: A.D. has received personal fees from Roche, Corvus Pharmaceuticals, Physicians’ Education Resource, Seattle Genetics, Peerview Institute, Oncology Specialty Group, Pharmacyclics, Celgene, Novartis, and Takeda and research grants from Roche. C.B. has received grant funding from Janssen, Novartis, Epizyme, Xynomics, Bayer, and BMS; has been a consultant to Life Sci, GLG, Celgene, Seattle Genetics, and Xynomics; and has received an honorarium from Dava Oncology. P.H. has received research support from Portola, Novartis/GSK, Molecular Templates, and Janssen Pharmaceuticals and has been a consultant to Karyopharm, Juno, Portola, Celgene, and AstraZeneca. S.H. has received research funding from ADCT Therapeutics, Aileron, Forty-Seven, Verastem, Kyowa Hakko Kirin, Millennium Pharmaceuticals Inc, Celgene, Trillium, and Daiichi Sankyo and has been a consultant to Astex, Affimed, Merck Sharp and Dome, Kyowa Hakko Kirin Pharma, Corvus Pharmaceuticals Inc, Celgene, Portola Pharmaceuticals, Takeda Millennium, Innate Pharma, Verastem, Miragen Therapeutics Inc, Seattle Genetics, and ADCT. A.K. has received research funding from AbbVie Pharmaceuticals, Adaptive Biotechnologies, Pharmacyclics, and Seattle Genetics and has served on advisory boards for Celgene and AstraZeneca. A.N. has received honoraria from Janssen, Pharmacyclics, and Prime Oncology; has been a consultant to Medscape; has served on the advisory board of Janssen and on the speakers bureau of Prime Oncology; and has received research funding from Rafael Pharma and Pharmacyclics. A.M. has received research support from Seattle Genetics, Merck, Bristol-Myers Squibb, and Incyte and has received honoraria from Kyowa Hakko Kirin Pharma, Miragen Therapeutics, Takeda Pharmaceuticals, ADC Therapeutics, Seattle Genetics, Cell Medica, Bristol-Myers Squibb, and Erytech Pharma. D. Straus has been a consultant to inPractice Elsevier and Seattle Genetics and has served on the speakers bureau of Medical Crossfire. A.Z. has been a consultant to Genentech/Roche, Gilead, Celgene, Janssen, Amgen, Novartis, Adaptive Biotechnology, and Verastem; has served on the advisory boards of MorphoSys, Gilead, Genentech, AbbVie, AstraZeneca, and Pharmacyclics; and has received research funding from MEI Pharmaceuticals, Roche, Gilead, and Beigene. A.Y. has received research support from Janssen, Curis, Merck, BMS, Syndax, and Roche and honoraria from Janssen, AbbVie, Merck, Curis, Epizyme, Roche, and Takeda and has been a consultant to Biopath, Xynomics, Epizyme, Roche, Celgene, and HCM. The remaining authors declare no competing financial interests.
Correspondence: Anas Younes, Lymphoma Service, Memorial Sloan Kettering Cancer Center, 1275 York Ave, New York, NY 10021; e-mail: anas.younes@astrazeneca.com.

