

Key Points
Among the 3 isoforms of C/EBPβ, LIP is upregulated prior to LAP/LAP* and facilitates the proliferation of HSPCs during regeneration.
Subsequent upregulation of LAP/LAP* promotes differentiation of the amplified HSPCs toward the myeloid lineage.

Abstract
The transcription factor CCAAT enhancer-binding protein β (C/EBPβ) is required for stress-induced granulopoiesis at the level of hematopoietic stem/progenitor cells (HSPCs); however, its role and mechanisms of action in HSPCs are unknown. In this study, we assessed the regulation and functions of C/EBPβ in HSPCs, especially under stress conditions. After 5-fluorouracil treatment or bone marrow transplantation, Cebpb−/− HSPCs exhibited impaired cell-cycle activation and myeloid differentiation at the early and late phases of regeneration, respectively, whereas at steady state, Cebpb deficiency did not affect HSPCs. C/EBPβ was upregulated in response to hematopoietic stress, especially in CD150high long term-hematopoietic stem cells (LT-HSCs). Intracellular flow cytometric analysis that detected distinct domains of C/EBPβ revealed that, among the 3 isoforms of C/EBPβ, liver-enriched inhibitory protein (LIP) was upregulated in LT-HSCs prior to liver-enriched activating protein (LAP)/LAP* during regeneration. Early upregulation of LIP promoted cell-cycle entry of LT-HSCs by positively regulating Myc and expanded the HSPCs pool. Subsequent myeloid differentiation of amplified HSPCs was mediated by LAP/LAP*, which were upregulated at a later phase of regeneration. Collectively, our findings show that stress-induced sequential upregulation of C/EBPβ isoforms is critical for fine-tuning the proliferation and differentiation of regenerating HSPCs.
Introduction
Proliferation, self-renewal, and differentiation of hematopoietic stem cells (HSCs) is tightly controlled.1,2 Upon exposure to hematological stress, such as infection, inflammation, treatment with chemotherapeutic agents, or transplantation into irradiated recipients, HSCs undergo drastic changes characterized by rapid cell-cycle entry and accelerated differentiation, especially toward the myeloid lineage, at the expense of self-renewal capacity, to meet the increasing hematopoietic demand.3-6 Activation and recruitment of myeloid-biased HSCs underlie the elevated level of myeloid-biased differentiation under stress conditions.7 A recent study showed that all lineage-biased multipotent progenitor (MPP) subsets are independent progenies of long-term HSCs (LT-HSCs) or short-term HSCs (ST-HSCs).8 In response to hematopoietic stresses, replenishment of myeloid-biased MPPs (megakaryocyte-biased MPP2s and granulocyte/macrophage-biased MPP3s) from HSCs is upregulated, and the fate of lymphoid-biased MPP4s is reprogrammed toward the myeloid lineage. Together, these findings suggest that myeloid transcription factors are involved in the altered behavior of hematopoietic stem/progenitor cells (HSPCs) under stress conditions.
CCAAT enhancer-binding proteins (C/EBPs) are a family of leucine zipper transcription factors. C/EBPα accelerates differentiation and inhibits proliferation of HSPCs, and thus is indispensable to the maintenance of steady state granulopoiesis.9-11 In contrast, C/EBPβ plays critical roles in stress-induced granulopoiesis, which requires the differentiation and proliferation of granulopoietic precursors.12-16 We and others demonstrated that C/EBPβ is required at the level of HSPCs in stress conditions.17-20 However, the roles of C/EBPβ in the regulation of HSPCs, as well as its molecular mechanisms of action, remain largely unclear.
The Cebpb gene contains a single exon, and 3 isoforms (liver-enriched activating protein* [LAP*], LAP, and liver-enriched inhibitory protein [LIP]) are translated from its unique mRNA.21,22 These isoforms have distinct functions, and the ratio of LIP to LAP*/LAP (termed the LIP/LAP ratio) is an important determinant of C/EBPβ function.21-23 However, technical limitations have hampered intensive analysis of these isoforms in extremely rare cells such as HSCs. To overcome this obstacle, we developed an intracellular flow cytometric technique capable of detecting distinct domains of C/EBPβ. We then used this method to reveal the distinct functions of these isoforms and the critical roles of C/EBPβ in the regulation of HSPCs under stress conditions.
Methods
Intracellular double staining of C/EBPβ for flow cytometric analysis
After surface marker staining, bone marrow (BM) cells (1 × 10⁶ to 3 × 10⁶) were fixed and permeabilized using the Transcription Factor Buffer Set (BD Biosciences, Franklin Lakes, NJ), and stained with primary and secondary antibodies. For double staining of C/EBPβ isoforms, samples were stained with a goat anti-C–terminus antibody (C-19, sc-150G; Santa Cruz Biotechnology, Dallas, TX) and a rabbit anti-N–terminus antibody (#3807; Cell Signaling Technology, Danvers, MA), followed by an Alexa Fluor 647–conjugated donkey antigoat IgG antibody and a BV421-conjugated donkey antirabbit IgG antibody.
Statistics
Statistical analyses were performed using GraphPad Prism or Microsoft Excel. Statistical significance was calculated and determined by 2-tailed Student t test, except in Figures 6B and 7A, in which the 2-tailed paired Student t test was used. Values of P < .05 were considered statistically significant.
Supplemental materials and methods
Information regarding mice, cell lines, retrovirus vectors, BM transplantation, flow cytometric analysis, cell sorting, intracellular Ki67/7-amino actinomycin D staining, short-term BrdU incorporation assay, reverse transcription polymerase chain reaction (RT-PCR), immunoblotting, and chromatin immunoprecipitation–qualitative polymerase chain reaction (ChIP-qPCR) can be found in the supplemental Materials and methods.
Results
C/EBPβ is upregulated in HSPCs under stress conditions
To assess the significance of C/EBPβ in the regulation of HSPCs in vivo, we compared the numbers of HSPCs in the BM between wild-type (WT) and Cebpb−/− mice at steady state. The frequencies of KL (c-kit+Sca-1−lineage−) and KSL (c-kit+Sca-1+lineage−) cells corresponding to myeloid progenitors and HSPCs, respectively,24 were almost identical in WT and Cebpb−/− mice (Figure 1A). Within KSL cells, ST-HSCs, MPP2s, MPP3s, and MPP4s were defined on the basis of surface expression of CD135, CD48, and CD150 (supplemental Figure 1A).25,26 LT-HSCs were defined as CD135−CD150+CD48− KSL cells, or CD150+CD48− KSL cells when CD135 was not stained. The frequencies of these HSPCs subsets were also comparable between WT and Cebpb−/− mice (Figure 1B), suggesting that C/EBPβ is dispensable for the development and maintenance of HSPCs at steady state.
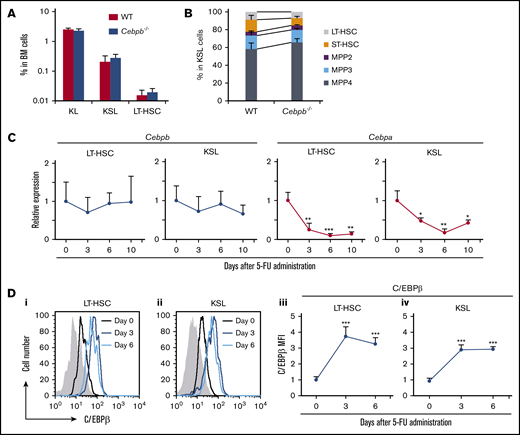
C/EBPβ is upregulated in HSPCs under stress conditions. (A) Frequencies of KL (c-kit+Sca-1−lineage−) cells, KSL (c-kit+Sca-1+lineage−) cells, and LT-HSCs (CD135−CD150+CD48− KSL cells) among BM cells from WT and Cebpb−/− mice (n = 5 per genotype). (B) Frequencies of LT-HSCs (CD135−CD150+CD48− KSL cells), ST-HSCs, MPP2s, MPP3s, and MPP4s among KSLs from WT and Cebpb−/− mice (n = 5 per genotype). (C) Cebpb and Cebpa mRNA expression in LT-HSCs (CD150+CD48− KSL cells) and KSL cells before and after 5-FU administration. mRNA levels were normalized against that of Gapdh, and the mean value on day 0 was set to 1 (n = 4 biological replicates of 1000-2000 pooled cells in 3 independent experiments per time point). (D) C/EBPβ protein expression in LT-HSCs (CD150+CD48− KSL cells) and KSL cells before and after 5-FU administration. Histograms for the nonspecific isotype control are shown in gray (i-ii). Changes in the relative MFI for C/EBPβ in LT-HSCs (iii) and KSL cells (iv) are plotted (n = 4 per time point in 2 independent experiments). Data are presented as means ± standard deviation (SD). *P < .05; **P < .01; and ***P < .001.
C/EBPβ is upregulated in HSPCs under stress conditions. (A) Frequencies of KL (c-kit+Sca-1−lineage−) cells, KSL (c-kit+Sca-1+lineage−) cells, and LT-HSCs (CD135−CD150+CD48− KSL cells) among BM cells from WT and Cebpb−/− mice (n = 5 per genotype). (B) Frequencies of LT-HSCs (CD135−CD150+CD48− KSL cells), ST-HSCs, MPP2s, MPP3s, and MPP4s among KSLs from WT and Cebpb−/− mice (n = 5 per genotype). (C) Cebpb and Cebpa mRNA expression in LT-HSCs (CD150+CD48− KSL cells) and KSL cells before and after 5-FU administration. mRNA levels were normalized against that of Gapdh, and the mean value on day 0 was set to 1 (n = 4 biological replicates of 1000-2000 pooled cells in 3 independent experiments per time point). (D) C/EBPβ protein expression in LT-HSCs (CD150+CD48− KSL cells) and KSL cells before and after 5-FU administration. Histograms for the nonspecific isotype control are shown in gray (i-ii). Changes in the relative MFI for C/EBPβ in LT-HSCs (iii) and KSL cells (iv) are plotted (n = 4 per time point in 2 independent experiments). Data are presented as means ± standard deviation (SD). *P < .05; **P < .01; and ***P < .001.
Our previous findings suggest that there is a specific requirement for C/EBPβ in stress conditions.12,16,17,18,20,27 To further characterize this requirement, we first measured Cebpb and Cebpa mRNA expression in HSPCs isolated from WT mice treated with 5-fluorouracil (5-FU). The gating strategy for LT-HSCs after 5-FU treatment was verified by expression of 2 other HSC markers, CD201 and endothelial cell-selective adhesion molecule28-30 (supplemental Figure 1B). Cebpb mRNA expression in LT-HSCs and KSL cells was not significantly altered by 5-FU treatment, whereas expression of Cebpa was significantly downregulated (Figure 1C). In contrast, intracellular flow cytometry revealed that C/EBPβ protein was significantly upregulated in LT-HSCs and KSL cells on days 3 and 6 after 5-FU treatment (Figure 1D). Taken together, these findings demonstrate that C/EBPβ has little impact on HSPCs at steady state but is upregulated at the protein level under stress conditions.
C/EBPβ is required in HSPCs under stress conditions
To assess the requirement for C/EBPβ in HSPCs, we performed a competitive repopulation assay (Figure 2). In these experiments, BM cells from WT or Cebpb−/− mice (CD45.2+) mixed with an equal number of competitor BM cells from CD45.1+ WT mice were transplanted into lethally irradiated recipient WT mice (CD45.1+). Chimerism of donor-derived CD45.2+ cells among 3 lineages (granulocytes, monocytes, and lymphocytes, as defined in supplemental Figure 1C) in the peripheral blood (PB) of the recipients was monitored monthly (Figure 2A). As we reported previously,31,32 the contribution of Cebpb−/− cells to monocytes was severely impaired. Moreover, chimerism of Cebpb−/− cells was significantly lower than that of WT donor cells among granulocytes and lymphocytes at 1 month after transplantation. At 6 months after transplantation, these differences were still observed in granulocytes and monocytes, but became less in total leukocytes or lymphocytes. At this time point, chimerism among LT-HSCs and KSL cells did not significantly differ between recipients of WT and Cebpb−/− cells (Figure 2B).
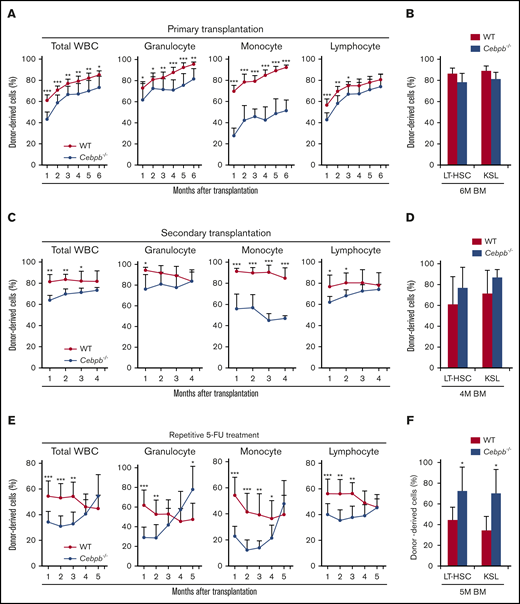
C/EBPβ is required in HSPCs under stress conditions. (A) CD45.2+ WT or Cebpb−/− whole BM cells (5 × 10⁵) and an equal number of WT whole BM cells (CD45.1+) were transplanted into lethally irradiated WT mice (CD45.1+). Chimerism of donor-derived (CD45.2+) cells among total white blood cells (WBCs), granulocytes, monocytes, and lymphocytes 1-6 months after the competitive BM transplantation was shown (n = 11 per group, representative of 3 independent experiments). (B) Chimerism of donor-derived cells among LT-HSCs (CD150+CD48− KSL cells) and KSL (c-kit+Sca-1+lineage−) cells obtained from recipients 6 months after competitive BM transplantation (n = 5 per group, representative of 3 independent experiments). (C) Six months after the primary transplantation, 2 × 10⁶ chimeric BM cells harvested from the primary recipients were transplanted into lethally irradiated WT recipients (CD45.1+; secondary transplantation). Graphs show chimerism of donor-derived cells in the indicated PB fractions 1-4 months after secondary transplantation (n = 11 per group, representative of 2 independent experiments). (D) Chimerism of donor-derived cells among LT-HSCs (CD150+CD48− KSL cells) and KSL cells in recipients 4 months after secondary transplantation (n = 5 per group, representative of 2 independent experiments). (E) CD45.2+ WT or Cebpb−/− whole BM cells (5 × 10⁵) and an equal number of WT whole BM cells (CD45.1+) were transplanted into lethally irradiated WT mice (CD45.1+), and the recipients were treated with 5-FU monthly starting 1 month after transplantation. Graphs show chimerism of donor-derived cells in the indicated cellular fractions of PB (n = 10 per group, representative of 2 independent experiments). (F) Chimerism of donor-derived cells among LT-HSCs (CD150+CD48− KSL cells) and KSL cells in recipients after 5 months of repetitive stress (n = 5 per group, representative of 2 independent experiments). Data are presented as means ± SD. *P < .05; **P < .01; and ***P < .001 (determined by the 2-tailed Student t test).
C/EBPβ is required in HSPCs under stress conditions. (A) CD45.2+ WT or Cebpb−/− whole BM cells (5 × 10⁵) and an equal number of WT whole BM cells (CD45.1+) were transplanted into lethally irradiated WT mice (CD45.1+). Chimerism of donor-derived (CD45.2+) cells among total white blood cells (WBCs), granulocytes, monocytes, and lymphocytes 1-6 months after the competitive BM transplantation was shown (n = 11 per group, representative of 3 independent experiments). (B) Chimerism of donor-derived cells among LT-HSCs (CD150+CD48− KSL cells) and KSL (c-kit+Sca-1+lineage−) cells obtained from recipients 6 months after competitive BM transplantation (n = 5 per group, representative of 3 independent experiments). (C) Six months after the primary transplantation, 2 × 10⁶ chimeric BM cells harvested from the primary recipients were transplanted into lethally irradiated WT recipients (CD45.1+; secondary transplantation). Graphs show chimerism of donor-derived cells in the indicated PB fractions 1-4 months after secondary transplantation (n = 11 per group, representative of 2 independent experiments). (D) Chimerism of donor-derived cells among LT-HSCs (CD150+CD48− KSL cells) and KSL cells in recipients 4 months after secondary transplantation (n = 5 per group, representative of 2 independent experiments). (E) CD45.2+ WT or Cebpb−/− whole BM cells (5 × 10⁵) and an equal number of WT whole BM cells (CD45.1+) were transplanted into lethally irradiated WT mice (CD45.1+), and the recipients were treated with 5-FU monthly starting 1 month after transplantation. Graphs show chimerism of donor-derived cells in the indicated cellular fractions of PB (n = 10 per group, representative of 2 independent experiments). (F) Chimerism of donor-derived cells among LT-HSCs (CD150+CD48− KSL cells) and KSL cells in recipients after 5 months of repetitive stress (n = 5 per group, representative of 2 independent experiments). Data are presented as means ± SD. *P < .05; **P < .01; and ***P < .001 (determined by the 2-tailed Student t test).
Next, we evaluated the self-renewal capacity of Cebpb−/− HSCs by performing secondary transplantations (Figure 2C). Six months after primary transplantation, 2 × 10⁶ BM cells harvested from the primary recipients were transplanted into lethally irradiated CD45.1+ WT recipients. Chimerism of Cebpb−/− cells in the secondary recipients was initially lower than that of WT cells but gradually increased to equal that of WT cells among all lineages except for monocytes. At 4 months, chimerism of Cebpb−/− cells was slightly higher than that of WT cells among LT-HSCs and KSL cells in the secondary recipients (Figure 2D), although this difference was not statistically significant. These results suggest that C/EBPβ is required for early engraftment and is possibly involved in the exhaustion of HSPCs in response to stress induced by transplantation.
We further investigated the impact of C/EBPβ on the differentiation and exhaustion of HSPCs under enhanced stress (Figure 2E). One month after competitive BM transplantation, recipient mice were subjected to monthly 5-FU treatment. Consistent with the results shown in Figure 2A,C, chimerism of Cebpb−/− cells was significantly lower than that of WT cells among all lineages at 1 month after transplantation. With repetitive 5-FU treatment, chimerism of Cebpb−/− cells among all lineages in PB increased over time and exceeded that of WT cells by 5 months after transplantation. In accordance with these changes in PB, chimerism of Cebpb−/− cells was significantly higher than that of WT cells among LT-HSCs and KSL cells (Figure 2F). Taken together, these data clearly suggest that C/EBPβ promotes the exhaustion of HSPCs under stress conditions.
C/EBPβ regulates proliferation of HSPCs under stress conditions
The differences between WT and Cebpb−/− cells during early engraftment could be because of a difference in the homing ability or early expansion of HSPCs. After confirming that the homing ability of Cebpb−/− KSL cells was similar to that of WT KSL cells (supplemental Figure 2), we assessed the role of C/EBPβ in the initial expansion of HSPCs (Figure 3A). A total of 1000 purified KSL cells from WT or Cebpb−/− mice (CD45.2+) mixed with an equal number of competitor KSL cells from WT mice (CD45.1+) were transplanted into lethally irradiated CD45.1+CD45.2+ WT recipient mice. Four weeks after transplantation, chimerism of CD45.2+ test cells and the ratio of CD45.2+ test cells to CD45.1+ competitor cells among KSL cells were significantly lower in the recipients of Cebpb−/− cells (Figure 3B). This suggests that C/EBPβ is cell-intrinsically involved in the initial expansion of HSPCs after transplantation.

C/EBPβ is required for stress-induced proliferation of HSPCs. (A) Schematic illustration of competitive transplantation to assess the initial expansion of HSPCs. A total of 1000 purified KSL (c-kit+Sca-1+lineage−) cells from WT or Cebpb−/− mice (CD45.2+) and an equal number of WT KSL cells (CD45.1+), together with whole BM cells from CD45.1+/CD45.2+ WT mice, were transplanted into lethally irradiated WT recipients (CD45.1+/CD45.2+). (B) Representative flow cytometric analysis of KSL cells at 4 weeks after transplantation (i-ii). Frequency of test cells (CD45.2+) among KSL cells (iii) and the ratio of test cells (CD45.2+) to competitor cells (CD45.1+) among KSL cells (iv) are shown (n = 4 per group, representative of 3 independent experiments). (C) Cell-cycle statuses of WT and Cebpb−/− LT-HSCs (CD150+CD48− KSL cells) were analyzed at steady state and 36 hours after transplantation of 5 × 10⁶ BM cells into lethally irradiated WT recipients. (D) Representative cell-cycle statuses of LT-HSCs at steady state (i-ii) and 36 hours after BM transplantation (BMT) (iii-iv). (E) Percentages of LT-HSCs in each cell-cycle state at steady state (i) and 36 hours after BMT (ii) (n = 4 per genotype in 2 independent experiments). Data are presented as means ± SD. *P < .05; ***P < .001 (determined by the 2-tailed Student t test).
C/EBPβ is required for stress-induced proliferation of HSPCs. (A) Schematic illustration of competitive transplantation to assess the initial expansion of HSPCs. A total of 1000 purified KSL (c-kit+Sca-1+lineage−) cells from WT or Cebpb−/− mice (CD45.2+) and an equal number of WT KSL cells (CD45.1+), together with whole BM cells from CD45.1+/CD45.2+ WT mice, were transplanted into lethally irradiated WT recipients (CD45.1+/CD45.2+). (B) Representative flow cytometric analysis of KSL cells at 4 weeks after transplantation (i-ii). Frequency of test cells (CD45.2+) among KSL cells (iii) and the ratio of test cells (CD45.2+) to competitor cells (CD45.1+) among KSL cells (iv) are shown (n = 4 per group, representative of 3 independent experiments). (C) Cell-cycle statuses of WT and Cebpb−/− LT-HSCs (CD150+CD48− KSL cells) were analyzed at steady state and 36 hours after transplantation of 5 × 10⁶ BM cells into lethally irradiated WT recipients. (D) Representative cell-cycle statuses of LT-HSCs at steady state (i-ii) and 36 hours after BM transplantation (BMT) (iii-iv). (E) Percentages of LT-HSCs in each cell-cycle state at steady state (i) and 36 hours after BMT (ii) (n = 4 per genotype in 2 independent experiments). Data are presented as means ± SD. *P < .05; ***P < .001 (determined by the 2-tailed Student t test).
We next examined the involvement of C/EBPβ in cell-cycle regulation in HSPCs. At steady state, the cell-cycle status of LT-HSCs was identical in Cebpb−/− and WT mice (Figure 3C-E). Thirty-six hours after transplantation of BM cells from WT or Cebpb−/− mice (supplemental Figure 3), a significantly higher percentage of Cebpb−/− LT-HSCs remained in G0 phase. This suggests that C/EBPβ plays an important role in cell-cycle entry after transplantation.
C/EBPβ is required for the proliferation and differentiation of HSPCs at the early and late phases of regeneration under stress conditions, respectively
In parallel with the transplantation model described above, we analyzed the roles of C/EBPβ using a 5-FU treatment model. To exclude the cell-extrinsic contribution of C/EBPβ, we transplanted CD45.2+ BM cells from WT or Cebpb−/− mice into lethally irradiated CD45.1+ WT mice (Figure 4A). Twelve weeks later, >99% of BM cells in the recipients were replaced by CD45.2+ donor cells, and the cell-cycle statuses and abundances of LT-HSCs, KSL cells, and KL cells did not significantly differ between the recipients of WT and Cebpb−/− cells (Figure 4B-C, day 0). These BM-replaced mice were treated once with 5-FU (supplemental Figure 4).
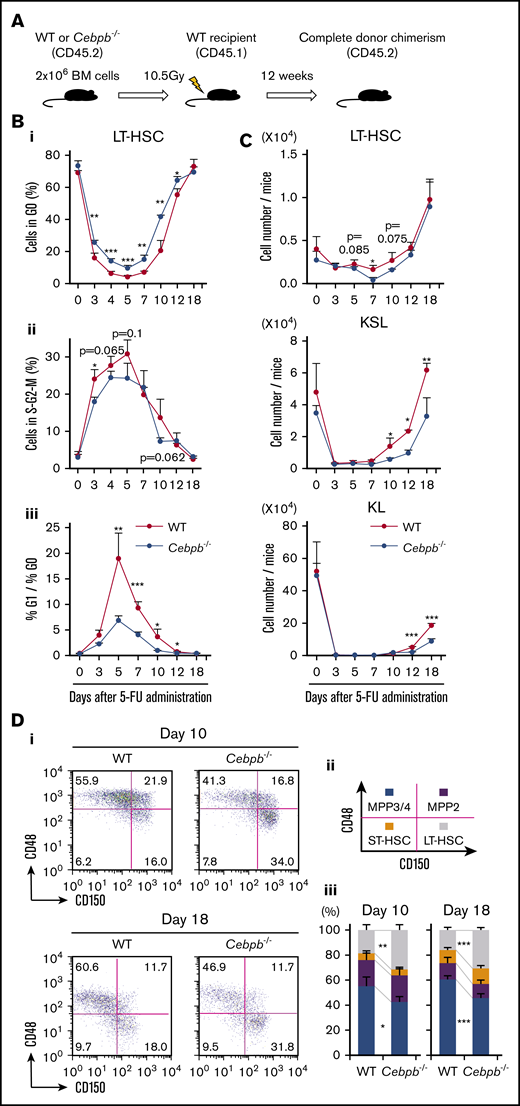
C/EBPβ is required for proliferation and differentiation of HSPCs at early and late phases of regeneration under stress conditions, respectively. (A) Experimental design for the BM replacement model, aimed at excluding nonhematopoietic differences between WT and Cebpb−/− mice. Lethally irradiated WT mice (CD45.1+) were reconstituted with BM cells from WT or Cebpb−/− mice (CD45.2+). After 12 weeks, the reconstituted animals were used in further experiments. (B) Cell-cycle analysis of LT-HSCs (CD150+CD48− KSL cells) from WT- and Cebpb−/−-reconstituted mice before and after 5-FU treatment. The frequency of cells in G0 phase (i), the frequency of cells in S-G2-M phase (ii), and the G1 phase/G0 phase ratio (iii) are shown (n = 4–5 per group and per time point in 2 independent experiments). (C) Numbers of LT-HSCs (CD150+CD48− KSL cells), KSL (c-kit+Sca-1+ lineage-) cells, and KL (c-kit+Sca-1−lineage−) cells per mouse at multiple time points after 5-FU administration (n = 4–5 per group and per time point in 2 independent experiments). (D) Representative flow cytometric patterns of subpopulations of KSL cells from WT- or Cebpb−/−-reconstituted mice at days 10 and 18 after 5-FU administration. (i-iii) The frequencies of the indicated subpopulations are plotted (n = 5 per group and per time point in 2 independent experiments). Data are presented as means ± SD. *P < .05; **P < .01; and ***P < .001 (determined by the 2-tailed Student t test).
C/EBPβ is required for proliferation and differentiation of HSPCs at early and late phases of regeneration under stress conditions, respectively. (A) Experimental design for the BM replacement model, aimed at excluding nonhematopoietic differences between WT and Cebpb−/− mice. Lethally irradiated WT mice (CD45.1+) were reconstituted with BM cells from WT or Cebpb−/− mice (CD45.2+). After 12 weeks, the reconstituted animals were used in further experiments. (B) Cell-cycle analysis of LT-HSCs (CD150+CD48− KSL cells) from WT- and Cebpb−/−-reconstituted mice before and after 5-FU treatment. The frequency of cells in G0 phase (i), the frequency of cells in S-G2-M phase (ii), and the G1 phase/G0 phase ratio (iii) are shown (n = 4–5 per group and per time point in 2 independent experiments). (C) Numbers of LT-HSCs (CD150+CD48− KSL cells), KSL (c-kit+Sca-1+ lineage-) cells, and KL (c-kit+Sca-1−lineage−) cells per mouse at multiple time points after 5-FU administration (n = 4–5 per group and per time point in 2 independent experiments). (D) Representative flow cytometric patterns of subpopulations of KSL cells from WT- or Cebpb−/−-reconstituted mice at days 10 and 18 after 5-FU administration. (i-iii) The frequencies of the indicated subpopulations are plotted (n = 5 per group and per time point in 2 independent experiments). Data are presented as means ± SD. *P < .05; **P < .01; and ***P < .001 (determined by the 2-tailed Student t test).
We first evaluated the impact of C/EBPβ on the cell-cycle status of LT-HSCs (Figure 4B). After 5-FU treatment, WT LT-HSCs immediately entered the cell cycle, as revealed by a decrease in the proportion of cells in G0 phase and an increase in the proportion of cells in S/G2M phase. The ratio of cells in G1 phase to cells in G0 phase, indicating entry of dormant cells into the cell cycle, also increased and peaked at day 5. All of these parameters of cell-cycle entry were significantly attenuated in recipients of Cebpb−/− cells. Consistent with this, short-term BrdU incorporation assays revealed that significantly fewer Cebpb−/− HSPCs were cycling 6 days after 5-FU administration, whereas no difference was detected between Cebpb−/− and WT HSPCs at steady state (supplemental Figure 5A). Collectively, these data suggest that C/EBPβ helps to accelerate cell-cycle entry of LT-HSCs during the early phase of regeneration.
Next, we assessed the numbers of LT-HSCs, KSL cells, and KL cells (Figure 4C). After the nadir induced by 5-FU, recovery of LT-HSCs was followed by recovery of KSL and KL cells. In recipients of Cebpb−/− cells, the recovery of KSL and KL cells, but not the recovery of LT-HSCs, was more delayed than in recipients of WT cells, indicating an impairment in the differentiation of Cebpb−/− LT-HSCs into KSL or KL cells during regeneration. Accordingly, LT-HSCs were more enriched in Cebpb−/− BM-reconstituted mice than in WT BM-reconstituted mice on days 10 and 18 after 5-FU treatment (Figure 4D). In addition, there were significantly fewer CD11b+ myeloid cells in the BM of Cebpb−/−-reconstituted mice on day 18 (supplemental Figure 5B). These results suggest that C/EBPβ promotes differentiation of LT-HSCs into myeloid lineages at a later phase of regeneration.
Translation of C/EBPβ isoforms in HSCs is altered under stress conditions
After identifying the phase-specific roles of C/EBPβ in the regulation of HSPCs under stress conditions, we sought to determine the distinct functions of 3 isoforms of C/EBPβ. To monitor expression of these isoforms in small numbers of HSPCs, we developed an intracellular double-staining method for flow cytometric analysis. An antibody against the C terminus of C/EBPβ recognized all 3 isoforms, whereas an antibody against the N terminus only recognized LAP* and LAP (Figure 5A-B). Thus, simultaneous staining with both antibodies allowed us to distinguish cells that predominantly expressed LIP (C-term+N-term−) from those that expressed all 3 isoforms (C-term+N-term+).
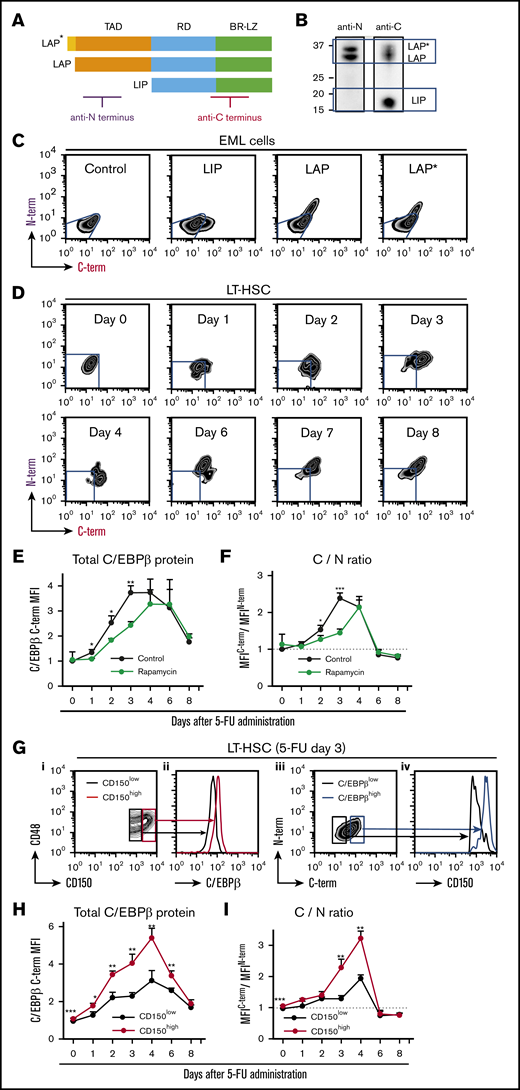
Translation of C/EBPβ isoforms is altered under stress conditions. (A) Structures of the 3 C/EBPβ isoforms. The regions recognized by the 2 antibodies are indicated. (B) Immunoblot analysis of NIH3T3 cell extracts with the anti-N terminus (anti-N) and anti-C terminus (anti-C) antibodies. The anti-N antibody recognized only LAP* and LAP, whereas the anti-C antibody detected all 3 isoforms. (C) Flow cytometric analysis of EML cells transduced with control, LIP, LAP, or LAP* expression vector. Cells were not selected after transduction, so the results reflect a mixture of transduced and nontransduced cells. Blue lines indicate the expression level in cells transduced with control vector. (D) Intracellular double staining of LT-HSCs (CD150+CD48− KSL cells) obtained from 5-FU–treated WT mice with the 2 anti-C/EBPβ antibodies. Representative flow cytometric patterns at multiple time points after 5-FU administration are shown. Blue lines indicate the expression level in LT-HSCs at steady state stained under the same conditions. (E) Changes in total C/EBPβ protein (MFIC/EBPβ C-term) and (F) C/N ratio (ratio of MFIC/EBPβ C-term/MFIC/EBPβN-term) in LT-HSCs at multiple time points after 5-FU administration. The C/N ratio at steady state was set to 1 (dashed line). The effect of rapamycin administration (from day −7) was also compared (green line) with that of vehicle administration (black line) (n = 4–6 per group and per time point in 2 independent experiments). (G) LIP is specifically upregulated in CD150high myeloid-biased LT-HSCs (CD150+CD48− KSL cells) after 5-FU treatment. Total C/EBPβ protein level in CD150high and CD150low LT-HSCs 3 days after 5-FU administration. (i-ii) Representative histograms of fluorescence corresponding to anti-C antibody staining in CD150high and CD150low LT-HSCs (red and black lines, respectively) are shown. (iii-iv) Surface CD150 expression was assessed separately in C/EBPβ(C-term)high and C/EBPβ(C-term)low LT-HSCs (blue and black lines, respectively) 3 days after 5-FU administration. (H-I) Total C/EBPβ protein level (MFIC/EBPβ C-term) and the C/N ratio (ratio of MFIC/EBPβ C-term/MFIC/EBPβN-term) in CD150high (red line) and CD150low (black line) LT-HSCs (CD150+CD48− KSL cells) at multiple time points after 5-FU administration (n = 4-6 per group and per time point in 2 independent experiments). The C/N ratio at steady state was set to 1 (dotted line). Data are presented as means ± SD. *P < .05; **P < .01; and ***P < .001 (determined by the 2-tailed Student t test). BR-LZ, basic region-leucine zipper domain; RD, regulatory domain; TAD, transactivation domain.
Translation of C/EBPβ isoforms is altered under stress conditions. (A) Structures of the 3 C/EBPβ isoforms. The regions recognized by the 2 antibodies are indicated. (B) Immunoblot analysis of NIH3T3 cell extracts with the anti-N terminus (anti-N) and anti-C terminus (anti-C) antibodies. The anti-N antibody recognized only LAP* and LAP, whereas the anti-C antibody detected all 3 isoforms. (C) Flow cytometric analysis of EML cells transduced with control, LIP, LAP, or LAP* expression vector. Cells were not selected after transduction, so the results reflect a mixture of transduced and nontransduced cells. Blue lines indicate the expression level in cells transduced with control vector. (D) Intracellular double staining of LT-HSCs (CD150+CD48− KSL cells) obtained from 5-FU–treated WT mice with the 2 anti-C/EBPβ antibodies. Representative flow cytometric patterns at multiple time points after 5-FU administration are shown. Blue lines indicate the expression level in LT-HSCs at steady state stained under the same conditions. (E) Changes in total C/EBPβ protein (MFIC/EBPβ C-term) and (F) C/N ratio (ratio of MFIC/EBPβ C-term/MFIC/EBPβN-term) in LT-HSCs at multiple time points after 5-FU administration. The C/N ratio at steady state was set to 1 (dashed line). The effect of rapamycin administration (from day −7) was also compared (green line) with that of vehicle administration (black line) (n = 4–6 per group and per time point in 2 independent experiments). (G) LIP is specifically upregulated in CD150high myeloid-biased LT-HSCs (CD150+CD48− KSL cells) after 5-FU treatment. Total C/EBPβ protein level in CD150high and CD150low LT-HSCs 3 days after 5-FU administration. (i-ii) Representative histograms of fluorescence corresponding to anti-C antibody staining in CD150high and CD150low LT-HSCs (red and black lines, respectively) are shown. (iii-iv) Surface CD150 expression was assessed separately in C/EBPβ(C-term)high and C/EBPβ(C-term)low LT-HSCs (blue and black lines, respectively) 3 days after 5-FU administration. (H-I) Total C/EBPβ protein level (MFIC/EBPβ C-term) and the C/N ratio (ratio of MFIC/EBPβ C-term/MFIC/EBPβN-term) in CD150high (red line) and CD150low (black line) LT-HSCs (CD150+CD48− KSL cells) at multiple time points after 5-FU administration (n = 4-6 per group and per time point in 2 independent experiments). The C/N ratio at steady state was set to 1 (dotted line). Data are presented as means ± SD. *P < .05; **P < .01; and ***P < .001 (determined by the 2-tailed Student t test). BR-LZ, basic region-leucine zipper domain; RD, regulatory domain; TAD, transactivation domain.
To test this strategy, we first applied it to the mouse HSPC line EML cells transduced with one of the C/EBPβ isoforms (Figure 5C). As expected, LIP-transduced cells were identified as N-term−C-term+ cells and could be clearly distinguished from LAP*- and LAP-transduced cells, which were C-term+N-term+ (Figure 5C). In quantitative terms, the mean fluorescence intensities (MFIs) of staining with the anti-C–terminus and anti-N–terminus antibodies reflected the amounts of total C/EBPβ protein (LIP, LAP, and LAP*) and the long isoforms (LAP* and LAP), respectively. Hence, the ratio of the MFIC-terminus to the MFIN-terminus, termed the C/N ratio, is a surrogate for the LIP/LAP ratio.
Using this method, we monitored the expression patterns of these isoforms in LT-HSCs treated with 5-FU. BM cells obtained from mice at steady state were stained in parallel and used as controls (supplemental Figure 6). As shown in Figure 5D, LT-HSCs first became C-terminus single-positive (days 1-4), and subsequently changed to C-term+N-term+ (after day 6). During the interval when total C/EBPβ protein was upregulated (days 1-8; Figure 5E), the C/N ratio increased during the early phase (days 1-4; Figure 5F), peaked at day 3, and decreased to steady-state level during the later phase (days 6-8). Similarly, after transplantation, LIP was upregulated prior to LAP*/LAP in LT-HSCs (supplemental Figure 7A-C). These data suggest that LIP is upregulated prior to LAP*/LAP during regeneration.
Mammalian/mechanistic target of rapamycin (mTOR) signaling is involved in the translation of C/EBPβ.33 We confirmed that the mTOR pathway was activated in LT-HSC after 5-FU treatment (supplemental Figure 8). To explore the role of mTOR, we treated mice with rapamycin, an allosteric mTOR inhibitor, prior to 5-FU treatment. Rapamycin significantly delayed and attenuated the upregulation and alteration of C/EBPβ isoforms (green lines in Figure 5E-F), and the hematopoietic recovery was significantly delayed (supplemental Figure 9A-B). This finding suggests that mTOR is involved in the translational regulation of C/EBPβ in HSPCs during regeneration.
C/EBPβ is specifically upregulated in HSCs with high CD150 expression under stress conditions
LT-HSCs with high CD150 expression (CD150high LT-HSCs) exhibit higher self-renewal activity and more robust myeloid-biased reconstitution at steady state.34,35 Given that C/EBPβ plays an important role in emergency granulopoiesis, we hypothesized that C/EBPβ is closely associated with CD150high LT-HSCs. Indeed, at day 3 after 5-FU administration, when the upregulation of LIP peaked (Figure 5E-F), C/EBPβ expression in LT-HSCs correlated well with surface expression of CD150 (Figure 5G). Furthermore, expression levels of C/EBPβ and LIP were higher in CD150high LT-HSCs than in CD150low LT-HSCs at the early phase of regeneration (Figure 5H-I). These findings were reproduced in the BM transplantation model (supplemental Figure 10), suggesting that stress-induced LIP-dominant upregulation is specific to CD150high LT-HSCs during regeneration.
C/EBPβ isoforms play distinct roles in the regulation of HSPCs
We next assessed the function of each C/EBPβ isoform. For in vitro evaluation, we retrovirally transduced EML cells36 with one of the C/EBPβ isoforms. LIP-transduced EML cells were slightly, but significantly, more proliferative and actively cycling than those transduced with the control vector, whereas proliferation and cell cycling were markedly suppressed in LAP*- and LAP-expressing EML cells (Figure 6A-B). LIP-expressing cells remained undifferentiated (c-kithighCD11b−) for more than 2 weeks, whereas LAP*- and LAP-expressing cells rapidly differentiated into c-kitlowCD11b+ myeloid cells and eventually stopped proliferating within 2 weeks (Figure 6C; supplemental Figure 11; data not shown).
![C/EBPβ isoforms play different roles in the regulation of HSPCs. (A) EML cells were transduced with control (pGCDNsam-IRES-Kusabira-Orange [KuO]) or LIP, LAP, or LAP* expression vectors (pGCDNsam-LIP-KuO, pGCDNsam-LAP-KuO, or pGCDNsam-LAP*-KuO), and KuO+ cells were subjected to analysis. Cell numbers are expressed as fold change relative to the number on day 3 (n = 4 per group and per time point, representative of 2 independent experiments). (B) BrdU incorporation by EML cells 3 days after transduction of control, LIP, LAP, or LAP* expression vector (n = 5 per group). In each experiment, the frequency of BrdU+ cells in the control vector-transduced cells was set to 1, and the values from 5 independent experiments were statistically analyzed using the 2-tailed paired Student t test. (C) Representative flow cytometric analysis of EML cells 5 days after transduction of the control, LIP, LAP, or LAP* expression vector. (D) Schematic illustration of the BM transplantation experiments in combination with retroviral transduction. (E) Frequencies of BM c-kit+Sca-1+lineage− cells (KSLs) among control vector- and LIP-transduced WT BM cells 3 weeks (i) or 16 weeks (ii) after transplantation (n = 5 per group, representative of 2 independent experiments). LT-HSCs were defined as CD135−CD150+CD48− KSL cells. (F) Cell-cycle statuses of control vector- and LIP-transduced WT LT-HSCs (CD150+CD48− KSL cells) at 3 or 16 weeks after transplantation. Frequencies of cells in G0 phase are shown (n = 4 per group, representative of 2 independent experiments). (G) Frequencies of indicated HSPCs subsets among control vector- and LIP-transduced WT BM cells 3 weeks (i) or 16 weeks (ii) post-transplantation (n = 5 per group, representative of 2 independent experiments). LT-HSCs were defined as CD135−CD150+CD48− KSL cells. (H) PB CD11b+ cells subsets among control vector- and LIP-transduced WT BM cells 3 weeks (i) or 16 weeks (ii) after transplantation or 2 weeks after 5-FU treatment at 16 weeks after transplantation (iii) (n = 6-10 per group, representative of 2 independent experiments). Data are presented as means ± SD. *P < .05; **P < .01; and ***P < .001 (determined by the 2-tailed Student t test).](https://ash.silverchair-cdn.com/ash/content_public/journal/bloodadvances/4/14/10.1182_bloodadvances.2018022913/1/m_advances022913f6.png?Expires=1764974834&Signature=bzcwaPxo~HnvNv-3E3JhNiSwKfRdHbIDFEYz7Dr2tCwBzRCY-OBy~DqI4Ko9QshpsdQndMAnctKoWj3Mkm4zFEowWw6whNAkcQeRDXUC1zn-6AEDzFoqYYMqDhxuTofx3FzBpw8HGoYH5bJ5jQ4rhjR3oMNnKpRBGVDZFeJTbABclVHSXX6-j65dMhIH48nfTJSME2Pth2GJy2Y9AGjFdsw2SACCVNTMdkeGMYFujGCh3OLSkTooL2r717h7QS202Cecl4jsvrdH8HVWUb4JuBbc1GNCpHtSUjJA~ryqbEdhYa9u0S~Z5h6WkwzjG4f-pa~MOXnpMhmmQKosLw~XkQ__&Key-Pair-Id=APKAIE5G5CRDK6RD3PGA)
C/EBPβ isoforms play different roles in the regulation of HSPCs. (A) EML cells were transduced with control (pGCDNsam-IRES-Kusabira-Orange [KuO]) or LIP, LAP, or LAP* expression vectors (pGCDNsam-LIP-KuO, pGCDNsam-LAP-KuO, or pGCDNsam-LAP*-KuO), and KuO+ cells were subjected to analysis. Cell numbers are expressed as fold change relative to the number on day 3 (n = 4 per group and per time point, representative of 2 independent experiments). (B) BrdU incorporation by EML cells 3 days after transduction of control, LIP, LAP, or LAP* expression vector (n = 5 per group). In each experiment, the frequency of BrdU+ cells in the control vector-transduced cells was set to 1, and the values from 5 independent experiments were statistically analyzed using the 2-tailed paired Student t test. (C) Representative flow cytometric analysis of EML cells 5 days after transduction of the control, LIP, LAP, or LAP* expression vector. (D) Schematic illustration of the BM transplantation experiments in combination with retroviral transduction. (E) Frequencies of BM c-kit+Sca-1+lineage− cells (KSLs) among control vector- and LIP-transduced WT BM cells 3 weeks (i) or 16 weeks (ii) after transplantation (n = 5 per group, representative of 2 independent experiments). LT-HSCs were defined as CD135−CD150+CD48− KSL cells. (F) Cell-cycle statuses of control vector- and LIP-transduced WT LT-HSCs (CD150+CD48− KSL cells) at 3 or 16 weeks after transplantation. Frequencies of cells in G0 phase are shown (n = 4 per group, representative of 2 independent experiments). (G) Frequencies of indicated HSPCs subsets among control vector- and LIP-transduced WT BM cells 3 weeks (i) or 16 weeks (ii) post-transplantation (n = 5 per group, representative of 2 independent experiments). LT-HSCs were defined as CD135−CD150+CD48− KSL cells. (H) PB CD11b+ cells subsets among control vector- and LIP-transduced WT BM cells 3 weeks (i) or 16 weeks (ii) after transplantation or 2 weeks after 5-FU treatment at 16 weeks after transplantation (iii) (n = 6-10 per group, representative of 2 independent experiments). Data are presented as means ± SD. *P < .05; **P < .01; and ***P < .001 (determined by the 2-tailed Student t test).
C/EBPβ isoforms play different roles in the regulation of HSPCs. (A) EML cells were transduced with control (pGCDNsam-IRES-Kusabira-Orange [KuO]) or LIP, LAP, or LAP* expression vectors (pGCDNsam-LIP-KuO, pGCDNsam-LAP-KuO, or pGCDNsam-LAP*-KuO), and KuO+ cells were subjected to analysis. Cell numbers are expressed as fold change relative to the number on day 3 (n = 4 per group and per time point, representative of 2 independent experiments). (B) BrdU incorporation by EML cells 3 days after transduction of control, LIP, LAP, or LAP* expression vector (n = 5 per group). In each experiment, the frequency of BrdU+ cells in the control vector-transduced cells was set to 1, and the values from 5 independent experiments were statistically analyzed using the 2-tailed paired Student t test. (C) Representative flow cytometric analysis of EML cells 5 days after transduction of the control, LIP, LAP, or LAP* expression vector. (D) Schematic illustration of the BM transplantation experiments in combination with retroviral transduction. (E) Frequencies of BM c-kit+Sca-1+lineage− cells (KSLs) among control vector- and LIP-transduced WT BM cells 3 weeks (i) or 16 weeks (ii) after transplantation (n = 5 per group, representative of 2 independent experiments). LT-HSCs were defined as CD135−CD150+CD48− KSL cells. (F) Cell-cycle statuses of control vector- and LIP-transduced WT LT-HSCs (CD150+CD48− KSL cells) at 3 or 16 weeks after transplantation. Frequencies of cells in G0 phase are shown (n = 4 per group, representative of 2 independent experiments). (G) Frequencies of indicated HSPCs subsets among control vector- and LIP-transduced WT BM cells 3 weeks (i) or 16 weeks (ii) post-transplantation (n = 5 per group, representative of 2 independent experiments). LT-HSCs were defined as CD135−CD150+CD48− KSL cells. (H) PB CD11b+ cells subsets among control vector- and LIP-transduced WT BM cells 3 weeks (i) or 16 weeks (ii) after transplantation or 2 weeks after 5-FU treatment at 16 weeks after transplantation (iii) (n = 6-10 per group, representative of 2 independent experiments). Data are presented as means ± SD. *P < .05; **P < .01; and ***P < .001 (determined by the 2-tailed Student t test).
For in vivo examination, primary BM cells from WT or Cebpb−/− mice were retrovirally transduced with one of the C/EBPβ isoforms or the control vector, and then transplanted into irradiated WT mice (Figure 6D). After 2 (PB) or 3 (BM) weeks, LAP*- and LAP-expressing cells disappeared from the recipients (supplemental Figure 12A-B; data not shown), indicating that they underwent rapid differentiation and exhaustion. In contrast, LIP-transduced cells stably engrafted for 12 weeks after transplantation and gave rise to significantly more KSL cells at 3 and 16 weeks after transplantation than cells transduced with the control vector (Figure 6E; supplemental Figures 12C and 13A). These time points represented stress condition and steady state, respectively. In addition, cell-cycle analyses revealed that LT-HSCs expressing LIP were less quiescent than those transduced with the control vector (Figure 6F; supplemental Figure 12C). These data were consistent with those obtained in vitro. However, further subdivision of KSL cells revealed that LIP-transduced WT cells gave rise to significantly fewer LT-HSCs and ST-HSCs and significantly more lymphoid-primed MPP4s at both 3 and 16 weeks (Figure 6G; supplemental Figure 13A). Interestingly, transplantation of LIP-transduced cells resulted in myeloid-biased output at 3 weeks, but lymphoid-biased output at 16 weeks after transplantation (Figure 6H). When the recipient mice were treated with 5-FU at 16 weeks after transplantation to induce stress condition again, LIP-transduced cells gave rise to more myeloid cells than control vector-transduced cells. Consistently, transfer of LIP-transduced MPP4s gave rise to more myeloid cells under a stress condition induced by irradiation, but less myeloid cells at steady state (supplemental Figure 13B-C). Taken together, these results suggest that LIP negatively regulates quiescence of LT-HSCs and triggers differentiation to MPP4 and that LIP modulates further differentiation in a condition-dependent manner. In contrast, LAP*/LAP induces rapid myeloid differentiation and exhaustion of HSPCs.
LIP positively regulates Myc transcription in HSPCs
To explore the machinery downstream of C/EBPβ, especially the factors acting downstream of the initial elevation of LIP in HSPCs during regeneration, we focused on c-Myc, which is encoded by Myc. c-Myc promotes exit of quiescent HSCs from the niche and their differentiation into progenitors.37 Therefore, we hypothesized that LIP regulates regenerating HSCs by upregulating c-Myc.
To test this idea, we first assessed the effect of LIP overexpression. Retroviral transduction of LIP increased Myc expression by 1.5-fold and twofold in EML cells and LT-HSCs, respectively (Figure 7A-B). When the recipients of WT or Cebpb−/− BM cells were analyzed at 36 hours after transplantation, the time point at which LIP was predominantly expressed, Myc expression was significantly higher in WT than Cebpb−/− LT-HSCs (Figure 7C). After 5-FU treatment, Myc expression was twofold higher in WT than Cebpb−/− LT-HSCs only on day 3, when LIP was predominantly expressed. These results suggest that LIP positively regulates Myc expression in HSCs under stress condition in vivo. (Figure 7D). Changes in Myc expression in LT-HSCs induced by LIP or Cebpb-deficiency were accompanied with changes in expression of putative Myc target genes (supplemental Figure 14A-B, respectively). These results suggest that LIP positively regulates Myc expression in HSCs under stress condition.

LIP positively regulates Myc transcription in HSPCs. (A) Expression of Myc, which encodes c-Myc, in EML cells retrovirally transduced with control or LIP expression vector (n = 5 per group). In each experiment, the Myc level in the control vector-transduced cells was set to 1, and the values from 5 independent experiments were statistically analyzed using the 2-tailed paired Student t test. (B) Myc expression in control vector- and LIP-transduced LT-HSCs (CD150+CD48− KSL cells) obtained from recipients 3 weeks after transplantation (n = 3, technical replicates, representative of 2 independent experiments). mRNA levels were normalized against that of Gapdh. (C) Myc expression in WT and Cebpb−/− LT-HSCs (CD150+CD48− KSL cells) 36 hours after transplantation. mRNA levels were normalized against that of Gapdh (n = 4 biological replicates of 500-1000 pooled cells per group in 2 independent experiments). (D) Relative Myc expression in LT-HSCs obtained from WT- or Cebpb−/−-reconstituted mice at steady state (day 0) and after 5-FU administration (days 3 and 8) (n = 4 biological replicates of 500-1000 pooled cells per group in 2 independent experiments for days 3 and 8; n = 3 for day 0). (E) ChIP-qPCR analysis using EML cells engineered to express C/EBPβ-estrogen receptor fusion. Data show enrichment of C/EBPβ at the E3 enhancer region of Myc at each time point after treatment with 4′-hydroxytamoxifen. (F) ChIP-qPCR analysis using NIH3T3 cells transduced with control vector or expression vector for LIP, LAP, or LAP* fused to the FLAG tag. FLAG-tagged C/EBPβ isoforms were enriched at the E3 enhancer region of Myc. (G) EML cells were retrovirally transduced with control, LIP, LAP, or LAP* vector, and the transduced cells were purified and subjected to qualitative RT-PCR 48 hours after transduction. Data are presented as means ± SD (n = 3). *P < .05; **P < .01 (determined by the 2-tailed Student t test).
LIP positively regulates Myc transcription in HSPCs. (A) Expression of Myc, which encodes c-Myc, in EML cells retrovirally transduced with control or LIP expression vector (n = 5 per group). In each experiment, the Myc level in the control vector-transduced cells was set to 1, and the values from 5 independent experiments were statistically analyzed using the 2-tailed paired Student t test. (B) Myc expression in control vector- and LIP-transduced LT-HSCs (CD150+CD48− KSL cells) obtained from recipients 3 weeks after transplantation (n = 3, technical replicates, representative of 2 independent experiments). mRNA levels were normalized against that of Gapdh. (C) Myc expression in WT and Cebpb−/− LT-HSCs (CD150+CD48− KSL cells) 36 hours after transplantation. mRNA levels were normalized against that of Gapdh (n = 4 biological replicates of 500-1000 pooled cells per group in 2 independent experiments). (D) Relative Myc expression in LT-HSCs obtained from WT- or Cebpb−/−-reconstituted mice at steady state (day 0) and after 5-FU administration (days 3 and 8) (n = 4 biological replicates of 500-1000 pooled cells per group in 2 independent experiments for days 3 and 8; n = 3 for day 0). (E) ChIP-qPCR analysis using EML cells engineered to express C/EBPβ-estrogen receptor fusion. Data show enrichment of C/EBPβ at the E3 enhancer region of Myc at each time point after treatment with 4′-hydroxytamoxifen. (F) ChIP-qPCR analysis using NIH3T3 cells transduced with control vector or expression vector for LIP, LAP, or LAP* fused to the FLAG tag. FLAG-tagged C/EBPβ isoforms were enriched at the E3 enhancer region of Myc. (G) EML cells were retrovirally transduced with control, LIP, LAP, or LAP* vector, and the transduced cells were purified and subjected to qualitative RT-PCR 48 hours after transduction. Data are presented as means ± SD (n = 3). *P < .05; **P < .01 (determined by the 2-tailed Student t test).
A recent study demonstrated that C/EBPβ binds to distal enhancers of the Myc gene.38 To confirm this in the context of HSPCs, we performed ChIP-qPCR analysis of EML cells transduced with C/EBPβ fused to the estrogen receptor. At 24 and 72 hours after nuclear translocation of C/EBPβ, C/EBPβ was remarkably enriched at the E3 enhancer of the Myc gene (Figure 7E). To identify the isoforms bound to the enhancer, we retrovirally transduced NIH3T3 cells with vectors expressing one of the isoforms, and then subjected the cells to ChIP-qPCR. The data clearly showed that all isoforms were bound to the enhancer (Figure 7F). In functional terms, LAP or LAP* overexpression significantly downregulated Myc in EML cells, whereas overexpression of LIP upregulated Myc (Figure 7A,G). Collectively, these findings suggest that upregulation of LIP in HSPCs positively regulates Myc transcription, possibly by antagonistically inhibiting LAP/LAP*-mediated downregulation at the Myc enhancer.
Discussion
C/EBPα and C/EBPβ are involved in the regulation of steady state and emergency granulopoiesis, respectively. C/EBPα restricts the proliferation of HSCs during steady state.10,11 In contrast, as revealed by this study, sequentially upregulated C/EBPβ isoforms regulate the proliferation and differentiation of regenerating HSCs.
Using an intracellular flow cytometric technique that we developed, we showed that LIP was upregulated before the longer isoforms, LAP and LAP*, in LT-HSCs after 5-FU treatment. Cell-cycle entry in Cebpb−/− LT-HSCs was impaired at an early phase, exactly when LIP was predominantly expressed. In contrast, differentiation toward the myeloid lineage in the recipients of Cebpb−/− cells was delayed during the period when the long isoforms were upregulated. These results suggest that phase-specific upregulation of LIP and LAP/LAP* is strongly associated with phase-specific functions of C/EBPβ in cell-cycle activation and differentiation, respectively.
Our in vitro experiments using EML cells clearly showed that LIP accelerated cell growth and entry into the cell cycle, whereas LAP and LAP* inhibited cell proliferation. Indeed, transduction of LIP decreased the number of quiescent LT-HSCs in vivo. In mechanistic terms, LIP transduction upregulated Myc in LT-HSCs. In addition, expression of Myc was significantly lower in Cebpb−/− LT-HSCs only when LIP was predominantly upregulated. These results, together with the ChIP-qPCR results demonstrating that all isoforms of C/EBPβ directly bound to an enhancer of Myc, suggest that LIP accelerates the cell-cycle entry under stress conditions by positively regulating Myc.
Our experiments using EML cells revealed that LIP has little myeloid differentiation-inducing ability when compared with LAP and LAP*. In contrast, in vivo transplantation of LIP-transduced BM cells or LIP-transduced MPP4s resulted in myeloid-biased output under stress conditions, but more lymphoid-biased output at steady state. We hypothesize that LIP may indirectly induce the differentiation of LT-HSCs into MPP4s by inhibiting their interaction with the niche through positively regulating Myc,37 irrespective of the situation. Under stress condition, LIP may collaborate other myeloid-inducing machineries activated by cell-extrinsic factors. At steady state, LIP may inhibit further myeloid differentiation by antagonizing LAP and LAP* or other C/EBP family members in a dominant-negative manner. Because overexpression of C/EBPβ isoforms affected the behavior of Cebpb−/− LT-HSCs readily at steady state, the detailed mechanisms involved in the endogenous C/EBPβ-mediated lineage determination under stress condition should be addressed using isoform-specific knockout mice in the future.
By subdividing regenerating LT-HSCs on the basis of their surface expression of CD150, we found that stress-induced upregulation of C/EBPβ was remarkably specific to the CD150high subset, which represents myeloid-biased HSCs at steady state.34,35 Furthermore, a detailed review of our cell-cycle analyses revealed that C/EBPβ specifically activated the cell cycle in CD150high LT-HSCs under stress conditions (data not shown). In addition, close observation of mice that underwent competitive transplantation followed by repetitive 5-FU treatment (Figure 2E) revealed that Cebpb−/− cells outcompeted WT cells more effectively in myeloid lineages than in lymphocytes, indicating that C/EBPβ acts specifically in myeloid-biased HSCs, and induces their differentiation and exhaustion. These findings add to recently accumulated knowledge about the specific regulation of myeloid-biased HSCs in under stress conditions.
Our data indicate that C/EBPβ expression is regulated post-transcriptionally in HSPCs during stress. Such mechanisms enable rapid adjustment to meet an increased protein demand and are consequently of great significance when the cell is subjected to stress.39 Furthermore, we found that upregulation and alteration of the translation of C/EBPβ isoforms in LT-HSCs in vivo were dependent on mTOR. mTOR preferentially upregulates LIP by accelerating the initial translation of the upstream open reading frame located between start codons for LAP/LAP* and LIP, as well as translation reinitiation from the downstream LIP-AUG codon.33 Given that mTOR is activated in response to a variety of stress cues, this alteration in the translation of C/EBPβ isoforms may represent a general mechanism that regulates the behavior of HSCs under various kinds of stress.40,41 In contrast, we and others have shown that interferons and BCR-ABL can upregulate Cebpb mRNA expression in HSCs in vivo.18-20 The type, duration, or strength of the upstream signals may determine whether upregulation occurs at the transcriptional or post-transcriptional level. This issue should be investigated in future studies.
Taken together, our results indicate that stress-induced upregulation of C/EBPβ is critical to allow regenerating HSPCs to meet increasing myeloid demand. Upregulation of LIP in the early phase of regeneration likely amplifies the reservoir of HSPCs by facilitating the proliferation of LT-HSCs and their differentiation into MPPs, whereas LAP*/LAP induce subsequent myeloid differentiation at a later phase of regeneration. These findings provide insight into the pathophysiology of infection, inflammation, and regenerating hematopoiesis in response to myeloablative chemotherapies or HSC transplantation, which increase hematopoietic demand.
Send data sharing requests via e-mail to the corresponding author, Hideyo Hirai (hhirai@kuhp.kyoto-u.ac.jp or hirai@toyaku.ac.jp).
Acknowledgments
The authors thank Toshio Kitamura (University of Tokyo) for providing Plat-E cells and Schickwann Tsai (University of Utah) for providing EML cells. The authors also thank Shigekazu Nagata (Osaka University) for providing CD45.1 mice. The authors gratefully acknowledge Naoko Watanabe-Okochi and Mineo Kurokawa (University of Tokyo) for kindly providing the pGCDNsam-IRES-Kusabira-Orange (KuO), pGCDNsam-LIP-KuO, pGCDNsam-LAP-KuO, and pGCDNsam-LAP*-KuO vectors. The authors are also grateful to Yoko Nakagawa and Yoshiko Manabe for their excellent technical assistance.
This work was partly supported by KAKENHI Grants-in-Aid for Scientific Research from the Japan Society for the Promotion of Science (25461415 and 18K08354 [H.H.], 25430149 [A.Y.], and 25112706 and 16K07171 [T.M.]); the Extramural Collaborative Research Grant from the Cancer Research Institute, Kanazawa University (H.H.); the Highway Program for Realization of Regenerative Medicine (JP17bm0504008) (H.H.); the Acceleration of Transformative Research for Medical Innovation from the Japan Agency for Medical Research and Development (H.H.); a grant from the Kyoto University Research Development Program “Ishizue” (H.H.); and a grant from the Kyoto University Foundation.
Authorship
Contribution: A.S., N.K., and A.Y. designed and performed experiments, analyzed data, and wrote the manuscript; Y.H. performed experiments, analyzed data, and wrote the manuscript; A.T. performed the experiments and analyzed data; Y.M. performed experiments; T.M. supervised the project; and H.H. conceived, designed, and performed experiments; analyzed data; and wrote the manuscript.
Conflict-of-interest disclosure: H.H. received research funding from Kyowa Kirin, Bristol-Myers K.K., CSL Behring, Mitsubishi Tanabe Pharma, Sumitomo Dainippon Pharma, and Novartis Pharma. T.M. received research funding from Bristol-Myers K.K. The remaining authors declare no competing financial interests.
Correspondence: Hideyo Hirai, Laboratory of Stem Cell Regulation, School of Life Sciences, Tokyo University of Pharmacy and Life Sciences, 1432-1 Horinouchi, Hachioji, Tokyo 192-0392, Japan; e-mail: hirai@toyaku.ac.jp.

