

Key Points
Inflammatory response induces activation of JAK/STAT signaling in AML that fosters leukemia proliferation.
Inhibition of JAK/STAT signaling leads to significant antileukemic activity in vitro but lacks substantial effects as monotherapy in vivo.

Abstract
Acute myeloid leukemia (AML) is characterized by a high relapse rate and dismal long-term overall survival which is related to persistence of leukemia-initiating cells in their niche. Different animal models of myeloid malignancies reveal how neoplastic cells alter the structural and functional characteristics of the hematopoietic stem cell niche to reinforce malignancy. Understanding and disruption of the microenvironmental interactions with AML cells are a vital need. Malignant niches frequently go along with inflammatory responses, but their impact on cancerogenesis often remains unexplored. Here, we uncovered an aberrant production of inflammatory cytokines in untreated AML bone marrow that was proved to promote the proliferation of leukemia cells. This inflammatory response induced an activation of the Janus kinase/signal transducer and activator of transcription (JAK/STAT) signaling pathway in AML blasts as well as bone marrow stromal cells that also fostered leukemia proliferation. Inhibition of JAK/STAT signaling using the selective JAK1/2 inhibitor ruxolitinib resulted in significant antileukemic activity in AML in vitro which is mediated through both cell-autonomous and microenvironment-mediated mechanisms. However, in a xenograft transplantation model, monotherapy with ruxolitinib did not achieve substantial antileukemic activity, possibly suggesting a complementary function of JAK1/2 inhibition in AML.
Introduction
Patients with acute myeloid leukemia (AML) face a high failure rate of achieving complete remission as well as high relapse rates, which result in poor long-term overall survival. Resistance to therapy is largely a result of the persistence of leukemia-initiating cells.1 For decades, the mainstay of treatment has been based on chemotherapeutic agents. In recent years, increasing evidence points to the significance of the bone marrow microenvironment for the pathogenesis of AML.2,3 Meanwhile, the concept of the hematopoietic stem cell niche where different cellular and noncellular constituents regulate hematopoietic stem cell self-renewal and differentiation is well established.4 In murine models of AML, it has been shown that the microenvironmental regulation of hematopoietic stem cells is significantly perturbed to the advantage of leukemia growth.2 Therefore, treatment should not only encompass cytotoxic agents but should also aim to disrupt the crosstalk between leukemia-initiating cells and their microenvironment. A common feature of different hematologic malignancies is an inflammatory response in the bone marrow niche.5-7 There is evidence for the concept of inflammation as a chronic and self-perpetuating stimulus that forces malignant clones to develop additional subclones by triggering additional mutations in hematopoietic cells.7,8 Furthermore, in murine AML, increased inflammatory signals were linked with severe remodeling of the bone marrow architecture.3 Therefore, understanding the regulation of inflammatory pathways in the AML bone marrow microenvironment may uncover novel options for therapeutic intervention.
Here we report how AML infiltration in humans induces an inflammatory response in the bone marrow followed by an activation of the Janus kinase/signal transducer and activator of transcription (JAK/STAT) signaling pathway. Inhibition of JAK1/2 disrupts the microenvironmental crosstalk with AML cells and results in significant antileukemic activity in vitro.
Patients and methods
Patient samples
Primary patient samples were obtained from peripheral blood or bone marrow of newly diagnosed AML patients and nonleukemic donors after informed consent of all patients according to institutional guidelines. The study was carried out in accordance with the approved protocol of the University of Duisburg-Essen Ethics Committee. Mononuclear cells (MNCs) were purified using Lymphoprep (STEMCELL Technologies, Vancouver, BC, Canada). Patient characteristics are summarized in supplemental Table 1. Primary human bone marrow mesenchymal stem and progenitor cells were isolated from newly diagnosed AML patients or patients with non-Hodgkin lymphoma without bone marrow involvement as controls. Briefly, bone marrow MNCs were digested with Gibco collagenase IV (1 mg/mL) and dispase (2 mg/mL) (Thermo Fisher Scientific, Waltham, MA) followed by magnetic CD45 depletion using the EasySep Human CD45 Depletion Kit (STEMCELL Technologies) and sorted for CD45–CD235a–CD31–CD271+CD146+ cells or expanded in vitro.
In vivo treatments
Procedures were performed in accordance with the German Animal Welfare Act and approved by the local animal ethics committees. NOD-scid Il2Rg−/− (NSG) mice were bred and used in the animal care facility at the University Hospital Essen. Human MNCs, derived from untreated patients with the initial diagnosis of AML, were depleted of CD3+ cells using 1 µL OKT3 per 1 × 10⁶ cells (BioLegend, San Diego, CA) and intravenously transplanted in NSG mice. Bone marrow and spleen cells were harvested from leukemic mice and used for secondary transplantation without previous conditioning. Leukemic mice were randomly assigned (on the basis of their peripheral blood leukemia burden) to begin treatment with ruxolitinib (90 mg/kg twice per day) dissolved in PEG200 or vehicle and administered by oral gavage. Ruxolitinib was provided by Incyte/Novartis. Once mice started to show signs of being moribund, treatment for the entire experiment was discontinued. At the study end point, mice were euthanized, and spleen, bones, and peripheral blood were harvested for further processing.
In vitro experiments
The human cell lines THP-1, HL-60, and KG-1 were purchased from the American Type Culture Collection (ATCC); Kasumi-1 cells were purchased from the German Collection of Microorganisms and Cell Cultures (DSMZ) and cultured according vendor´s recommendations. MS-5 cells and HS-5 cells were cultured in Iscove modified Dulbecco medium supplemented with 20% and 10% fetal calf serum (FCS), respectively. All cell lines were kept for a maximum of 5 passages in culture. Primary hematopoietic cells were cultured in StemSpan serum-free medium (STEMCELL Technologies) supplemented with recombinant human stem cell factor (50 ng/mL), thrombopoietin (50 ng/mL), interleukin-3 (IL-3) (5 ng/mL), IL-6 (5 ng/mL) (all from PeproTech, London, United Kingdom), human high-density lipoprotein (40 µg/mL) (Millipore, Burlington, MA), and Primocin (2 µL/mL) (InvivoGen, San Diego, CA). Human bone marrow–derived mesenchymal stem and progenitor cells were derived from bone marrow MNCs and cultured in MesenCult mesenchymal stem cell (MSC) basal medium (STEMCELL Technologies) containing 2 mM L-glutamine and MesenCult MSC stimulatory supplement (STEMCELL Technologies). Cells were incubated at 37°C in 5% CO2 with a full medium change after 48 hours followed by a half medium change once per week until reaching 80% confluence. Purity was assessed by flow cytometry. For in vitro experiments, the JAK1/2-selective inhibitor ruxolitinib (INCB18424) was purchased from Abmole Bioscience (Houston, TX), diphenyleneiodonium chloride (DPI) was purchased from Sigma-Aldrich (St. Louis, MO).
Statistical analyses
Shapiro-Wilk test was applied as a test of normality. In case of normality, Student t test was applied for comparisons between 2 groups. Mann-Whitney U test and Wilcoxon signed-rank test were used for nonparametric unpaired and paired analyses. Analyses were performed with GraphPad Prism software (San Diego, CA).
Results
AML induces an inflammatory response in the bone marrow niche linked to an activation of JAK/STAT signaling
To evaluate the magnitude of a putative inflammatory response in the human AML bone marrow niche, we measured the expression of inflammatory cytokines in the extracellular bone marrow fluid of AML patients at first diagnosis using multiplex bead-based Luminex technology. In fact, AML infiltration paralleled an upregulation of circulating inflammatory cytokines, in particular IL-8, IL-1β, IL-6, and IL-10 (Figure 1A). The expression of IL-6 and IL-8 positively correlated with the degree of leukemic infiltration in the bone marrow (supplemental Figure 1A). To assess the direct effect of inflammatory cytokines on AML proliferation, we treated AML cell lines and primary human AML samples with increasing concentrations of IL-6, IL-1β, and IL-8 (supplemental Figure 1B). Depending on the added cytokines, their concentration and the AML subtype leukemia growth increased up to 1.5-fold. Cytokine receptor–derived signals are predominantly mediated through the JAK/STAT pathway, which plays a major role in maintaining hematopoietic balance.9 Chronic inflammation is associated with JAK/STAT activation and JAK2 overexpression.10 To test whether the increased expression of inflammatory cytokines in the AML bone marrow niche was correlated with an activation of JAK/STAT signaling, we measured phosphorylation of STAT3 and STAT5 by phosphoflow cytometry. We found a 1.9-fold higher phosphorylation of STAT3 and a 2.4-fold higher phosphorylation of STAT5 in primary AML blasts compared with MNCs from nonleukemic controls (Figure 1B). Furthermore, the degree of activation of the JAK/STAT pathway depended on inflammatory signals. With increasing concentrations of IL-6, phosphorylation of STAT3 was gradually increased in both AML and control samples, whereas phosphorylation of STAT5 showed high variability to IL-6 (Figure 1C-D). Of note, JAK2 mutations are uncommon in de novo AML11 and the majority of AML cell lines.12 Given the role of the microenvironment in regulating inflammatory processes,13,14 we investigated the influence of stromal cells on JAK/STAT activity in human AML. Coculturing primary human AML cells with HS-5 stromal cells for 4 days induced a 1.6-fold increase in phosphorylation of STAT3, but not STAT5, in AML and importantly was not changed in nonleukemic MNCs (Figure 1E). These data indicate that AML induces an inflammatory response in the human bone marrow niche, which leads to an increased activity of the JAK/STAT pathway.
![AML induces an inflammatory response in the human bone marrow niche linked to an activation of JAK/STAT signaling. (A) Cytokine concentrations in the extracellular bone marrow fluid of AML patients (n = 19; mean age, 62.1 years ± standard deviation [SD] 12.1) and controls (n = 19; mean age, 58.2 years ± 15.7) quantified by Magnetic Luminex Performance Assay. Corresponding P values are given for each cytokine tested. (B) Median fluorescence intensity (MFI) of pSTAT3 and pSTAT5 in unstimulated peripheral blood mononuclear cells (PBMCs) from AML patients (n = 8) and controls (n = 7) assessed by BD Phosflow technology. (C) Representative flow cytometry plots showing fluorescence intensity of pSTAT3 (left) and pSTAT5 (right) of 1 AML patient sample under indicated conditions. (D) MFI of pSTAT3 (left) and pSTAT5 (right) in PBMCs from AML patients and controls after incubation with either IL-6 at the indicated concentrations or in combination with 2 µM ruxolitinib (Ruxo) for 15 minutes. MFI is given in relation to the unstimulated control condition; linked dots represent 1 patient sample under indicated conditions. (E) Primary human AML cells and controls were cocultured with HS-5 cells and treated with 2 µM ruxolitinib. Left, representative fluorescence intensity of 1 AML patient sample after mono- and coculture compared with fluorescence minus one (FMO) control. Right, MFI of pSTAT3 and pSTAT5 (normalized to monocultured control [n = 4-6]; each primary sample was tested in duplicate). DMSO, dimethyl sulfoxide. Data are shown as mean ± standard error of the mean (SEM). See also supplemental Figure 1. *P < .05; **P < .01; ***P < .001; ****P < .0001 as determined by Mann-Whitney U test or Wilcoxon signed-rank test.](https://ash.silverchair-cdn.com/ash/content_public/journal/bloodadvances/4/13/10.1182_bloodadvances.2019001292/1/m_advancesadv2019001292f1.png?Expires=1770360154&Signature=V4AmJAKD5MB-dKqWF2xMBKmTdVq9T1WTk~5W8ns3giRjcCf42cjODIgNymBPErl73usZx~p-~-ZVUTsFMagQ7Etz88PZ-cPzlmIuUFK3o8-GjWW3gdKsUO4tXT8fxPRNrzJpVcmzUVYVRIrGbQaEeobTri5cKsKhc3Gb67nmdFJKRee~cR37ho6avmZ8t0etXoNtiqSd-VZEy-lZPZmvMo0K71kOC6iUspYsS5vcrjXHIlxo1TO5s31fdye3stBJ9SShC8OTVinE~TgZbunSaxSVmGcsfc1sCIm7kJnREcLD8vjqHQCjuNLUZQDFpw5pa2ygVEr7ZVzBnEcXk7mxOw__&Key-Pair-Id=APKAIE5G5CRDK6RD3PGA)
AML induces an inflammatory response in the human bone marrow niche linked to an activation of JAK/STAT signaling. (A) Cytokine concentrations in the extracellular bone marrow fluid of AML patients (n = 19; mean age, 62.1 years ± standard deviation [SD] 12.1) and controls (n = 19; mean age, 58.2 years ± 15.7) quantified by Magnetic Luminex Performance Assay. Corresponding P values are given for each cytokine tested. (B) Median fluorescence intensity (MFI) of pSTAT3 and pSTAT5 in unstimulated peripheral blood mononuclear cells (PBMCs) from AML patients (n = 8) and controls (n = 7) assessed by BD Phosflow technology. (C) Representative flow cytometry plots showing fluorescence intensity of pSTAT3 (left) and pSTAT5 (right) of 1 AML patient sample under indicated conditions. (D) MFI of pSTAT3 (left) and pSTAT5 (right) in PBMCs from AML patients and controls after incubation with either IL-6 at the indicated concentrations or in combination with 2 µM ruxolitinib (Ruxo) for 15 minutes. MFI is given in relation to the unstimulated control condition; linked dots represent 1 patient sample under indicated conditions. (E) Primary human AML cells and controls were cocultured with HS-5 cells and treated with 2 µM ruxolitinib. Left, representative fluorescence intensity of 1 AML patient sample after mono- and coculture compared with fluorescence minus one (FMO) control. Right, MFI of pSTAT3 and pSTAT5 (normalized to monocultured control [n = 4-6]; each primary sample was tested in duplicate). DMSO, dimethyl sulfoxide. Data are shown as mean ± standard error of the mean (SEM). See also supplemental Figure 1. *P < .05; **P < .01; ***P < .001; ****P < .0001 as determined by Mann-Whitney U test or Wilcoxon signed-rank test.
AML induces an inflammatory response in the human bone marrow niche linked to an activation of JAK/STAT signaling. (A) Cytokine concentrations in the extracellular bone marrow fluid of AML patients (n = 19; mean age, 62.1 years ± standard deviation [SD] 12.1) and controls (n = 19; mean age, 58.2 years ± 15.7) quantified by Magnetic Luminex Performance Assay. Corresponding P values are given for each cytokine tested. (B) Median fluorescence intensity (MFI) of pSTAT3 and pSTAT5 in unstimulated peripheral blood mononuclear cells (PBMCs) from AML patients (n = 8) and controls (n = 7) assessed by BD Phosflow technology. (C) Representative flow cytometry plots showing fluorescence intensity of pSTAT3 (left) and pSTAT5 (right) of 1 AML patient sample under indicated conditions. (D) MFI of pSTAT3 (left) and pSTAT5 (right) in PBMCs from AML patients and controls after incubation with either IL-6 at the indicated concentrations or in combination with 2 µM ruxolitinib (Ruxo) for 15 minutes. MFI is given in relation to the unstimulated control condition; linked dots represent 1 patient sample under indicated conditions. (E) Primary human AML cells and controls were cocultured with HS-5 cells and treated with 2 µM ruxolitinib. Left, representative fluorescence intensity of 1 AML patient sample after mono- and coculture compared with fluorescence minus one (FMO) control. Right, MFI of pSTAT3 and pSTAT5 (normalized to monocultured control [n = 4-6]; each primary sample was tested in duplicate). DMSO, dimethyl sulfoxide. Data are shown as mean ± standard error of the mean (SEM). See also supplemental Figure 1. *P < .05; **P < .01; ***P < .001; ****P < .0001 as determined by Mann-Whitney U test or Wilcoxon signed-rank test.
Inhibition of JAK/STAT pathway has specific antileukemic activity
We hypothesized that inhibition of the JAK/STAT pathway might exert antileukemic activity in AML. JAK1/2 inhibition previously showed efficient reduction of elevated levels of inflammatory cytokines, but with modest activity on mutational load in myelofibrosis.15,16 In fact, application of the JAK1/2 inhibitor ruxolitinib showed dramatic reduction in cell growth in different human AML cell lines (Figure 2A; supplemental Figure 2A). Applying a series of concentrations of ruxolitinib resulted in values for the concentration that inhibits 50% (IC50) between 650 nM and 21.17 µM, whereas human MLL-AF9–mutated THP-1 and AML1/ETO-mutated Kasumi cell lines showed the highest sensitivity to ruxolitinib (Figure 2A; supplemental Figure 2A-B). In contrast, KG-1 and HL-60 cell lines showed only minor effects at higher dosages (Figure 2A; supplemental Figure 2A-B). Of note, THP-1 cells showed comparatively high phosphorylation of STAT3 (supplemental Figure 2D). The cytotoxic effects on THP-1 cells resulted in a dramatic reduction in the number of leukemia colonies, with formation of strikingly smaller colonies indicating reduced proliferation capacity (Figure 2B). Notably, plating equal numbers of viable cells after treatment with ruxolitinib still showed a deficient colony formation, suggesting loss of leukemogenic potential upon treatment with ruxolitinib (Figure 2C). To better differentiate cell-autonomous effects from microenvironment-mediated effects, we used a coculture model with MS-5 stromal cells, which proved to significantly support proliferation of most AML cell lines (Figure 2A; supplemental Figure 2B)17 or HS-5 stromal cells and bone marrow–derived primary human mesenchymal stem and progenitor cells for coculture with primary human AML or nonleukemic MNCs. Culturing primary human AML cells with HS-5 stromal cells led to variable increases of inflammatory cytokines in the supernatant compared with monocultured AML cells (supplemental Figure 1C). In addition, coculture with bone marrow–derived primary human mesenchymal stem and progenitor cells led to significantly higher secretion of IL-6, but not IL-1β or IL-8 (supplemental Figure 1D), suggesting that this in vitro model replicates aspects of an inflammatory niche. Interestingly, the antileukemic activity of ruxolitinib in coculture with stromal cells was around 30% higher compared with its effects in monoculture (Figure 2A). Considering the substantial heterogeneity in AML, we used a number of primary human AML samples, including samples with favorable (∼15%) and adverse (∼40%) genetic abnormalities according to the European LeukemiaNet recommendations (supplemental Table 1), and we screened their sensitivity to ruxolitinib treatment in a serum-free coculture model.1 Again, coculture for 4 days led to a significant growth advantage for AML cells. We confirmed a significant cell-autonomous and more pronounced microenvironment-mediated antileukemic efficacy of treatment with ruxolitinib on primary human AML cells (Figure 2D; supplemental Figure 2C). Depending on the drug concentration, AML cell growth was reduced by approximately 70% in the coculture model. In addition, these findings could be confirmed by coculture of primary human AML cells with bone marrow–derived primary human mesenchymal stem and progenitor cells (Figure 2E). Of note, the inhibition of cell growth was AML specific. Ruxolitinib had no substantial effects on nonleukemic MNCs in either the monoculture or the coculture system, nor did we observe any cytotoxic effects on stromal cells (Figure 2D; supplemental Figure 2C,E). To prove the specificity to leukemia cells, AML blasts from a single donor were separated by fluorescence-activated cell sorting (FACS) from residual nonleukemic cells, whereas both fractions were exposed to ruxolitinib in coculture with HS-5 stromal cells. In fact, only leukemia cells showed cell growth that was significantly decreased by about 50% (Figure 2F). This antileukemic specificity was independent of genetic characteristics of AML cells (supplemental Figure 2F). In summary, ruxolitinib showed selective antileukemic activity in AML by interfering in the microenvironmental crosstalk and sparing healthy hematopoiesis and stromal cells.
Dissecting the antileukemic effects of ruxolitinib revealed a significant inhibition in AML proliferation. Bromodeoxyuridine analysis showed a 40% to 60% reduction of proliferating cells in ruxolitinib-responsive AML cell lines after 2 days (Figure 3A), whereas apoptosis was induced only to a small extent (Figure 3B). Given the fact that ruxolitinib decreased the leukemogenic potential in certain AML cell lines (Figure 2C), we tested for the capacity to induce differentiation of myeloid blasts. Strikingly, MLL-AF9–mutated THP-1 cells showed an increased expression of CD11b upon treatment, but that was not reflected by a more differentiated cytomorphologic phenotype (supplemental Figure 3A-B). Furthermore, 1 of 6 tested primary AML samples revealed an increased expression of CD11b, CD14, CD16, and CD66b upon ruxolitinib treatment, again without morphologic signs of differentiation (supplemental Figure 3C). Other ruxolitinib-responsive AML cell lines also failed to show increased differentiation by FACS or cytomorphology (supplemental Figure 3B). In summary, the specific antileukemic activity of ruxolitinib is based on both microenvironment-mediated and cell-autonomous mechanisms, whereas the latter is predominantly a result of significant decrease in cell proliferation.
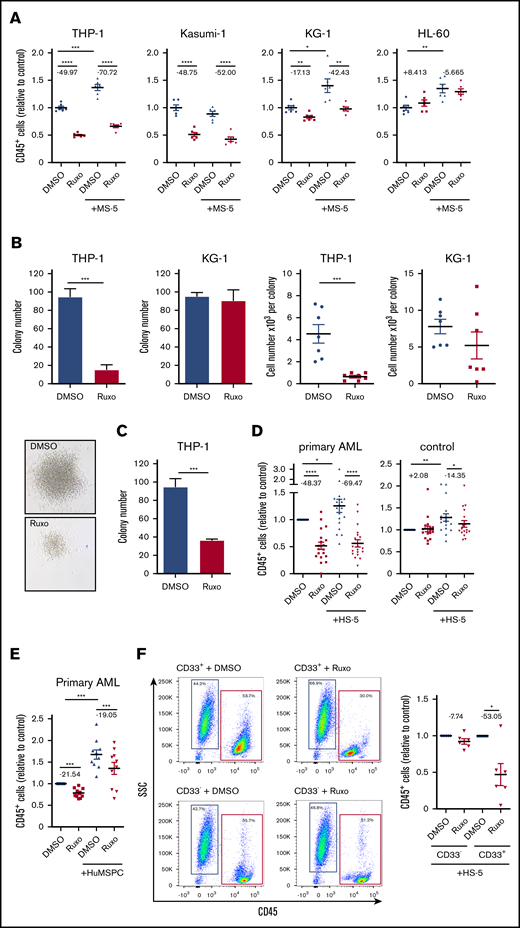
Inhibition of JAK/STAT signaling has strong antileukemic efficacy in AML in vitro. (A) Human AML cell lines were either mono- or cocultured with MS-5 stromal cells and treated with 2 µM ruxolitinib or vehicle for 4 days. Absolute numbers of CD45+ cells were normalized to monocultured control (n = 6); for each pair, the mean change in cell count is given in percentage points. (B) In all, 5 × 10⁴ THP-1 or KG-1 cells were treated with 2 µM ruxolitinib or vehicle for 4 days, and then 200 cells were transferred to methylcellulose medium (n = 4). Number of colonies and cell numbers of single colonies were determined after 10 days. Representative colonies of THP-1 cells are shown below. (C) Primary colony formation of equal numbers of viable THP-1 cells after treatment with ruxolitinib or vehicle (n = 4). (D) Primary human AML cells or PBMCs as controls were either mono- or cocultured with HS-5 cells and treated with 2 µM ruxolitinib or vehicle for 4 days. Absolute numbers of CD45+ cells were normalized to monocultured control (n = 18-19 different AML or control donors; each primary sample was tested in triplicate); for each pair the change in cell count is given in percentage points. (E) Primary human AML cells were either mono- or cocultured with bone marrow–derived primary human mesenchymal stem and progenitor cells (HuMSPCs) and treated with 2 µM ruxolitinib or vehicle. Absolute numbers of CD45+ cells were normalized to monocultured control (n = 10 different AML and 2 different HuMSPC donors; each primary AML sample was tested in triplicate); for each pair, the change in cell count is given in percentage points. (F) CD33+ and CD33– PBMCs from an individual AML patient were separated by FACS and treated with 2 µM ruxolitinib or vehicle in coculture with HS-5 stromal cells for 4 days. Left, representative flow cytometry plots gated on 4′,6-diamidino-2-phenylindole (DAPI)– single cells after treatment with 2 µM ruxolitinib or vehicle. Right, absolute cell numbers of isolated CD33+ and CD33– cells after ruxolitinib or vehicle treatment normalized to control (n = 6 different AML donors; each primary sample was tested in triplicate); for each pair, the change in cell count is given in percentage points. Data are shown as mean ± SEM. See also supplemental Figure 2. *P < .05; **P < .01; ***P < .001; ****P < .0001 determined by Student t test or Wilcoxon signed-rank test. SSC, side scatter.
Inhibition of JAK/STAT signaling has strong antileukemic efficacy in AML in vitro. (A) Human AML cell lines were either mono- or cocultured with MS-5 stromal cells and treated with 2 µM ruxolitinib or vehicle for 4 days. Absolute numbers of CD45+ cells were normalized to monocultured control (n = 6); for each pair, the mean change in cell count is given in percentage points. (B) In all, 5 × 10⁴ THP-1 or KG-1 cells were treated with 2 µM ruxolitinib or vehicle for 4 days, and then 200 cells were transferred to methylcellulose medium (n = 4). Number of colonies and cell numbers of single colonies were determined after 10 days. Representative colonies of THP-1 cells are shown below. (C) Primary colony formation of equal numbers of viable THP-1 cells after treatment with ruxolitinib or vehicle (n = 4). (D) Primary human AML cells or PBMCs as controls were either mono- or cocultured with HS-5 cells and treated with 2 µM ruxolitinib or vehicle for 4 days. Absolute numbers of CD45+ cells were normalized to monocultured control (n = 18-19 different AML or control donors; each primary sample was tested in triplicate); for each pair the change in cell count is given in percentage points. (E) Primary human AML cells were either mono- or cocultured with bone marrow–derived primary human mesenchymal stem and progenitor cells (HuMSPCs) and treated with 2 µM ruxolitinib or vehicle. Absolute numbers of CD45+ cells were normalized to monocultured control (n = 10 different AML and 2 different HuMSPC donors; each primary AML sample was tested in triplicate); for each pair, the change in cell count is given in percentage points. (F) CD33+ and CD33– PBMCs from an individual AML patient were separated by FACS and treated with 2 µM ruxolitinib or vehicle in coculture with HS-5 stromal cells for 4 days. Left, representative flow cytometry plots gated on 4′,6-diamidino-2-phenylindole (DAPI)– single cells after treatment with 2 µM ruxolitinib or vehicle. Right, absolute cell numbers of isolated CD33+ and CD33– cells after ruxolitinib or vehicle treatment normalized to control (n = 6 different AML donors; each primary sample was tested in triplicate); for each pair, the change in cell count is given in percentage points. Data are shown as mean ± SEM. See also supplemental Figure 2. *P < .05; **P < .01; ***P < .001; ****P < .0001 determined by Student t test or Wilcoxon signed-rank test. SSC, side scatter.
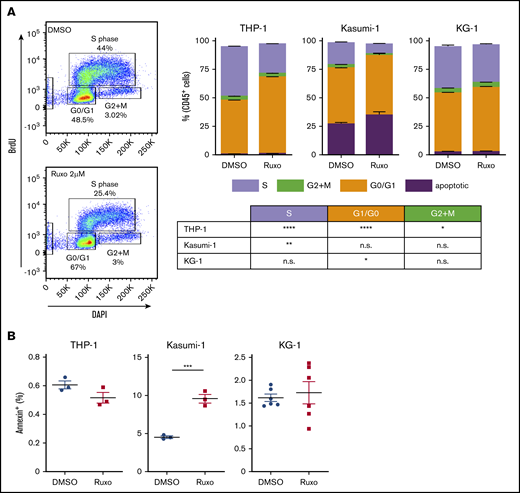
Ruxolitinib inhibits proliferation of AML cells. (A) Cell proliferation analysis by FACS using BD bromodeoxyuridine (BrdU) flow assay. Left, representative plots; right quantification for different AML cell lines treated with 2 µM ruxolitinib or vehicle for 2 days (n = 3-6). (B) Quantification of apoptotic cells by Annexin V assay in different AML cell lines after treatment with 2 µM ruxolitinib or vehicle for 3 days (n = 3-6). Data are shown as mean ± SEM. See also supplemental Figure 3. *P < .05; **P < .01; ***P < .001; ****P < .0001 as determined by Student t test. n.s., not significant.
Ruxolitinib inhibits proliferation of AML cells. (A) Cell proliferation analysis by FACS using BD bromodeoxyuridine (BrdU) flow assay. Left, representative plots; right quantification for different AML cell lines treated with 2 µM ruxolitinib or vehicle for 2 days (n = 3-6). (B) Quantification of apoptotic cells by Annexin V assay in different AML cell lines after treatment with 2 µM ruxolitinib or vehicle for 3 days (n = 3-6). Data are shown as mean ± SEM. See also supplemental Figure 3. *P < .05; **P < .01; ***P < .001; ****P < .0001 as determined by Student t test. n.s., not significant.
Ruxolitinib targets inflammation-induced JAK/STAT signaling in leukemia microenvironment and production of ROS
Previously, it was suggested that JAK1/2 inhibitors not only affect the malignant clone in myeloproliferative neoplasia.18 It is still unclear how ruxolitinib exerts its antileukemic activity in the AML microenvironment. To evaluate putative targets of ruxolitinib in the microenvironment, we assessed the expression of JAK/STAT signaling-related genes in stromal cells by quantitative real-time polymerase chain reaction. We found that purified bone marrow–derived primary human mesenchymal stem and progenitor cells cocultured with primary AML cells had an increased JAK1/2, STAT3, and STAT5a expression compared with stromal cells cultured with nonleukemic cells (Figure 4A). Similarly, HS-5 cells cultured with primary AML cells showed increased JAK2 expression, whereas this effect could be abolished by treatment with ruxolitinib (supplemental Figure 4A-B). To assess the clinical relevance of this observation, bone marrow mesenchymal stem and progenitor cells from untreated AML patients or nonleukemic controls were isolated by FACS. In fact, CD146+271+ mesenchymal stem and progenitor cells from AML patients showed an almost threefold higher expression of JAK2 (Figure 4B). To further substantiate the role of JAK/STAT signaling in the microenvironment, we performed immunofluorescence staining for phosphorylated STAT3 (pSTAT3) on bone marrow–derived primary human mesenchymal stem and progenitor cells after coculture with primary AML or nonleukemic MNCs. The results do not show an obvious difference in pSTAT3 (Figure 4C). To validate this, we measured phosphorylation of STAT3 and STAT5 by phosphoflow cytometry in bone marrow–derived primary human mesenchymal stem and progenitor cells. Coculture with 4 of 6 primary human AML cells led to a 1.25-fold increase in pSTAT3 and an almost twofold increase in pSTAT5 in bone marrow–derived primary human mesenchymal stem and progenitor cells compared with coculture with nonleukemic MNCs (Figure 4D). This indicates that the activation of JAK/STAT signaling in mesenchymal stem and progenitor cells is primarily observed at the messenger RNA level and to lesser degree at increased phosphorylation of STAT proteins. It raises the question of how AML infiltration induces JAK/STAT signaling in the niche. To examine the role of leukemia-derived inflammatory signals, we treated HS-5 stromal cells with increasing concentrations of IL-6 and IL-1β. IL-6 did not induce any changes in expression of JAK1, JAK2, or JAK3 (supplemental Figure 4C). However, IL-1β significantly increased JAK2 expression in stromal cells (supplemental Figure 4D). Of note, stromal cells cocultured with primary AML cells did not show increased expression of inflammatory cytokines (supplemental Figure 4E). This implies that AML-derived inflammatory cytokines, in particular IL-1β, induce JAK/STAT signaling in mesenchymal cells.
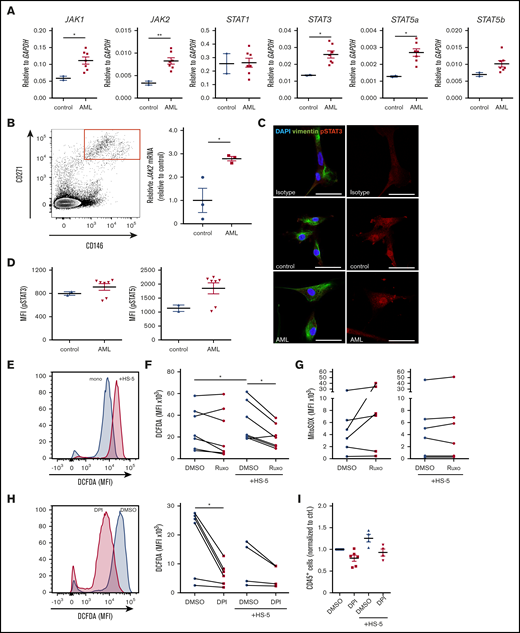
Ruxolitinib targets inflammation-induced JAK/STAT signaling in leukemia microenvironment and ROS production. (A) JAK1/2, STAT1/3/5a/5b gene expression analysis in sorted bone marrow-derived primary human mesenchymal stem and progenitor cells after coculture with primary human AML cells (n = 7) or healthy controls (n = 2) for 4 days by real-time polymerase chain reaction (PCR) (each primary sample was tested in triplicate). (B) Left, representative FACS plot of CD271+CD146+ primary human bone marrow mesenchymal stem and progenitor cells, gated on CD45–CD235–CD31– cells. Right, JAK2 gene expression analysis in sorted bone marrow mesenchymal stem and progenitor cells from AML patients or nonleukemic controls at first diagnosis by real-time PCR (n = 3, data normalized to control). (C) Confocal images from primary human mesenchymal stem and progenitor cells after coculture with nonleukemic mononuclear cells (control) or primary human AML cells stained for vimentin and pSTAT3. The scale bars, 50 µm. (D) primary human AML cells (n = 7) and controls (n = 2) were cocultured with bone marrow–derived primary human mesenchymal stem and progenitor cells. MFI of pSTAT3 and pSTAT5 of stromal cells assessed by BD Phosflow technology (each sample was tested in duplicate). (E-F) Intracellular ROS production detected by measuring 2′,7′-dichlorofluorescin diacetate (DCFDA) in primary human AML cells in mono- or coculture with HS-5 stromal cells. (E) Exemplary FACS plot showing the MFI of DCFDA in 1 DMSO-treated AML patient sample mono- or cocultured with HS-5 stromal cells. (F) Intracellular ROS production in mono- or cocultured primary human AML cells after treatment with 2 µM ruxolitinib for 4 days (n = 7-9 different primary AML samples; each primary sample was tested in triplicate; connecting lines represent 1 patient sample). (G) Mitochondrial superoxide (MitoSOX) production in mono- or cocultured primary human AML cells after treatment with 2 µM ruxolitinib or vehicle using MitoSOX Red reagent (n = 6 different primary AML samples; each primary sample was tested in triplicate, connecting lines represent 1 patient sample). (H) Intracellular ROS production was detected by measuring DCFDA in mono- or cocultured primary human AML cells treated with 0.5 µM diphenyleneiodonium (DPI) or vehicle for 2 days. Left, representative FACS plot showing the MFI of DCFDA in 1 AML patient sample treated with DPI or vehicle. Right, quantification of intracellular ROS production in primary human AML cells in mono- or coculture with HS-5 stromal cells (n = 4-6 different primary AML samples; each primary sample was tested in triplicate; connecting lines represent 1 patient sample). (I) Primary human AML cells were either mono- or cocultured with HS5 cells and treated with 0.5 µM DPI or vehicle for 2 days. Absolute numbers of CD45+ cells were normalized to monocultured control (n = 4-6 different AML donors; each primary sample was tested in triplicate). Data are shown as mean ± SEM. See also supplemental Figure 4. *P < .05; **P < .01 determined by Student t test, Wilcoxon signed-rank test, or Mann-Whitney U test.
Ruxolitinib targets inflammation-induced JAK/STAT signaling in leukemia microenvironment and ROS production. (A) JAK1/2, STAT1/3/5a/5b gene expression analysis in sorted bone marrow-derived primary human mesenchymal stem and progenitor cells after coculture with primary human AML cells (n = 7) or healthy controls (n = 2) for 4 days by real-time polymerase chain reaction (PCR) (each primary sample was tested in triplicate). (B) Left, representative FACS plot of CD271+CD146+ primary human bone marrow mesenchymal stem and progenitor cells, gated on CD45–CD235–CD31– cells. Right, JAK2 gene expression analysis in sorted bone marrow mesenchymal stem and progenitor cells from AML patients or nonleukemic controls at first diagnosis by real-time PCR (n = 3, data normalized to control). (C) Confocal images from primary human mesenchymal stem and progenitor cells after coculture with nonleukemic mononuclear cells (control) or primary human AML cells stained for vimentin and pSTAT3. The scale bars, 50 µm. (D) primary human AML cells (n = 7) and controls (n = 2) were cocultured with bone marrow–derived primary human mesenchymal stem and progenitor cells. MFI of pSTAT3 and pSTAT5 of stromal cells assessed by BD Phosflow technology (each sample was tested in duplicate). (E-F) Intracellular ROS production detected by measuring 2′,7′-dichlorofluorescin diacetate (DCFDA) in primary human AML cells in mono- or coculture with HS-5 stromal cells. (E) Exemplary FACS plot showing the MFI of DCFDA in 1 DMSO-treated AML patient sample mono- or cocultured with HS-5 stromal cells. (F) Intracellular ROS production in mono- or cocultured primary human AML cells after treatment with 2 µM ruxolitinib for 4 days (n = 7-9 different primary AML samples; each primary sample was tested in triplicate; connecting lines represent 1 patient sample). (G) Mitochondrial superoxide (MitoSOX) production in mono- or cocultured primary human AML cells after treatment with 2 µM ruxolitinib or vehicle using MitoSOX Red reagent (n = 6 different primary AML samples; each primary sample was tested in triplicate, connecting lines represent 1 patient sample). (H) Intracellular ROS production was detected by measuring DCFDA in mono- or cocultured primary human AML cells treated with 0.5 µM diphenyleneiodonium (DPI) or vehicle for 2 days. Left, representative FACS plot showing the MFI of DCFDA in 1 AML patient sample treated with DPI or vehicle. Right, quantification of intracellular ROS production in primary human AML cells in mono- or coculture with HS-5 stromal cells (n = 4-6 different primary AML samples; each primary sample was tested in triplicate; connecting lines represent 1 patient sample). (I) Primary human AML cells were either mono- or cocultured with HS5 cells and treated with 0.5 µM DPI or vehicle for 2 days. Absolute numbers of CD45+ cells were normalized to monocultured control (n = 4-6 different AML donors; each primary sample was tested in triplicate). Data are shown as mean ± SEM. See also supplemental Figure 4. *P < .05; **P < .01 determined by Student t test, Wilcoxon signed-rank test, or Mann-Whitney U test.
Generally, chronic inflammation and cancer are closely linked to elevated levels of intracellular reactive oxygen species (ROS).19 Recently, it has been shown that genetic alterations in the mesenchymal stem cell niche can induce oxidative stress in hematopoietic stem cells through inflammatory signals, ultimately contributing to AML transformation.7 To elucidate whether ruxolitinib interferes with inflammation-induced ROS production, we first measured ROS levels in our coculture system. Four of 9 of the applied primary human AML cells showed a two- to threefold increase in ROS generation after coculture with stromal cells compared with monoculture after 4 days (Figure 4E-F). Treatment with ruxolitinib did not lead to a significant change in ROS levels in monocultured AML cells. However, 5 of 6 primary AML samples cocultured with stromal cells showed an almost 50% reduction in intracellular ROS levels after treatment (Figure 4F). Next, we evaluated the source of niche-mediated ROS generation and assessed mitochondrial superoxide production using the mitochondrial superoxide (MitoSOX) assay. We did not observe any difference in mitochondrial superoxide in mono- or cocultured primary AML cells, nor did the levels change after treatment with ruxolitinib (Figure 4G). Next to the mitochondrial source, nicotinamide adenine dinucleotide phosphate oxidases (NOX) are a known major producer of ROS. We therefore applied DPI, a specific inhibitor of NOX and nitric oxide synthetase in mono- and coculture. Treating primary AML cells with DPI led to significant reduction of ROS production (Figure 4H) alongside a moderate 20% to 25% reduction in cell growth in mono- and cocultured AML cells (Figure 4I). However, given the striking effects of DPI on ROS production, in particular in monoculture, it is unlikely that ruxolitinib interferes in ROS production via inhibition of NOX.
This suggests that AML cells secrete inflammatory cytokines that activate the JAK/STAT pathway in the microenvironment which again perpetuates JAK/STAT signaling in AML cells. Ruxolitinib interferes in this crosstalk by downregulating JAK/STAT signaling in the microenvironment and inhibiting microenvironmentally induced ROS production in AML cells which eventually contributes to its antileukemic efficacy.
Ruxolitinib reduces spleen size but lacks antileukemic activity in vivo
To test the in vivo antileukemic activity of ruxolitinib in a clinically relevant model, we transplanted different primary human AML cells into immunodeficient NSG mice. Secondary transplantation of primary human AML cells allowed robust engraftment without any conditioning and thus avoiding any interference with the microenvironment. With a mean leukemia burden of ∼30% (mean, 27.2%, ± standard error of the mean, 2.4) in the peripheral blood, mice were randomly assigned and treated twice per day with 90 mg/kg ruxolitinib or vehicle for an average of 20 days (supplemental Figure 5A). Strikingly, ruxolitinib-treated mice showed a reduction of 30% in spleen size (Figure 5A; supplemental Figure 5B). However, monotherapy with ruxolitinib did not show any significant change in cellularity or reduction in leukemia burden in bone marrow, spleen, or peripheral blood (Figure 5A-C; supplemental Figure 5B-C). Of note, transplanted primary human AML samples proved to be sensitive to ruxolitinib in vitro (median cytoreduction, 30%; range, 12% to 67% in monoculture and 55%; range, 19% to 65% in coculture). In myelofibrosis, ruxolitinib has been shown to reduce fibrotic tissue in bone marrow.20 Because there are hints of an increase in bone marrow fibers in AML, we also screened murine bones for the abundance of reticulin fibers. Overall, leukemic bone marrow showed only scattered reticulin fibers in the central marrow and endosteal region, which did not differ between the groups (Figure 5D). We were not able to detect significant levels of human inflammatory cytokines in the extracellular bone marrow fluid of engrafted NSG mice using the multiplex bead-based Luminex technology (data not shown). Notably, ruxolitinib-treated mice showed lower hemoglobin levels, which is a known adverse effect that occurs early in myelofibrosis patients (Figure 5E; supplemental Figure 5C). In summary, ruxolitinib significantly reduced spleen size, which is a well described effect of the drug in symptomatic myelofibrosis, but it lacked antileukemic efficacy as a monotherapy in AML in vivo.
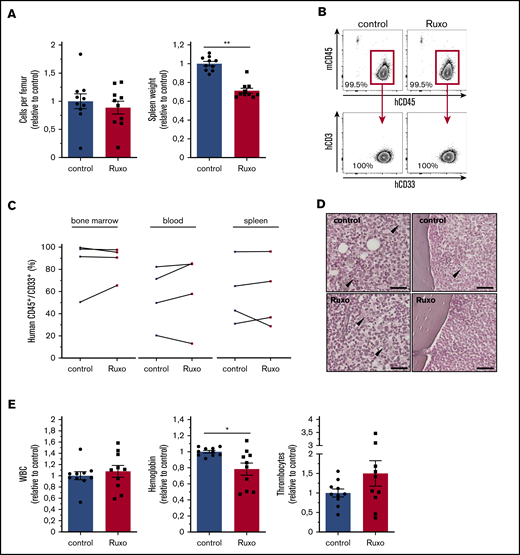
Ruxolitinib reduces spleen size but lacks antileukemic activity in vivo. (A) cells per femur and wet spleen weight (data normalized to control). (B) Flow cytometry gating strategy for bone marrow analysis of human hematopoietic engraftment by gating on human hCD45+ cells, detecting exclusively myeloid hCD33+ cells, and excluding hCD3+ cells for each experimental condition. (C) Human AML engraftment in bone marrow, peripheral blood, and spleen (n = 4 different primary AML samples; 2-4 mice per group per sample. Data normalized to control). (D) Representative images of reticulum staining on femur sections. Arrowheads indicate reticular fibers. Scale bars, 50 µm. (E) Peripheral blood counts of ruxolitinib- or vehicle-treated leukemic NSG mice (data normalized to control). Data are shown as mean ± SEM. See also supplemental Figure 5. *P < .05; **P < .01 determined by Wilcoxon signed-rank test.
Ruxolitinib reduces spleen size but lacks antileukemic activity in vivo. (A) cells per femur and wet spleen weight (data normalized to control). (B) Flow cytometry gating strategy for bone marrow analysis of human hematopoietic engraftment by gating on human hCD45+ cells, detecting exclusively myeloid hCD33+ cells, and excluding hCD3+ cells for each experimental condition. (C) Human AML engraftment in bone marrow, peripheral blood, and spleen (n = 4 different primary AML samples; 2-4 mice per group per sample. Data normalized to control). (D) Representative images of reticulum staining on femur sections. Arrowheads indicate reticular fibers. Scale bars, 50 µm. (E) Peripheral blood counts of ruxolitinib- or vehicle-treated leukemic NSG mice (data normalized to control). Data are shown as mean ± SEM. See also supplemental Figure 5. *P < .05; **P < .01 determined by Wilcoxon signed-rank test.
Discussion
Increasing insight into the structural and functional organization of the bone marrow microenvironment in AML supports that it has an impact on AML initiation and progression. Likely, the high relapse rate in AML is a result of an aberrant regulation of residual leukemia stem cells in their niche. Therefore, understanding of and interference with this crosstalk are of high priority for improving outcome. Inflammatory response in the microenvironment is a characteristic feature of myeloproliferative neoplasia and has been proved to predict clinical outcome.21 Inflammatory responses have also been observed in murine models of myelodysplastic syndromes and AML and were found to be relevant for their pathobiology.6,7,22 Furthermore, in human AML, aberrant IL-1 signaling promoted AML progenitor cells.23 IL-1 receptor accessory protein (IL1RAP) was overexpressed on hematopoietic stem cells of patients with AML and high-risk myelodysplastic syndrome, and it was associated with poor overall survival.24 However, the clinical and therapeutic significance of this sterile inflammation in AML has not yet been thoroughly explored.
Here we presented how AML infiltration induces an inflammatory response in the human bone marrow microenvironment, which is linked to an aberrant activation of JAK/STAT signaling in AML blasts as well as the microenvironment that again fosters proliferation of leukemia cells. Aberrant activation of JAK/STAT signaling has been observed in a number of hematologic malignancies, and JAK inhibition contributed to antineoplastic effects in myeloproliferative neoplasia and murine models of acute lymphoblastic leukemia.15,25-28 However, the mechanisms by which these agents achieve clinical efficacy have not been fully delineated. More recently, it has been shown that inhibition of JAK-STAT3 pathway in both mutant and nonmutant cells is required to reduce inflammatory signaling to achieve clinical benefit in murine myeloproliferative neoplasia.18 Here we show that inhibition of JAK/STAT signaling results in antileukemic activity in AML, which is mediated through both cell-autonomous and microenvironment-mediated mechanisms. AML infiltration goes along with increased expression of IL-1β, which induces JAK/STAT signaling in stromal cells. This again perpetuates the JAK/STAT pathway in AML cells and induces ROS generation in leukemia cells. JAK1/2 inhibition disrupts this crosstalk and thus enhances its antileukemic activity. In line with an in vitro drug screening study, many AML samples were found to be sensitive to JAK inhibitors after coculturing with stromal cells.29 Karjalainen et al29 showed that adding ruxolitinib to a BCL2 inhibitor overcame stroma-mediated drug resistance in AML.
Modulating the microenvironment by attenuating the inflammatory response is a feasible approach to directly inhibit AML progression and also to increase sensitivity of other antileukemic compounds. However, monotherapy did not achieve substantial antileukemic activity in vivo. This could be a result of lower efficiency in diminishing the autocrine effects of inflammatory cytokines on AML blasts in vivo as well as the complexity of the microenvironmental regulation which our in vitro system does not account for. Conversely, a xenograft model may not accurately reproduce the influence of human AML-derived inflammatory cytokines on murine stromal cells. More likely, a combination of ruxolitinib with different antileukemic agents could improve the efficacy of long-term therapy in AML.
Requests for data should be addressed to Maher Hanoun at maher.hanoun@uk-essen.de.
Acknowledgments
The authors thank the staff at the Imaging Center Essen for their assistance with expert cell sorting and imaging, as well as the Institute of Pathology of the University Hospital Essen for hematoxylin and eosin and reticulum stainings. Ruxolitinib was provided by Incyte/Novartis.
This work was supported by a grant from the Dr. Werner Jackstädt Foundation. J.H. is supported by a doctoral study course of the University Hospital Essen promoted by the Else Kröner-Fresenius Foundation.
Authorship
Contribution: J.H., L.A., Y.C., and M.M. designed and performed experiments, analyzed data, and provided valuable input on the manuscript; K.B. and S.B. performed cytokine measurements; U.D. discussed data and provided valuable input on the manuscript; and M.H. designed and supervised the study, analyzed and discussed data, and wrote the manuscript.
Conflict-of-interest disclosure: The authors declare no competing financial interests.
Correspondence: Maher Hanoun, Department of Hematology, University Hospital Essen, Hufelandstrasse 55, 45147 Essen, Germany; e-mail: maher.hanoun@uk-essen.de.

