

Key Points
Mogamulizumab treatment provokes homeostatic CD8+ T-cell proliferation, along with diversification, of PBMCs in ATL patients.

Abstract
Skin-related adverse events (AEs) occur frequently in adult T-cell leukemia-lymphoma (ATL) patients treated with mogamulizumab, a humanized anti-CCR4 monoclonal antibody. This study was undertaken to elucidate the mechanisms of mogamulizumab-induced skin-related AEs. We analyzed the T-cell receptor β chain repertoire in ATL patients’ peripheral blood mononuclear cells (PBMCs) before and after mogamulizumab. Skin-related AEs were present in 16 patients and were absent in 8 patients. Additionally, we included 11 patients before and after chemotherapy without mogamulizumab. Immune-related gene expression in PBMCs before and after mogamulizumab was also assessed (n = 24). Mogamulizumab treatment resulted in CCR4+ T-cell depletion, and the consequent lymphopenia provoked homeostatic CD8+ T-cell proliferation, as evidenced by increased expressions of CD8B and CD8A, which were significantly greater in patients with skin-related AEs than in those without them. We hypothesize that proliferation is driven by the engagement of self-antigens, including skin-related antigens, in the face of regulatory T-cell depletion. Together with the observed activated antigen presentation function, this resulted in T-cell diversification that was significantly greater in patients with skin-related AEs than in those without. We found that the CD8+ T cells that proliferated and diversified after mogamulizumab treatment were almost entirely newly emerged clones. There was an inverse relationship between the degree of CCR4+ T-cell depletion and increased CD8+ T-cell proliferation and diversification. Thus, lymphocyte-depleting mogamulizumab treatment provokes homeostatic CD8+ T-cell proliferation predominantly of newly emerging clones, some of which could have important roles in the pathogenesis of mogamulizumab-induced skin-related AEs.
Introduction
Adult T-cell leukemia-lymphoma (ATL), which is characterized by frequent expression of CCR4 on tumor cells,1,2 has a very poor prognosis.3-6 Treatment with mogamulizumab, a humanized anti-CCR4 monoclonal antibody,7-9 has clinical efficacy in ATL.10-12 However, skin-related adverse events (AEs) are frequently observed and occasionally severe and, thus, are clinically problematic.10,13-15 Because CCR4 is also highly expressed on effector regulatory T cells (Tregs),16-18 at least some of the mogamulizumab-induced AEs are considered to be associated with depletion of these cells. In this context, we previously reported that mogamulizumab elicits autoantibodies that play an important role in skin-related AEs.14 In that study, we focused on B-cell responses after CCR4+ T-cell depletion by mogamulizumab and analyzed the immunoglobulin M repertoire in peripheral blood mononuclear cells (PBMCs) by next-generation sequencing. On the other hand, we have previously reported a high degree of CD8+ T-cell infiltration into the affected skin lesions on mogamulizumab treatment.10,13,19 Therefore, we have also investigated T-cell responses to fully understand the mechanisms responsible for mogamulizumab-induced skin-related AEs. Treatment with mogamulizumab has now been extended to cutaneous T-cell lymphoma,20,21 and it is expected to be extended to human T-lymphotropic virus 1 (HTLV-1)–associated myelopathy.22 Hence, it is a matter of some urgency to determine the most appropriate treatment for the skin-related AEs caused by mogamulizumab. Accordingly, in this study we analyzed the T-cell receptor (TCR) β chain repertoire and expression of immune-related genes in PBMCs obtained from patients with ATL before and after treatment. In particular, we investigated the degree of change from before to after treatment in the TCR repertoire and gene expression in patients who did or did not develop erythema multiforme (EM).
Methods
Human samples
PBMCs were obtained before and after mogamulizumab treatment from 16 ATL patients suffering from skin-related AEs, all of which were diagnosed as EM, according to the National Cancer Institute Common Terminology Criteria for Adverse Events version 4.0. PBMCs were also obtained before and after treatment from 8 mogamulizumab-treated patients not suffering from EM, as well as from 11 patients who received chemotherapy (modified LSG15 protocol23,24 or cyclophosphamide-doxorubicin-vincristine-prednisolone) without mogamulizumab. All donors provided written informed consent prior to sampling according to the Declaration of Helsinki. The present study was approved by the Institutional Ethics Committees of the Nagoya City University Graduate School of Medical Sciences and Kyowa Kirin Co., Ltd. The details are available in supplemental Methods.
Total RNA extraction
The details are available in supplemental Methods.
TCR repertoire analysis
Deep sequencing was performed on an Ion Personal Genome Machine System using an Ion PGM Template IA 500 Kit and Ion PGM Hi-Q Sequencing Kits (Thermo Fisher Scientific, Waltham, MA). The CDR3 sequence of each read was identified using IgBLAST 1.7.0 by aligning to reference germline sequences of the international ImMunoGeneTics information system.25,26 The Inverse Simpson’s diversity index (ISDI),27,28 in which large numbers denote higher diversity, was calculated using R (R-3.4.3) and its package ‘vegan.’ The change in ISDI was calculated as the ratio of ISDI for the TCRβ repertoire after treatment relative to the same patient’s repertoire before treatment. Details are available in supplemental Methods.
Immune-related gene expression analysis by RNA sequencing
Sequence libraries were constructed with the Oncomine Immune Response Research Assay (Thermo Fisher Scientific), and RNA sequencing was performed using an Ion Proton Sequencer and an Ion PI Hi-Q Sequencing Kit (both from Thermo Fisher Scientific). Details are available in supplemental Methods.
Flow cytometry analysis
Details are available in supplemental Methods.
Statistical analysis
Details are available in supplemental Methods.
Results
TCRβ repertoire in PBMCs from ATL patients
We analyzed the TCRβ repertoire by deep sequencing of CDR3 in PBMCs obtained before and after mogamulizumab treatment from 16 ATL patients suffering from EM (Figure 1A), from 8 mogamulizumab-treated patients not suffering from EM (Figure 1B), and before and after chemotherapy without mogamulizumab from 11 patients not suffering from EM (Figure 1C). Each CDR3 sequence and its frequency are depicted by an individual color and height, respectively, in the bar charts.

TCRβ repertoire analysis in PBMCs by next generation sequencing. TCRβ repertoire before and after mogamulizumab treatment in patients with (n = 16) (A) or without (n = 8) (B) EM, and before and after chemotherapy without mogamulizumab (n = 11) (C). Bar graphs and pie charts in the left and right panels depict the TCRβ repertoire in PBMCs before and after treatment, respectively, in each patient. Each CDR3 sequence and its frequency is shown by individual color and height, respectively, in the bar graph. The blue and red lines on the right side indicate the CDR3 sequences specific to the samples obtained before and after treatment, respectively. The blue, red, and gray slices in the pie charts indicate the frequency of the CDR3 sequences specific to the samples obtained before and after treatment, as well as those detected at both points, respectively. The percentages of the CDR3 sequences specific to the samples obtained before and after treatment are shown as blue and red numbers, respectively, below the pie charts.
TCRβ repertoire analysis in PBMCs by next generation sequencing. TCRβ repertoire before and after mogamulizumab treatment in patients with (n = 16) (A) or without (n = 8) (B) EM, and before and after chemotherapy without mogamulizumab (n = 11) (C). Bar graphs and pie charts in the left and right panels depict the TCRβ repertoire in PBMCs before and after treatment, respectively, in each patient. Each CDR3 sequence and its frequency is shown by individual color and height, respectively, in the bar graph. The blue and red lines on the right side indicate the CDR3 sequences specific to the samples obtained before and after treatment, respectively. The blue, red, and gray slices in the pie charts indicate the frequency of the CDR3 sequences specific to the samples obtained before and after treatment, as well as those detected at both points, respectively. The percentages of the CDR3 sequences specific to the samples obtained before and after treatment are shown as blue and red numbers, respectively, below the pie charts.
TCRβ repertoire in PBMCs before mogamulizumab or chemotherapy
The ISDI for the TCRβ repertoire in PBMCs before mogamulizumab treatment of patients who went on to develop mogamulizumab-induced EM (n = 16) had a mean value of 16.4 and a median value of 4.7 (range, 1.1 to 124.4). In contrast, these values were 43.8, 14.1, and 1.4 to 116.5, respectively, in patients who received mogamulizumab but did not develop EM (n = 8), and they were 20.3, 3.0, and 1.7 to 114.2, respectively, in patients on chemotherapy without mogamulizumab (n = 11). These data did not reveal any significant differences in ISDI for the TCRβ repertoire in patients before mogamulizumab treatment, regardless of whether they went on to suffer from EM (P = .193; supplemental Figure 1A). There also was no significant difference in ISDI between patients before they received mogamulizumab and later developed EM or in patients receiving chemotherapy without mogamulizumab (P = .781; supplemental Figure 1A). Analogously, there were also no significant differences in ISDI between patients before mogamulizumab treatment but who did not develop EM later and those patients receiving only chemotherapy (P = .286; supplemental Figure 1A). The ISDI for the TCRβ repertoire in all pooled ATL patients before mogamulizumab or chemotherapy (n = 35) had a mean of 23.9, a median of 5.3, and a range of 1.1 to 124.4. The values were 291.0, 264.6, and 77.1 to 511.4, respectively, in 6 healthy controls. Thus, ISDIs for the TCRβ repertoire before treatment in patients with ATL were significantly lower than in healthy volunteers (P = .019; supplemental Figure 1A).
Immune-related gene expression in PBMCs from patients before mogamulizumab
Genes with significantly higher expression in PBMCs before mogamulizumab treatment in patients who went on to develop EM (n = 16) relative to those who did not (n = 8) are shown in supplemental Table 1. These included LAG3 (fold change, 4.03; P = 0.015), SITI (fold change, 3.65; P = .008), GAGE12J (fold change, 3.59; P = .025), TCF7 (fold change, 3.49; P = .012), TAGAP (fold change, 2.86; P = .002), and others. Among the 395 immune-related genes tested, none was significantly more highly expressed in patients without subsequent EM relative to those who did develop EM. There also was no significant difference in the expression of CCR4 (mean, 2785.7 vs 1652.8 reads per million mapped reads [RPM]; median, 1794.8 vs 264.4 RPM) (supplemental Figure 1B) or FOXP3 (mean, 3031.4 vs 2264.2 RPM; median, 1626.7 vs 353.4 RPM) (supplemental Figure 1C) before mogamulizumab in patients with or without subsequent EM, respectively.
TCRβ repertoire in PBMCs after mogamulizumab or chemotherapy
Next, we quantified ISDI for the TCRβ repertoire in PBMCs in patients after mogamulizumab treatment and assessed whether differences between patients who developed mogamulizumab-induced EM and those who did not could be discerned. For patients who did suffer from this skin-related AE (n = 16), the mean value was 115.8, the median was 112.5, and the range was 10.4 to 243.6, whereas for the 8 patients who did not, these values were 24.5, 27.1, and 1.8 to 59.5, respectively. For patients who received chemotherapy but no mogamulizumab (n = 11), these values were 95.9, 67.4, and 5.6 to 208.4, respectively. In this instance, the difference in ISDI for the TCRβ repertoire in patients with or without EM achieved statistical significance (P < .001; Figure 2A). It is also interesting to note that the TCRβ repertoire after mogamulizumab in patients without EM was significantly lower than in patients after chemotherapy (P = .008; Figure 2A). There were no significant differences in the TCRβ repertoire in patients with EM after mogamulizumab and after chemotherapy without mogamulizumab (P = .463; Figure 2A).
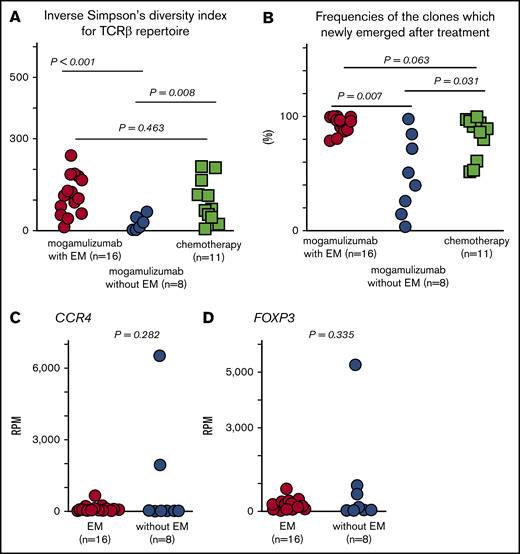
TCRβ repertoire, frequencies of newly emerging T-cell clones, and CCR4 and FOXP3 expression in PBMCs after mogamulizumab or chemotherapy. (A) ISDI for the TCRβ repertoire in PBMCs after mogamulizumab treatment in patients with (n = 16) or without (n = 8) EM, as well as after chemotherapy without mogamulizumab (n = 11). (B) Frequencies of newly emerging T-cell clones after mogamulizumab in patients with (n = 16) or without (n = 8) EM, as well as after chemotherapy (n = 11). CCR4 (C) and FOXP3 (D) expression in PBMCs after mogamulizumab in patients with (n = 16) or without (n = 8) EM.
TCRβ repertoire, frequencies of newly emerging T-cell clones, and CCR4 and FOXP3 expression in PBMCs after mogamulizumab or chemotherapy. (A) ISDI for the TCRβ repertoire in PBMCs after mogamulizumab treatment in patients with (n = 16) or without (n = 8) EM, as well as after chemotherapy without mogamulizumab (n = 11). (B) Frequencies of newly emerging T-cell clones after mogamulizumab in patients with (n = 16) or without (n = 8) EM, as well as after chemotherapy (n = 11). CCR4 (C) and FOXP3 (D) expression in PBMCs after mogamulizumab in patients with (n = 16) or without (n = 8) EM.
The frequencies of newly emerged T-cell clones in PBMCs from patients who developed EM after mogamulizumab treatment (n = 16) were estimated as a mean of 93.4%, a median of 96.0%, and a range of 78.8% to 100.0% of all clones. In contrast, these values in patients who received mogamulizumab but did not suffer from EM (n = 8) were significantly different: 48.2%, 45.0%, and 2.9% to 97.9%, respectively; P = .007 (Figure 2B). Finally, these values were 81.7%, 89.2%, and 51.3% to 99.7% in patients on chemotherapy without mogamulizumab (n = 11). Thus, frequencies of newly emerging T-cell clones after mogamulizumab in patients with EM were significantly higher than in patients without this AE, and there was a trend toward higher frequencies after chemotherapy compared with patients who did not develop EM after mogamulizumab (P = .031; Figure 2B). The frequency of newly emerged clones also tended to be lower after chemotherapy than after mogamulizumab in patients with EM (P = .063; Figure 2B).
Immune-related gene expression in PBMCs after mogamulizumab
Genes that were significantly more highly expressed in PBMCs after mogamulizumab treatment in patients relative to those without EM are shown in Table 1. Genes such as HLA-G (fold change, 3.63; P = .004), HLA-DMB (fold change, 2.91; P = .016), RORC (fold change, 2.35; P = .007), IL-4 (fold change, 2.29; P = .027), NCF1 (fold change, 2.21; P < .001), and others were more highly expressed in patients with EM. Genes with greater expression in patients without EM, including CD2 (fold change, 3.23; P = .031), IFIH1 (fold change, 2.54; P = .040), PTEN (fold change, 2.42; P = .030), CD69 (fold change, 2.15; P = .033), SKAP2 (fold change, 1.67; P = .036), and others, are shown in supplemental Table 2. Again, there were no significant differences in CCR4 expression (mean of 111.7 RPM, median of 71.4 vs 993.0 RPM, and 17.7 RPM; P = .282; Figure 2C) or FOXP3 expression (204.4, 170.5 vs 807.5, and 85.2 RPM, respectively; P = .335; Figure 2D) in PBMCs related to EM after mogamulizumab.
Genes significantly more highly expressed in PBMCs after mogamulizumab treatment in patients with EM relative to those without this skin-related AE
| Gene | With EM, mean (n = 16) | Without EM, mean (n = 8) | All patients, mean (N = 24) | Fold change* | P |
|---|---|---|---|---|---|
| HLA-G | 2.00 | 0.55 | 1.52 | 3.63 | .004 |
| HLA-DMB | 476.82 | 163.61 | 372.42 | 2.91 | .016 |
| RORC | 21.42 | 9.12 | 17.32 | 2.35 | .007 |
| IL-4 | 1.97 | 0.86 | 1.60 | 2.29 | .027 |
| NCF1 | 22 334.37 | 10 101.82 | 18 256.85 | 2.21 | .000 |
| LCK | 71.35 | 33.56 | 58.75 | 2.13 | .010 |
| CXCR3 | 40.33 | 19.60 | 33.42 | 2.06 | .012 |
| IL3RA | 201.29 | 103.55 | 168.71 | 1.94 | .015 |
| CD40LG | 116.39 | 60.03 | 97.60 | 1.94 | .004 |
| PDCD1 | 154.08 | 83.86 | 130.67 | 1.84 | .015 |
| ADORA2A | 471.79 | 265.51 | 403.03 | 1.78 | .001 |
| CXCR6 | 108.23 | 61.13 | 92.53 | 1.77 | .030 |
| CCR1 | 3 147.59 | 1 798.45 | 2 697.87 | 1.75 | .041 |
| VEGFA | 249.29 | 144.04 | 214.21 | 1.73 | .029 |
| CD74 | 11 038.31 | 6 637.35 | 9 571.32 | 1.66 | .001 |
| STAT5A | 2 291.26 | 1 397.54 | 1 993.35 | 1.64 | .000 |
| HLA-DMA | 2 727.14 | 1 688.99 | 2 381.09 | 1.61 | .005 |
| CSF2RB | 3 929.13 | 2 520.22 | 3 459.49 | 1.56 | .036 |
| G6PD | 3 277.55 | 2 124.87 | 2 893.32 | 1.54 | .001 |
| LILRB2 | 7 224.99 | 4 722.22 | 6 390.73 | 1.53 | .046 |
| ITGB2 | 42 326.70 | 28 180.05 | 37 611.15 | 1.50 | .012 |
| IL-15 | 202.46 | 137.13 | 180.69 | 1.48 | .023 |
| HLA-F | 958.87 | 691.52 | 869.75 | 1.39 | .011 |
| BCL2L11 | 825.83 | 634.00 | 761.88 | 1.30 | .019 |
| IRF1 | 8 141.69 | 6 464.31 | 7 582.56 | 1.26 | .047 |
| C10orf54 | 11 103.42 | 8 816.11 | 10 340.99 | 1.26 | .030 |
| TNFRSF14 | 2 359.13 | 1 936.01 | 2 218.09 | 1.22 | .040 |
Gene expression is presented as RPM.
Fold change is indicated as “with EM/without EM.”
Change in ISDI for the TCRβ repertoire in PBMCs resulting from mogamulizumab or chemotherapy
Changes in ISDI for the TCRβ repertoire in PBMCs from patients who developed mogamulizumab-induced EM (n = 16) were 44.0, 15.8, and 0.6 to 182.7 (mean, median, and range, respectively), whereas these values were 2.5, 0.5, and 0.2 to 10.8 in patients who did not develop EM. For patients on chemotherapy without mogamulizumab (n = 11), these values were 27.9, 20.5, and 0.7 to 116.0, respectively. Thus, changes in the TCRβ repertoire in patients with mogamulizumab-induced EM were significantly greater than in patients without this skin-related AE (P = .010; Figure 3A). In the latter group, there was a trend toward lower values relative to patients on chemotherapy (P = .048; Figure 3A). There were no significant differences in the change in ISDI for the TCRβ repertoire in PBMCs between patients with this skin-related AE and those on chemotherapy (P = .379; Figure 3A).

Change in the TCRβ repertoire, as well as CCR4 and FOXP3 expression, in PBMCs resulting from mogamulizumab or chemotherapy. (A) Change in ISDI for the TCRβ repertoire in PBMCs caused by mogamulizumab treatment of patients with (n = 16) or without (n = 8) EM and caused by chemotherapy without mogamulizumab (n = 11). Change in CCR4 (B) and FOXP3 (C) expression in PBMCs caused by mogamulizumab in patients with (n = 16) or without (n = 8) EM.
Change in the TCRβ repertoire, as well as CCR4 and FOXP3 expression, in PBMCs resulting from mogamulizumab or chemotherapy. (A) Change in ISDI for the TCRβ repertoire in PBMCs caused by mogamulizumab treatment of patients with (n = 16) or without (n = 8) EM and caused by chemotherapy without mogamulizumab (n = 11). Change in CCR4 (B) and FOXP3 (C) expression in PBMCs caused by mogamulizumab in patients with (n = 16) or without (n = 8) EM.
Changes in immune-related gene expression in PBMCs resulting from mogamulizumab
Changes in gene expression in PBMCs resulting from mogamulizumab treatment that were significantly greater in patients with EM (n = 16) compared with those without EM (n = 8) are shown in Table 2. These included genes such as HLA-G (fold change, 22.20; P = .020), TNFRSF17 (fold change, 8.66; P = .029), CD8B (fold change, 8.60; P = .009), GZMK (fold change, 7.63; P = .037), and CD40LG (fold change, 6.74; P = .018). Changes in gene expression that were significantly greater in patients without EM are shown in supplemental Table 3. These included IL-7 (fold change, 4.92; P = .030), HERC6 (fold change, 4.36; P = .014), TAGAP (fold change, 4.30; P = .009), IFIH1 (fold change, 3.00; P = .013), DDX58 (fold change, 2.70; P = .006), and others. There was no significant difference in the change in CCR4 expression in PBMCs between patients with or without mogamulizumab-induced EM (mean, 8.3 × 10⁻²; median, 5.4 × 10⁻² vs mean, 2.8 × 10⁻¹; median, 1.7 × 10⁻¹; P = .192, Figure 3B). There was also no significant difference in the change in FOXP3 expression between the 2 groups (mean, 2.4 × 10⁻¹ RPM; median, 7.3 × 10⁻² RPMvs mean, 1.8 × 10⁻¹ RPM, median, 3.2 × 10⁻¹; P = .296; Figure 3C).
Changes in gene expression in PBMCs that was significantly greater in patients with EM than in those without EM resulting from mogamulizumab treatment
| Gene | With EM, mean (n = 16) | Without EM, mean (n = 8) | All patients, mean (N = 24) | Fold change* | P |
|---|---|---|---|---|---|
| HLA-G | 2.19 | 0.10 | 1.49 | 22.20 | .020 |
| TNFRSF17 | 56.87 | 6.57 | 40.10 | 8.66 | .029 |
| CD8B | 13.90 | 1.62 | 9.81 | 8.60 | .009 |
| GZMK | 10.46 | 1.37 | 7.43 | 7.63 | .037 |
| CD40LG | 5.38 | 0.80 | 3.85 | 6.74 | .018 |
| LRG1 | 8.61 | 1.47 | 6.23 | 5.84 | .045 |
| JCHAIN | 27.59 | 5.07 | 20.08 | 5.44 | .036 |
| CD8A | 9.96 | 2.08 | 7.34 | 4.79 | .027 |
| IDO2 | 3.70 | 0.84 | 2.75 | 4.43 | .021 |
| IL4 | 3.54 | 1.02 | 2.70 | 3.47 | .026 |
| CDKN3 | 3.38 | 1.13 | 2.63 | 2.99 | .035 |
| CCL4 | 3.95 | 1.43 | 3.11 | 2.76 | .039 |
| GZMA | 5.02 | 1.82 | 3.95 | 2.76 | .025 |
| BCL2 | 1.66 | 0.60 | 1.31 | 2.76 | .011 |
| ITGAX | 3.43 | 1.36 | 2.74 | 2.52 | .007 |
| NCF1 | 6.18 | 2.55 | 4.97 | 2.43 | .017 |
| BCL6 | 2.65 | 1.10 | 2.13 | 2.40 | .017 |
| ITGB2 | 2.21 | 0.96 | 1.79 | 2.30 | .007 |
| LILRB2 | 3.97 | 1.78 | 3.24 | 2.23 | .037 |
| STAT4 | 2.59 | 1.29 | 2.15 | 2.01 | .033 |
| NCAM1 | 3.17 | 1.59 | 2.64 | 1.99 | .041 |
| CD83 | 1.25 | 0.63 | 1.05 | 1.98 | .041 |
| HLA-DMA | 2.35 | 1.25 | 1.98 | 1.88 | .015 |
| G6PD | 2.06 | 1.16 | 1.76 | 1.78 | .001 |
| BCL2L11 | 1.79 | 1.02 | 1.53 | 1.75 | .021 |
| CD74 | 1.91 | 1.11 | 1.64 | 1.71 | .050 |
| C10orf54 | 1.38 | 0.88 | 1.21 | 1.57 | .024 |
| STAT5A | 1.27 | 0.83 | 1.12 | 1.53 | .042 |
Fold change is indicated as “with EM/without EM.”
Correlations between changes in ISDI for the TCRβ repertoire and changes in immune-related gene expression in PBMCs resulting from mogamulizumab
We next sought to identify correlations between changes in ISDI for the TCRβ repertoire and changes in gene expression in the top 8 genes that were significantly greater in patients with EM compared with those without EM (Table 2). We found significant positive correlations between the changed TCRβ repertoire and changes in HLA-G (Spearman rank correlation coefficient [rs], +0.422; P = .040), CD8B (rs, +0.803; P < .001), GZMK (rs, +0.668; P < .001), CD40LG (rs, +0.756; P < .001), and CD8A (rs, +0.719; P < .001) in all patients receiving mogamulizumab (n = 24) (Figure 4), regardless of EM. Among those patients with EM (n = 16), there were additional significant positive correlations between the changed TCRβ repertoire and CD8B (rs, +0.685; P = .004), GZMK (rs, +0.529; P = .037), CD40LG (rs, +0.618; P = .013), and CD8A (rs, +0.585; P = .019) but not HLA-G (rs, +0.015; P = .957). With respect to the remaining 3 genes in pooled patients receiving mogamulizumab (n = 24), the rs between changed TCRβ repertoires and TNFRSF17 was +0.350 (P = .094), and it was +0.037 (P = .865) for LRG1 and +0.368 (P = .077) for JCHAIN (Figure 4). For CD4, CCR4, and FOXP3, the rs values were −0.559 (P = .005), −0.478 (P = .019), and −0.263 (P = .213), respectively, in all patients receiving mogamulizumab (n = 24) (Figure 4).

Correlations between the change in ISDI for the TCRβ repertoire and changes in immune-related gene expression in PBMCs resulting from mogamulizumab. The change in ISDI for the TCRβ repertoire is plotted on the x-axis, and the change in expression of each immune-related gene is shown on the y-axis. Blue circles indicate patients without EM, and red circles represent those with EM. HLA-G: rs, +0.422; P = .040; TNFRSF17: rs, +0.350; P = .094; CD8B: rs, +0.803; P < .001; GZMK: rs, +0.668; P < .001; CD40LG: rs, +0.756; P < .001; LRG1: rs, +0.037; P = .866; JCHAIN: rs, +0.368; P = .078; CD8A: rs, +0.719, P < .001; CD4: rs, −0.559; P = .005; CCR4: rs, −0.478; P = .019; and FOXP3: rs, −0.263; P = .213.
Correlations between the change in ISDI for the TCRβ repertoire and changes in immune-related gene expression in PBMCs resulting from mogamulizumab. The change in ISDI for the TCRβ repertoire is plotted on the x-axis, and the change in expression of each immune-related gene is shown on the y-axis. Blue circles indicate patients without EM, and red circles represent those with EM. HLA-G: rs, +0.422; P = .040; TNFRSF17: rs, +0.350; P = .094; CD8B: rs, +0.803; P < .001; GZMK: rs, +0.668; P < .001; CD40LG: rs, +0.756; P < .001; LRG1: rs, +0.037; P = .866; JCHAIN: rs, +0.368; P = .078; CD8A: rs, +0.719, P < .001; CD4: rs, −0.559; P = .005; CCR4: rs, −0.478; P = .019; and FOXP3: rs, −0.263; P = .213.
Changes in lymphocyte populations in PBMCs resulting from mogamulizumab
The changes in CD3+CD8+ T cells in PBMCs from patients with EM (n = 12) were 28.2, 15.0, and 1.5 to 129.3 (mean, median, and range, respectively), and in those without EM (n = 6) they were 1.5, 1.5, and 0.3 to 3.2, respectively, resulting from mogamulizumab treatment. For CD19+CD2− B cells in patients with EM (n = 12), these values were 3.9, 0.5, and 0.2 × 10⁻¹ to 37.8, whereas in patients without EM (n = 6) they were 15.8, 3.1, and 0.1 to 44.0. Changes in CD4+ T cells in PBMCs from patients with EM (n = 12) were 0.4, 0.4, and 0.1 to 0.7, whereas in those without EM (n = 6), they were 0.6, 0.5, and 0.3 to 1.0. Flow cytometry of PBMCs before and after mogamulizumab in 3 patients with EM and 3 patients without EM are shown in supplemental Figure 2A-C and supplemental Figure 2D-F, respectively. The change in CD3+CD8+ T cells in patients with EM was significantly greater than in patients without EM (P = .004; supplemental Figure 2G). On the other hand, there were no significant differences in the changes in CD19+CD2− B cells (P = .075) or CD4+ T cells (P = .092) between patients with or without EM.
Discussion
The present study demonstrated that treatment with lymphocyte-depleting mogamulizumab provokes homeostatic CD8+ T-cell proliferation,29-31 as evidenced by the increased expression of CD8B and CD8A in PBMCs, and T-cell diversification, as evidenced by an increased ISDI for the TCRβ repertoire in PBMCs. Some of these proliferating CD8+ T cells may play an important role in the skin-related AEs observed in ATL patients treated with this antibody.
We did not identify any clear trend toward T-cell diversity in PBMCs before mogamulizumab treatment with the subsequent occurrence of EM. Based on expression of CCR4 or FOXP3 genes, the number of ATL cells in PBMCs before mogamulizumab treatment also did not seem to be associated with the later occurrence of EM.1,7,32 In this context, the level of Tregs16-18,33 before mogamulizumab treatment also did not seem to be associated with subsequent EM. Of note, T-cell diversity in these ATL patients before treatment was more skewed than in healthy volunteers. This was to be expected, because ATL is a peripheral T-cell neoplasm.
Peripheral T cells after mogamulizumab treatment from patients who were developing EM were more diversified than those from patients without this AE. This T-cell diversification is reminiscent of earlier reports of immune-related AEs caused by CTLA-4 blockade.34,35 In addition, most of the T-cell clones were newly emerged at the time of the development of EM, and their frequencies were significantly higher than in patients who did not suffer from this AE. These findings indicate that preexisting HTLV-1–infected ATL tumor cells were not primarily responsible for the T-cell diversification seen at the time of EM development after mogamulizumab treatment. In fact, the HTLV-1 provirus load in PBMCs in patients developing EM after mogamulizumab (n = 16) was very low, estimated at a mean of 9.2, a median of 1.7, and range of 0.2 to 49.2 copies per 1000 PBMCs. For patients without EM (n = 8), these values were also low (mean, 186.1; median, 7.4; range, 0.6 to 728.7), and there was no significant difference in the HTLV-1 provirus load in PBMCs after mogamulizumab between patients developing EM or not (P = .125). In this context, also based on gene expression data for CCR4 or FOXP3, the amount of ATL cells in PBMCs after mogamulizumab did not seem to be associated with EM development, suggesting that clinical responses to mogamulizumab in ATL were not critical for the occurrence of this AE. Here also, the level of Tregs after mogamulizumab treatment did not seem to be associated with EM. However, at the level of gene expression, HLA-DMB, HLA-DMA, and CD74 (associated with antigen presentation), IL-15 (mediating T-cell proliferation and survival), STAT5A (required for BCL2 induction by interleukin-15 and to maintain effector CD8+ T cells),36 and BCL2L11 (antiapoptotic) were more prevalent in patients with EM compared with those without EM after mogamulizumab treatment.
The changes in T-cell diversity caused by mogamulizumab treatment (ie, the change in ISDI for the TCRβ repertoire) were more obvious in patients with EM than in those without. This is a significant novel observation in the present study, even considering the earlier study,37 in which TCRα repertoire analyses were performed on 7 ATL patients. On the other hand, the degree of depletion of ATL tumor cells did not seem to be associated with the development of EM. Again, these findings suggest that clinical responses to mogamulizumab in ATL patients were not related to the occurrence of EM. Similarly, but perhaps less expectedly, the degree of Treg depletion also did not seem to be associated with EM. The predominant changes in CD8B and CD8A expression, as well as of GZMK and GZMA (encoding cytotoxic enzymes released by CD8+ T cells), were seen in patients treated with mogamulizumab who developed EM. Consistent with this, predominant changes in CD3+CD8+ T cells in PBMCs determined by surface phenotyping were also seen in the patients who developed EM (n = 12) compared with those without EM (n = 6). Additionally, changes in CD8B (rs, 0.860; P < .001) and CD8A (rs, 0.831; P < .001) by RNA sequencing also correlated well with the changes in CD3+CD8+ T cells by flow cytometry in 18 patients receiving mogamulizumab. Furthermore, the changes in CD8B, CD8A, GZMK, and GZMA (rs, 0.669; P < .001) all correlated well with T-cell diversity changes in all 24 pooled patients receiving mogamulizumab. Importantly, even in the patients with EM (n = 16), changes in CD8B, CD8A, GZMK, and GZMA (rs, 0.515; P = .044) also correlated well with T-cell diversity changes. These findings suggest that proliferation of newly emergent CD8+ T-cell clones was responsible for the increased T-cell diversity in patients receiving mogamulizumab, as well as in the patients with EM. Finally, the changes in CD83 (expressed by mature dendritic cells),38 HLA-DMA, CD74, BCL2, BCL2L11, and STAT5A were more obvious in patients with EM than in those without.
Mogamulizumab treatment depleted CCR4+ T cells, as evidenced by the changes in CD4 and CCR4 expression (mean, 7.2 × 10⁻¹ RPM; median, 5.5 × 10⁻¹ RPM and mean, 1.5 × 10⁻¹ RPM; median, 5.8 × 10⁻² RPM, respectively), documenting that this agent caused T-cell lymphopenia. We have previously reported that this occurred in 26 (96%) of the 27 patients receiving mogamulizumab, of which 6 lymphopenias were grade 2, 9 were grade 3, and the remaining 11 were grade 4 (according to the National Cancer Institute Common Terminology Criteria for Adverse Events version 3.0).10 In addition, changes in CD4 and CCR4 expression were inversely correlated with changes in the T-cell diversity index in the patients receiving mogamulizumab. These results indicate that a greater degree of CD4+ and CCR4+ T-cell depletion correlated with increased T-cell diversity after mogamulizumab treatment.
Importantly, ISDI in patients with EM after mogamulizumab treatment was not significantly different from ISDI in patients on chemotherapy. In addition, the changes in ISDI caused by mogamulizumab in patients with EM were not significantly different from those in patients on chemotherapy. Nevertheless, patients on chemotherapy certainly did not suffer from EM. These findings could be explained by the fact that chemotherapy usually does not lead to selective and prolonged Treg depletion, which would thus remain present to prevent self-reactive T-cell proliferation.39,40
Taken together, these findings suggest that, after treatment with the lymphocyte-depleting agent mogamulizumab, which is especially efficacious at depleting CCR4+ T cells, homeostatic CD8+ T-cell proliferation occurs, but Tregs do not expand, probably because of the residual mogamulizumab. We hypothesize that CD8+ T-cell proliferation is driven by the engagement of self-antigens, including skin-related antigens, that is facilitated by prolonged Treg depletion39,40 and enhanced by the observed activation of antigen presentation, resulting in T-cell diversification. Importantly, the more T cells are diversified, the greater the chance of the emergence of self-reactive T cells. At the time of EM occurrence, the proliferating T-cell population consisted almost entirely of newly emerged T-cell clones. Subsequently, certain CD8+ T cells, which acquire an ability to react to self skin tissue, presumably migrate to the skin and damage it by releasing GZMK and GZMA. These lesions would be recognized histologically as having a high degree of CD8+ T-cell infiltration into the affected areas after mogamulizumab.10,13,19
The changes in IL-7 expression were greater in patients without EM than in those with EM. Blood interleukin-7 levels are known to be inversely correlated with lymphocyte counts41,42 ; therefore, production of this cytokine in PBMCs should be suppressed more strongly after CD8+ T-cell proliferation in patients with EM. CD69 expression after mogamulizumab was higher in the patients without EM than in those with EM. This is consistent with a report that homeostatically proliferating T cells downregulate CD69 expression.43
After mogamulizumab, expression of CD40LG, which is produced by T cells and stimulates B cells,44 was higher in the patients with EM than in those without. Additionally, changes in TNFRSF17 and JCHAIN, which are related to B-cell differentiation, as well as in CD40LG, were more obvious in patients with EM. Collectively, these data show that after treatment with mogamulizumab, B cells were activated and differentiated, consistent with our previous study. This could well lead to the production of autoantibodies that attack the skin.14
Among the genes that are expressed more highly before mogamulizumab in PBMCs of patients who went on to develop EM, TAGAP may be particularly relevant, because it is required for T helper 17 (Th17) cell differentiation.45 Consistent with this, RORC expression after mogamulizumab treatment was higher in patients with EM than in those without.46 Furthermore, the increase in LRG1, which promotes naive CD4+ T-cell differentiation toward Th17 cells,47 was greater in patients with EM. These results suggest that Th17 cells play an important role in the development of this skin AE. HLA-G expression after mogamulizumab and the increased change in HLA-G and IDO2 were also significantly greater in patients with EM. These molecules may be feeding back in a suppressive manner.
The immunological status of PBMCs in mogamulizumab-induced EM, as envisaged from our present study, is summarized in Figure 5. This study has demonstrated that mogamulizumab depletes CCR4+ T cells and provokes robust homeostatic CD8+ T-cell proliferation and diversification. Most of the proliferating T cells were newly detected at the onset of skin-related AEs, and it is proposed that at least some of them have important roles in the pathogenesis of such mogamulizumab-induced AEs. CD8+ T-cell proliferation is most likely enhanced by Treg depletion by the antibody. It will be important to identify the target molecules that are recognized by these proliferating CD8+ T cells, which will contribute to a better understanding of these side effects. Furthermore, if we could guide the proliferation of CD8+ T cells specific for tumor-related antigens, this would lead to a marked enhancement of the antitumor activity of mogamulizumab. Further investigations regarding the AEs associated with Treg depletion are warranted.
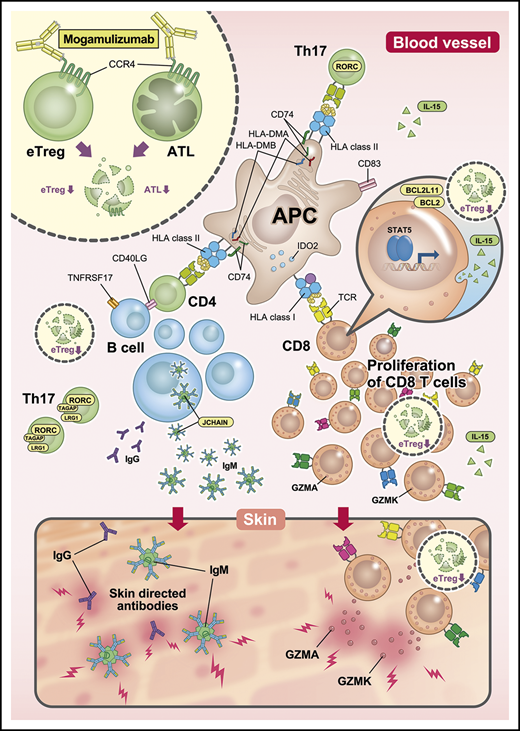
Immunological status in PBMCs from patients with mogamulizumab-induced EM. After treatment with lymphocyte-depleting mogamulizumab, robust homeostatic CD8+ T-cell proliferation occurs, which is driven by the engagement of self-antigens, including skin-related antigens, together with prolonged Treg depletion. This is enhanced by the observed activation of antigen presentation and accompanied by diversification of the TCR repertoire. This proliferation and diversification are primarily the result of newly emergent T-cell clone proliferation at the time of EM development. Subsequently, certain CD8+ T cells migrate to the skin and attack it by releasing GZMK and GZMA. Additionally, Th17 cells play an important role in EM, and B cells are activated and differentiate, leading to the production of autoantibodies that attack the skin. APC, antigen-presenting cell; eTreg, effector regulatory T cells; IgG, immunoglobulin G; IgM, immunoglobulin M.
Immunological status in PBMCs from patients with mogamulizumab-induced EM. After treatment with lymphocyte-depleting mogamulizumab, robust homeostatic CD8+ T-cell proliferation occurs, which is driven by the engagement of self-antigens, including skin-related antigens, together with prolonged Treg depletion. This is enhanced by the observed activation of antigen presentation and accompanied by diversification of the TCR repertoire. This proliferation and diversification are primarily the result of newly emergent T-cell clone proliferation at the time of EM development. Subsequently, certain CD8+ T cells migrate to the skin and attack it by releasing GZMK and GZMA. Additionally, Th17 cells play an important role in EM, and B cells are activated and differentiate, leading to the production of autoantibodies that attack the skin. APC, antigen-presenting cell; eTreg, effector regulatory T cells; IgG, immunoglobulin G; IgM, immunoglobulin M.
Acknowledgments
The authors thank Ryuzo Ueda (Aichi Medical University School of Medicine) for valuable advice, Chiori Fukuyama for excellent technical assistance, Naomi Ochiai for expert secretarial assistance, and Kimihide Nagata (Medical Education Inc., Tokyo, Japan) for assistance with Figure 5.
This work was supported by Kyowa Kirin Co., Ltd., as well as by a grant-in-aid for scientific research (B) from the Ministry of Education, Culture, Sports, Science and Technology (No. 16H04713) (T. Ishida) and the Japan Agency for Medical Research and Development (No. 19cm0106301h0001) (T. Ishida).
Authorship
Contribution: M.S., T. Ishii, and T. Ishida designed the research; M.S., T. Ishii, I.U., A. Matsumoto, A. Masaki, A.I., S.K., S.S., T.T., and T. Ishida performed experiments; M.S., T. Ishii, T.T., A. Morita, H.I., S.I., and T. Ishida analyzed and interpreted data; and all authors wrote and approved the manuscript.
Conflict-of-interest disclosure: M.S. is an employee of and stockholder in Kyowa Kirin Co., Ltd. T. Ishii, I.U., and Asuka Matsumoto are employees of Kyowa Kirin Co., Ltd. S.K. has received research funding and honoraria from Chugai Pharmaceutical Co., Ltd. and has received research funding from Kyowa Kirin Co., Ltd. T.T. is an employee of Kyowa Kirin Co., Ltd. S.I. has received research funding from Kyowa Kirin, Chugai Pharmaceutical Co., Ltd., Takeda, Ono Pharmaceutical, Janssen Pharmaceuticals, Sanofi, Bristol-Myers Squibb, MSD, Celgene, Daiichi Sankyo, Gilead Sciences, and AbbVie and has received honoraria from Janssen Pharmaceuticals, Celgene, Takeda, Daiichi Sankyo, Ono Pharmaceutical, and Bristol-Myers Squibb. T. Ishida has received research funding from Kyowa Kirin Co., Ltd., Bayer AG, and Celgene K.K. and has honoraria from Kyowa Kirin Co., Ltd., Celgene K.K., and Mundipharma K.K. The remaining authors declare no competing financial interests.
Correspondence: Takashi Ishida, Department of Immunology, Nagoya University Graduate School of Medicine, 65 Tsurumai-cho, Showa-ku, Nagoya, Aichi 466-8560, Japan; e-mail: itakashi@med.nagoya-u.ac.jp.

