

Key Points
NK cells in MM patients are increased and the CD94lowCD56dim subset is activated and proliferating on recognition of MM cells.
Identifying NK cell subset competent in vivo against MM cells can lead to more effective NK cell-based strategies for the management of MM.

Abstract
Natural killer (NK) cells represent innate effector cells potentially able to play a role during the immune response against multiple myeloma (MM). To better define the distribution and the specific properties of NK cell subsets during MM disease, we analyzed their features in the bone marrow and peripheral blood of newly diagnosed MM patients. Our findings revealed that, in both compartments, NK cells were more abundant than in healthy donors. Among total MM-NK cells, a significant increase of CD94lowCD56dim NK cell subset was observed, which already appears in clinical precursor conditions leading to MM, namely monoclonal gammopathy of undetermined significance and smoldering MM, and eventually accumulates with disease progression. Moreover, a consistent fraction of CD94lowCD56dim NK cells was in a proliferation phase. When analyzed for their killing abilities, they represented the main cytotoxic NK cell subset against autologous MM cells. In vitro, MM cells could rapidly induce the expansion of the CD94lowCD56dim NK cell subset, thus reminiscent of that observed in MM patients. Mechanistically, this accumulation relied on cell to cell contacts between MM and NK cells and required both activation via DNAM-1 and homophilic interaction with CD56 expressed on MM cells. Considering the growing variety of combination treatments aimed at enhancing NK cell-mediated cytotoxicity against MM, these results may also be informative for optimizing current immunotherapeutic approaches.
Introduction
Multiple myeloma (MM) is a hematologic neoplasm characterized by a monoclonal expansion of malignant plasma cells within the bone marrow (BM), often accompanied by osteolytic bone lesions and modifications of normal immune responses.1 MM arises consistently from asymptomatic precursor conditions, specifically monoclonal gammopathy of undetermined significance (MGUS) and smoldering MM (sMM), with a cumulative risk of overall progression of 1% and 10% per year, respectively.2,3 MM evolves from these premalignant disorders via progressive molecular events that lead to altered plasma cell surface protein expression, such as loss or decrease of CD45 molecules, aberrant expression of neural cell adhesion molecule (NCAM-1/CD56),4 and abnormal proliferation upon interactions with BM microenvironment.5
Natural killer (NK) cells are innate lymphocytes involved in the initiation, enhancement, and regulation of antitumor immune response and in the control of viral infection spreading. NK cells express a wide range of activating and inhibitory receptors, as well as adhesion and costimulatory molecules, allowing them to recognize and kill infected or transformed cells,6,7 whereas they are prevented from attacking normal tissues by the interaction between major histocompatibility complex (MHC) class I molecules and MHC class I-specific inhibitory receptors.
Therefore, in the absence or downregulation of MHC class I expression, for example, on tumor cells or virus-infected cells, engagement of the activating receptors on NK cells by the corresponding ligands triggers target cell killing.
NK cells are usually distinguished in 2 main subsets CD56bright and CD56dim NK cells, which represent sequential stages of maturation8 and show a dichotomy in phenotypic and functional properties.9 CD56dim NK cells account for ∼90% of the population in peripheral blood (PB) and are capable of potent cytotoxicity. CD56bright NK cells, on the other hand, are poor mediators of direct cytotoxicity but are competent for cytokine production and, primarily, reside in secondary lymphoid tissue and other solid tissues.10
Despite some common features, several NK cell subsets with specialized functions have been described in human and mice by using different markers.11 The progression of CD56bright toward the more differentiated CD56dim NK cells can be identified on the basis of the progressive downregulation of CD94,12 CD62L and the expression of KIRs and CD16, whereas CD57 expression is acquired at later stages and marks terminally differentiated cells.13-15 Among these markers, CD94 is of particular interest because it is useful to distinguish functionally distinct subsets in both human and mouse. CD94 is a type II integral membrane protein that is related to the C-type lectin superfamily and can covalently associate with NKG2A/C. In human, the natural ligand for these CD94/NKG2A-C heterodimers is the nonclassic MHC class I molecule HLA-E. The level of CD94 expression can segregate human NK cells into 3 distinct subsets and defines phenotypic and functional intermediaries existing between CD56bright and CD56dimCD57+ NK cell subsets.12,13
The anti-MM potential of NK cells has been of rising interest in recent years. Although it has been reported that NK cell recognition and killing of MM cells mainly involve the activating receptors DNAM-1, NKG2D, and/or NKp46, the presence of high levels of both classical HLA class I and HLA-E on MM cells can efficiently provide inhibitory signaling, mediated by KIRs and CD94/NKG2A, respectively, therefore representing an important stumbling block for NK cell activity against autologous MM cells.16,17
In the current study, we observed in MM patients a definite expansion of CD56dim NK cells expressing low levels of CD94 and displaying strong cytotoxic properties against autologous MM cells. Interestingly, the mechanism underlying the proliferation of this NK cell subset also relies on the homophilic interaction with CD56 expressed on MM cells.
Materials and methods
Patients’ recruitment
PB and BM samples were obtained from a cohort of 23 newly diagnosed, untreated, MM patients (Table 1). Additional PB and BM samples were also collected from patients with MGUS (8 PB and 4 BM samples) and sMM (5 PB and 3 BM samples). All the patients were admitted at the Hematology Unit of University Hospital Policlinico G. Martino, Messina. The study was approved by the institutional ethics committees and all participants gave written informed consent according to the Declaration of Helsinki.
Patient’s baseline characteristics and CD56 expression on BM-MM cells
| Patient no. | Age, y/sex | Clinical stage (ISS) | Monoclonal Ig | % PCs in BM | CD56 expression on MM cells |
|---|---|---|---|---|---|
| 1 | 60/M | III | IgG κ | 50 | ++ |
| 2 | 65/M | I | IgG κ | 28 | ++ |
| 3 | 59/M | III | IgG κ | 60 | ++ |
| 4 | 60/F | I | IgG κ | 60 | + |
| 5 | 65/F | III | IgA κ | 50 | + |
| 6 | 67/F | III | IgG κ | 40 | ++ |
| 7 | 62/F | II | IgG κ | 70 | + |
| 8 | 60/M | III | IgG κ | 70 | ++ |
| 9 | 54/F | I | IgG κ | 35 | ++ |
| 10 | 65/M | I | IgG κ | 50 | ++ |
| 11 | 60/F | II | IgG κ | 30 | ++ |
| 12 | 62/M | II | IgA κ | 35 | ++ |
| 13 | 58/F | I | IgG λ | 60 | + |
| 14 | 65/M | II | IgG κ | 50 | ++ |
| 15 | 70/M | I | IgG κ | 40 | ++ |
| 16 | 62/F | III | IgA κ | 50 | ++ |
| 17 | 65/F | III | IgG λ | 40 | ++ |
| 18 | 63/F | II | IgA κ | 45 | ++ |
| 19 | 64/M | III | IgG λ | 38 | ++ |
| 20 | 60/F | III | IgG λ | 80 | + |
| 21 | 61/F | III | IgG λ | 38 | ++ |
| 22 | 65/M | III | IgG κ | 30 | + |
| 23 | 63/F | II | IgG λ | 35 | + |
Cell purification and isolation
Peripheral blood mononuclear cells (PBMCs), as well as bone marrow mononuclear cells (BMMCs), were isolated by Ficoll Hypaque density gradient centrifugation from heparinized PB and BM samples (30 minutes, 25°C, 400g). To isolate MM cells (which reside in BM and hardly circulate in PB), BMMCs from MM patients were stained with anti-CD38 PerCp-Cy5.5 (clone HIT2) and anti-CD138 PE (clone M115) monoclonal antibodies (mAbs) and then underwent fluorescence-activated cell sorting (FACS) by gating on CD38highCD138+cells.
To isolate NK cells, PBMCs from MM patients and/or healthy donors (HDs) were stained with anti-CD56 APC-Vio770 (clone REA196) and anti-CD3 Vioblue (clone BW264/56) and then underwent FACS by gating on CD56+ CD3− cells. In selected experiments, NKp46 has been used as additional marker to identify, count, and/or sort NK cells. The gating strategy to identify and/or sort both NK cells and plasma cells in the BM is shown in supplemental Figure 1. Alternatively, human NK cells were previously isolated by negative magnetic separation (NK Cell Isolation Kit/Miltenyi). Cell populations sorted either by negative magnetic separation or by flow cytometry displayed purity >95%.
Multicolor flow cytometry
To investigate the phenotype of NK cells in MM patients, PBMCs or BMMCs were stained with the following mAbs: anti-CD94 FITC (clone HP3D9), anti-CD57 PE (clone NKI), anti-CD16 PeCy5.5 (clone 3G8), anti-CD19 APC-R700 (clone HIB19), anti-CD62L PE (clone SK11), anti-CD69 PeCF594 (clone FN50), anti-HLA-DR APC-H7 (clone L243), anti-NKp46 APC (clone 9E2), anti-NKp44 Alexa Fluor 647 (clone p44-8), anti-CD38 PerCp Cy5.5 (clone HIT2), and anti-CD138 PE (clone M115) purchased from BD Biosciences; anti-CD56 APC-Vio770 (clone REA196), anti-CD3 Vioblue (clone BW264/56), anti-CD45 Viogreen (clone 5B1), anti-NKp30 PE (clone AF29-4D12), anti-NKG2D PE-Vio770 (clone BAT221), anti-NKG2A APC (clone REA110), anti-CD158a/h PE (KIR2DL1/DS1) (clone 11PB6), and anti-CD158b PE (KIR2DL2/DL3/DS1) (clone DX27) from Miltenyi; and anti-CD56 PC7 (clone N901 and clone NKH-1) and anti-CD3 ECD (clone UCHT1) from Beckman Coulter. For surface markers, cells were stained for 30 minutes at 4°C. For indirect labeling, the following mAbs were used: anti-HLA class I (clone A6-136, and clone W632), anti-CD56 (clone A6-220), anti-DNAM-1 (clone F5), anti-NKp46 (clone KL247), anti-NKp30 (clone F252), anti-NKG2D (clone BAT221), and anti-LIR/LT2 (clone F278). All the antibodies used for indirect labeling were produced in our laboratory or kindly provided by Alessandro Moretta (University of Genoa). For indirect labeling, cells were first incubated with the primary antibody for 30 minutes at 4°C. After incubation, cells were extensively washed and incubated with isotype-specific fluorochrome-conjugated secondary antibody for 30 minutes in the dark. NK cell proliferation was assessed by the expression of the intranuclear marker Ki67, performing fixation/permeabilization procedures according to the manufacturer’s protocol (eBioscience) followed by staining with an anti-Ki67-BV421 mAb (clone B56) purchased from BD Biosciences. Dead cells were excluded by staining with LIVE/DEAD FIXABLE Aqua Dead dye (Invitrogen). Sample acquisition was performed on FACSCantoII (BD Biosciences) or Gallios (Beckman Coulter) flow cytometers. Data were analyzed by FACSDiva (BD Biosciences) or FlowJoVX (Tree Star Inc) software.
Cell lines
The human MM cell lines U266B1 and MM1S were kindly provided by F. Cimino (University of Messina), whereas K562 (chronic myelogenous leukemia) and 721.221 (B-lymphoblastoid cell line) were provided by M. C. Mingari. All these cell lines were maintained in RPMI 1640 with 10% fetal bovine serum and supplemented with penicillin (100 U/mL), streptomycin (100 μg/mL).
To assess the relevance of NCAM-1 (CD56) in the interaction between NK cells and tumor cells, the K562 cell line was transfected with the expression construct pCDNA3.1/V5/His-TOPO-NCAM-1 containing the complementary DNA (cDNA) coding for NCAM-1 (NM_181351), using Lipofectamine 2000 (Thermo Fisher) following the manufacturer’s instructions. After 72 hours, NCAM-1 expression was analyzed by flow cytometry using anti-CD56 PC7 mAb. Transfected cells were cultured in the presence of 1.2 mg/mL G418 (Calbiochem) to obtain stable transfectants. At the end of the selection period, cells were sorted based on NCAM-1 expression, and subcloned by limiting dilution.
NK/MM cocultures
To assess accumulation and proliferation of CD94low CD56dim NK cell subset, NK cells isolated from HDs were plated at 1 × 10⁵/well in 96-well V-bottom plates, with or without primary MM cells (ie, freshly isolated from patients’ BM) or MM cell lines (U266B1, MM1S), 721.221 lymphoblastoid cell line, K562 erythroleukemia cell line, at NK cell to target cell (E:T) ratio of 1 to 1, for 24 hours. In selected experiments, cocultures were preceded by incubation of cells (either effector or target cells) with blocking mAbs against NKp46 (immunoglobulin M [IgM], clone KL247), NKp30 (IgM, clone F252), NKG2D (IgG1, clone BAT221), DNAM-1 (IgM, clone F5), CD56 (IgM, clone A6-220) (kindly provided by A. Moretta), or isotype matched controls.
To assess NK cell cytolytic potential and interferon-γ (IFN-γ) production, CD107a degranulation assay and intracellular IFN-γ staining were performed by coincubating NK cells isolated from both HDs and MM patients, with primary MM cells or U266B1 cell line or K562. In selected experiments, cocultures were preceded by incubation of target cells with HLA class I (IgM, clone A6-136) blocking mAb. Cocultures were performed, at an E:T ratio of 1:1, in the presence of anti-CD107a APC (BD Biosciences). After 1 hour, Golgi Stop (1:1500 dilution, BD Biosciences) was added, and cultures were incubated for an additional 5 hours. Upon surface staining, cells were fixed and permeabilized (Cytofix/Cytoperm Kit, BD Biosciences) according to the manufacturer’s protocol and incubated with anti-IFN-γ PE-conjugated mAb (BD Biosciences) for 30 minutes at 4°C. Surface CD107a and intracellular IFN-γ expression were finally assessed by flow cytometry on effector cells. To detect spontaneous degranulation and constitutive expression of cytokine, NK cells incubated without target cells were analyzed as control.
To assess the killing capacity of HDs- and MM-NK cells we performed a flow cytometric and non-radioactive target-based assay. In this assay, NK cells isolated from both HDs and MM patients were coincubated at an E:T ratio of 1:1 with a target tumor cell line (K562 or U266B1). The target cells were prelabeled with a red fluorescent dye PKH-26 (Sigma-Aldrich), according to the manufacturer’s instructions, to allow their discrimination from the effector cells (NK cells). After short-term in vitro incubation (3 hours), killed target cells are identified by a 7AAD stain, which specifically permeates dead cells. Data analysis is performed first by gating on PKH-26+ target cells, followed by the analysis of the 7AAD positive subpopulation. Target cell death was calculated on the bases of the ratio: [(% sample cytotoxicity − % spontaneous cytotoxicity)/(% total cytotoxicity − % spontaneous cytotoxicity)].
Statistical analyses
A paired Student t test was used to evaluate statistical significance. P < .05 was considered statistically significant. Statistics were calculated using GraphPad Prism 6 software.
Results
NK cells are increased in both PB and BM of MM patients
To analyze NK cells in MM disease, newly diagnosed, not treated patients, were enrolled in the study. We first determined the frequency of NK cells in both PB and BM compartments and compared it with the one in HDs. We found a higher amount of NK cells in both PB (18.2% ± 1.153% vs 10.37% ± 0.57%, P = .002) and BM of MM patients (17.57% ± 0.44% vs 9.54% ± 0.44%, P = .002) (Figure 1A), whereas total leukocyte and lymphocyte counts did not show significant differences between MM patients and HDs. Remarkably, a consistent fraction of NK cells in both PB and BM of MM patients expressed Ki67 (Figure 1B), therefore indicating that NK cells in these patients are largely in a proliferative phase, which may account for their higher amount in MM patients.
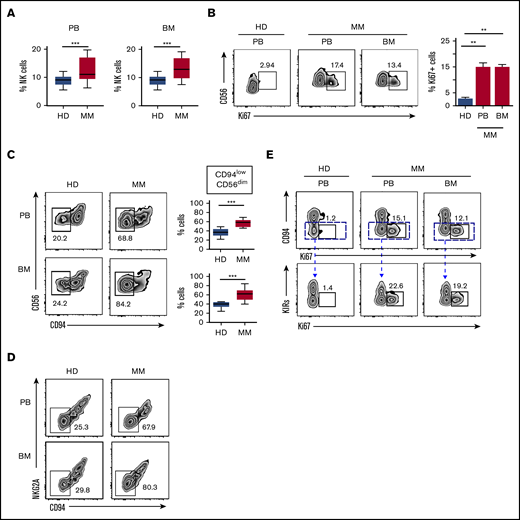
Assessment of NK cell frequency and proliferation in MM patients. (A) PBMCs and BMMCs of MM patients or HDs were analyzed for their frequency of NK cells (gated on total viable CD56+ CD3− lymphocytes). Box and whisker plots represent percentage of NK cells in PB (MM, n = 23; HD, n = 23) and BM (MM, n = 23; HD, n = 3) samples (***P < .001; Student t test). (B) Proliferating NK cells were assessed by Ki67 staining in PBMCs and BMMCs derived from MM patients and in PBMCs from HDs as control. Representative dot plots show the percentage of Ki67+ cells among total NK cells. Data derived from 23 MM patients are summarized in the right panel and compared with PBMN of HDs (n = 20). Bars represent mean values ± SEM of Ki67+ NK cells (**P < .01; Student t test). (C) Representative dot plots of NK cells from PB and BM of MM patients and HDs showing the percentage of CD94lowCD56dim NK cells. Box and whisker plots represent the frequency of CD94lowCD56dim NK cells in PB or BM of 23 MM patients compared with HDs (PB, n = 20; BM, n = 3), (***P < .001; Student t test). (D) Representative dot plots of NK cells from PB and BM of MM patients and HDs showing the frequency of CD94lowNKG2A− NK cells. (E) Analysis of proliferative rate of NK cells isolated from PB and BM of MM patients and from PB of HDs based on the expression of main inhibitory receptors. Top: numbers adjacent to gates indicate the frequency of CD94lowCD56dim Ki67+ NK cells. Bottom: Ki67+ cells within the CD94lowCD56dim NK cell population according to KIR (KIR2DL1/DS1 and KIR2DL2/DL3) expression. SEM, standard error of the mean.
Assessment of NK cell frequency and proliferation in MM patients. (A) PBMCs and BMMCs of MM patients or HDs were analyzed for their frequency of NK cells (gated on total viable CD56+ CD3− lymphocytes). Box and whisker plots represent percentage of NK cells in PB (MM, n = 23; HD, n = 23) and BM (MM, n = 23; HD, n = 3) samples (***P < .001; Student t test). (B) Proliferating NK cells were assessed by Ki67 staining in PBMCs and BMMCs derived from MM patients and in PBMCs from HDs as control. Representative dot plots show the percentage of Ki67+ cells among total NK cells. Data derived from 23 MM patients are summarized in the right panel and compared with PBMN of HDs (n = 20). Bars represent mean values ± SEM of Ki67+ NK cells (**P < .01; Student t test). (C) Representative dot plots of NK cells from PB and BM of MM patients and HDs showing the percentage of CD94lowCD56dim NK cells. Box and whisker plots represent the frequency of CD94lowCD56dim NK cells in PB or BM of 23 MM patients compared with HDs (PB, n = 20; BM, n = 3), (***P < .001; Student t test). (D) Representative dot plots of NK cells from PB and BM of MM patients and HDs showing the frequency of CD94lowNKG2A− NK cells. (E) Analysis of proliferative rate of NK cells isolated from PB and BM of MM patients and from PB of HDs based on the expression of main inhibitory receptors. Top: numbers adjacent to gates indicate the frequency of CD94lowCD56dim Ki67+ NK cells. Bottom: Ki67+ cells within the CD94lowCD56dim NK cell population according to KIR (KIR2DL1/DS1 and KIR2DL2/DL3) expression. SEM, standard error of the mean.
The CD94lowCD56dim NK cell subset is enriched and proliferating in MM patients
We then analyzed the distribution of major NK cell receptors and other relevant molecules expressed by NK cells of MM patients. As a whole, MM-NK cells displayed features consistent with a more activated and differentiated phenotype, highlighted by the upregulation of both activating receptors and activation markers and including a lower amount of CD62L+ cells and a higher frequency of CD57+ cells (supplemental Figure 2).13,15,18 In agreement with these observations, NK cells expressing significant levels of CD94 molecules were drastically decreased in MM patients; this distribution was accompanied by a concomitant lower frequency of NKG2A+ NK cells, whereas NK cells expressing NKG2C (also associated to CD94) were only slightly increased (supplemental Figure 2). Considering that CD94 density identifies three functional distinct NK cell subsets and the relevance of CD94/NKG2A inhibitory molecules in the recognition of MM cells, we further dissected NK cell subsets on the basis of CD94 expression.
CD94lowCD56dim subset was consistently increased in both PB (63.3% ± 7.8% vs 35.2% ± 9.8%, P = .001) and BM (65.9% ± 7.4% vs 36.2% ± 9.4%, P = .001) of MM patients, when compared with NK cells of HDs (Figure 1C). Accordingly, the amount of NKG2Alow/neg NK cells was also increased (Figure 1D). Further phenotypic analysis conducted on NK cell subsets dissected according to CD94 expression confirms the higher activation status of CD94lowCD56dim subset compared with the other 2 CD94high counterparts (supplemental Figure 2). Among the different markers, it is noteworthy that, in MM patients, DNAM-1 and granzyme B were higher in the CD94lowCD56dim subset (supplemental Figure 2). Interestingly, the accumulation of CD94lowCD56dim NK cells was accompanied by their concomitant expression of Ki67 (Figure 1E) and a further dissection of CD94lowCD56dim NK cells based on the expression of the main KIRs (namely KIR2DL1/DS1 and KIR2DL2/DL3/DS2) revealed that Ki67 expression was confined to CD94lowNKG2A−KIR− NK cells (Figure 1E, lower). These results suggest that, in MM patients, CD94lowNKG2A−KIR− NK cells, devoid of the main inhibitory signals, might be prone to proliferate upon their activation.
The increase of CD94lowCD56dim proliferating NK cells is an early hallmark of MM disease
Because MM disease is often preceded by precursor conditions, namely MGUS and sMM, we analyzed MM-NK cell features during MM progression. Interestingly, the modifications detected in MM patients were already present in MGUS patients and apparently accumulated along disease progression (Figure 2A). Total NK cell frequency, CD94low NK cells, and Ki67+ NK cells were increased in MGUS and sMM patients, both in PB and BM, reaching their highest levels in MM patients however (Figure 2A). Figure 2B shows the modifications of NK cell compartments progressively occurring along disease evolution in a representative patient followed during progression from MGUS to MM.
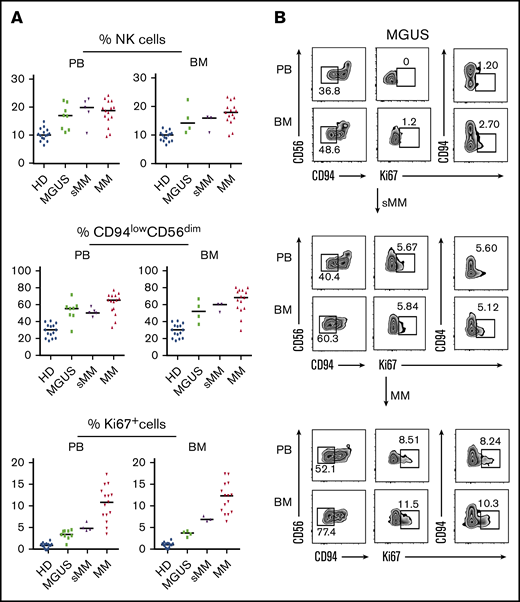
NK cell features during the early phases of disease: from MGUS to MM. (A) Comparative analysis of frequency of total NK cells (top), frequency of CD94lowCD56dim NK cells (middle), and frequency of Ki67+ NK cells (bottom) in PB and BM of MGUS, sMM, and MM patients compared with HDs. (B) NK cell analysis in a representative patient evolving from MGUS to sMM and eventually to MM. Dot plots depict frequency of CD94lowCD56dim NK cells and Ki67 analyzed on NK cells from both PB and BM of the patient along disease progression.
NK cell features during the early phases of disease: from MGUS to MM. (A) Comparative analysis of frequency of total NK cells (top), frequency of CD94lowCD56dim NK cells (middle), and frequency of Ki67+ NK cells (bottom) in PB and BM of MGUS, sMM, and MM patients compared with HDs. (B) NK cell analysis in a representative patient evolving from MGUS to sMM and eventually to MM. Dot plots depict frequency of CD94lowCD56dim NK cells and Ki67 analyzed on NK cells from both PB and BM of the patient along disease progression.
CD94lowCD56dim NK cells represent the main cytotoxic subset against autologous MM cells
We then investigated the functional capability of MM-NK cells against MM cells. To this aim, we used either primary MM cells or U266B1 cell lines or K562 cell line as cellular targets for both HD- and MM-NK cells. MM-NK cells were more competent than HD-NK cells in both cytolytic ability and IFN-γ secreting properties against allogeneic primary MM cells, U266B1 (Figure 3A) and K562 cell line (supplemental Figure 3), indicating that NK cells of MM patients are not functionally impaired. The cytotoxic ability of MM-NK cells was further confirmed by performing a target cell death-based cytotoxic assay comparing HD-NK cells and MM-NK cells (Figure 3B).
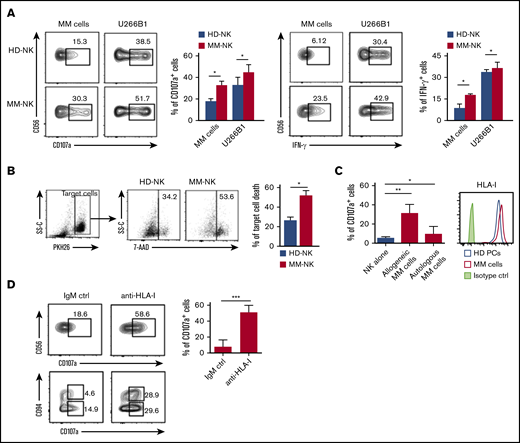
Cytotoxic ability and IFN-γ production of NK cells from MM patients. (A) NK cells isolated from PB of MM patients or HDs were cocultured with allogeneic primary MM cells or U266B1myeloma cell line at an E/T ratio 1:1 for 6 hours. (Left) Degranulation activity was assessed by evaluating the percentage of CD107a+ NK cells. One representative experiment of 8 is shown. Data from all the experiments are summarized in the bars as mean ± SEM of CD107a+ cells. (Right) IFN-γ production by NK cells was analyzed by flow cytometry. One representative experiment of 8 is shown. Results of all experiments performed are summarized in the bars as mean ± SEM of IFN-γ+ cells. (B) NK cells isolated from PB of MM patients or HDs were cocultured with U266B1 at an E/T ratio 1:1 for 3 hours. Killing capability of NK cells was assessed by evaluating target cell death on coculture. U266B1 target cells are gated as PKH26+ events and, following coculture with NK cells, dead cells were identified as positive for the viability dye 7AAD. One representative experiment out of 5 is shown. Results of all experiments performed are summarized in the bars as mean ± SEM of target cell death. (C) Degranulation ability of patient-derived NK cells against autologous or allogeneic MM cells. Bars show data from 10 independent experiments and represent mean ± SEM of CD107a+ cells. MM cells used for the degranulation assay were further analyzed for the expression of total HLA class I (clone W632) by flow cytometry. Histograms show data from a MM representative patient compared with healthy B plasma cells isolated from human tonsil. (D, top) Degranulation ability of patient-derived NK cells was analyzed against autologous MM cells in the presence either of an anti-HLA-I blocking antibody (clone A6-136, IgM) or an isotype-matched irrelevant IgM (IgM ctrl). One representative experiment is shown and numbers in each gate represent the percentage of CD107a+ cells. Data from 6 independent experiments are summarized in the bars and presented as mean ± SEM of CD107a+ NK cells, Student t test. (D, bottom) The same experiment but in relation to CD94 expression on NK cells. *P < .05, **P < .01, ***P < .001; Student t test.
Cytotoxic ability and IFN-γ production of NK cells from MM patients. (A) NK cells isolated from PB of MM patients or HDs were cocultured with allogeneic primary MM cells or U266B1myeloma cell line at an E/T ratio 1:1 for 6 hours. (Left) Degranulation activity was assessed by evaluating the percentage of CD107a+ NK cells. One representative experiment of 8 is shown. Data from all the experiments are summarized in the bars as mean ± SEM of CD107a+ cells. (Right) IFN-γ production by NK cells was analyzed by flow cytometry. One representative experiment of 8 is shown. Results of all experiments performed are summarized in the bars as mean ± SEM of IFN-γ+ cells. (B) NK cells isolated from PB of MM patients or HDs were cocultured with U266B1 at an E/T ratio 1:1 for 3 hours. Killing capability of NK cells was assessed by evaluating target cell death on coculture. U266B1 target cells are gated as PKH26+ events and, following coculture with NK cells, dead cells were identified as positive for the viability dye 7AAD. One representative experiment out of 5 is shown. Results of all experiments performed are summarized in the bars as mean ± SEM of target cell death. (C) Degranulation ability of patient-derived NK cells against autologous or allogeneic MM cells. Bars show data from 10 independent experiments and represent mean ± SEM of CD107a+ cells. MM cells used for the degranulation assay were further analyzed for the expression of total HLA class I (clone W632) by flow cytometry. Histograms show data from a MM representative patient compared with healthy B plasma cells isolated from human tonsil. (D, top) Degranulation ability of patient-derived NK cells was analyzed against autologous MM cells in the presence either of an anti-HLA-I blocking antibody (clone A6-136, IgM) or an isotype-matched irrelevant IgM (IgM ctrl). One representative experiment is shown and numbers in each gate represent the percentage of CD107a+ cells. Data from 6 independent experiments are summarized in the bars and presented as mean ± SEM of CD107a+ NK cells, Student t test. (D, bottom) The same experiment but in relation to CD94 expression on NK cells. *P < .05, **P < .01, ***P < .001; Student t test.
Nevertheless, when tested against autologous MM cells, the cytolytic activity of MM-NK cells was significantly defective (Figure 3C). This flawed cytotoxic capability against autologous MM cells seems to be dependent on the high level of HLA class I molecules expressed by MM cells, which resulted, as a whole, as high as in normal tonsillar plasma cells (Figure 3C, right). Masking of total HLA-class I molecules on MM targets resulted in a relevant recovery of NK cell degranulation (Figure 3D, upper). Although, as expected, NK cells were impaired in the autologous setting, it is noteworthy that CD94lowCD56dim NK cells mostly account for the residual degranulating activity against MM cells (Figure 3D, lower left), whereas CD94high counterpart showed cytolytic ability only upon blocking of total HLA-I molecules (Figure 3D, lower right).
MM cells induce the accumulation of CD94lowCD56dim cells
With the aim of identifying the mechanisms leading to the accumulation and proliferation of CD94lowCD56dim NK cell subset, we evaluated whether MM cells could directly be responsible for the observed effect. After 24 hours’ coculture of HD-NK cells with primary MM cells (ie, freshly isolated from patients’ BM) or with MM cell lines (namely U266B1 and MM1S), we observed that the percentage of CD94lowCD56dim NK cells was increased and this effect was specifically induced by MM cells because we did not detect any significant increase when NK cells were cocultured with other highly susceptible target cells such as K562 and B-lymphoblastoid cell line 721.221 (Figure 4A). Accordingly, primary MM cells and MM cell lines were able to induce specifically the proliferation of CD94lowCD56dim NK cell subset, whereas this proliferation response was not detected using K562 cell line in the coculture (Figure 4B-C). These results indicated that the observed accumulation of CD94lowCD56dim NK cells was dependent on their proliferation during coculture with MM cells.
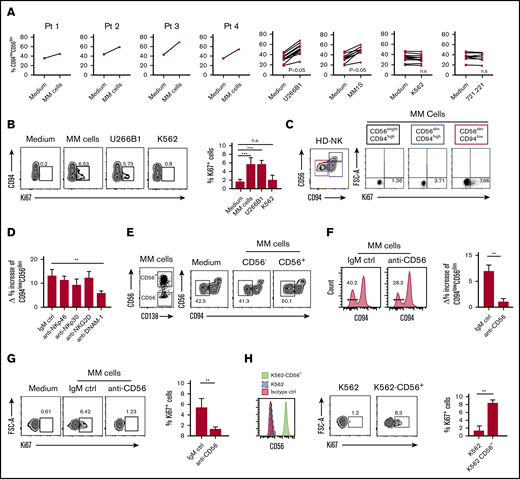
Mechanisms determining the expansion of CD94lowCD56dimNK cell subset induced by MM plasma cells. (A) Frequency of CD94lowCD56dim NK cells among total NK cells from HDs upon 24-hour coculture with or without allogeneic MM cells isolated from the BM of 4 distinct patients or with the indicated tumor cell lines. E/T ratio in the culture = 1:1. (B) In vitro proliferation of NK cells from HDs cultured for 24 hours in the absence (medium) or presence of primary MM cells, U266B1 and K562 cell lines. The Ki67 expression on NK cells is shown in relation to CD94 molecule distribution. Summary of data from 3 independent experiments is shown as mean ± SEM. (C) Proliferation of the 3 indicated NK cell subsets following coculture with primary MM cells. (D) NK cells from HDs were cultured with U266B1 cells for 24 hours in the presence of blocking mAbs for the indicated activating receptors or isotype-matched control mAbs (IgM ctrl). Histograms represent δ (Δ) values ± SEM of percentage increase of CD94lowCD56dim NK cells, calculated as the percentage of CD94lowCD56dim NK cells cultured with U266B1 subtracted the percentage of CD94lowCD56dim NK cells cultured without target cells. Bars represent mean ± SEM from 6 independent experiments. (E) CD56neg and CD56+ MM were sorted from patient’s BM (left dot plot) and cocultured for 24 hours with HD NK cells (right dot plots). One representative experiment of 3 with similar results is shown. (F) NK cells from HDs were cultured for 24 hours with MM cells isolated from patients’ BM in the presence of blocking mAb for CD56/NCAM-1 and then analyzed for the expression of CD94 by flow cytometry. Histograms show representative expression of CD94 in cultured NK cells in the presence of anti-CD56/NCAM-1 blocking mAb for or isotype-matched control mAb (IgM ctrl). Bars represent δ (Δ) values ± SEM of the increase in the percentage of CD94lowCD56dim NK cells calculated as the percentage of CD94lowCD56dim NK cells cultured with MM cells subtracted the percentage of CD94lowCD56dim NK cells cultured without a target. Data shown are from 6 independent experiments. (G) In vitro proliferation of HD NK cells cultured with MM cells in the presence of anti-CD56/NCAM-1 blocking antibody. Numbers adjacent to gates indicate the frequency of Ki67+ NK cells. Bars represent data from 4 independent experiments shown as mean ± SEM of Ki67+ cells. (H) Proliferation of HDs NK cells cocultured (24 hours) with either K562 or K562 transfected with the cDNA coding for CD56 protein. A representative experiment and mean of data ± SEM from 3 independent experiments are shown. **P < .01, ***P < .001; Student t test. n.s., not significant.
Mechanisms determining the expansion of CD94lowCD56dimNK cell subset induced by MM plasma cells. (A) Frequency of CD94lowCD56dim NK cells among total NK cells from HDs upon 24-hour coculture with or without allogeneic MM cells isolated from the BM of 4 distinct patients or with the indicated tumor cell lines. E/T ratio in the culture = 1:1. (B) In vitro proliferation of NK cells from HDs cultured for 24 hours in the absence (medium) or presence of primary MM cells, U266B1 and K562 cell lines. The Ki67 expression on NK cells is shown in relation to CD94 molecule distribution. Summary of data from 3 independent experiments is shown as mean ± SEM. (C) Proliferation of the 3 indicated NK cell subsets following coculture with primary MM cells. (D) NK cells from HDs were cultured with U266B1 cells for 24 hours in the presence of blocking mAbs for the indicated activating receptors or isotype-matched control mAbs (IgM ctrl). Histograms represent δ (Δ) values ± SEM of percentage increase of CD94lowCD56dim NK cells, calculated as the percentage of CD94lowCD56dim NK cells cultured with U266B1 subtracted the percentage of CD94lowCD56dim NK cells cultured without target cells. Bars represent mean ± SEM from 6 independent experiments. (E) CD56neg and CD56+ MM were sorted from patient’s BM (left dot plot) and cocultured for 24 hours with HD NK cells (right dot plots). One representative experiment of 3 with similar results is shown. (F) NK cells from HDs were cultured for 24 hours with MM cells isolated from patients’ BM in the presence of blocking mAb for CD56/NCAM-1 and then analyzed for the expression of CD94 by flow cytometry. Histograms show representative expression of CD94 in cultured NK cells in the presence of anti-CD56/NCAM-1 blocking mAb for or isotype-matched control mAb (IgM ctrl). Bars represent δ (Δ) values ± SEM of the increase in the percentage of CD94lowCD56dim NK cells calculated as the percentage of CD94lowCD56dim NK cells cultured with MM cells subtracted the percentage of CD94lowCD56dim NK cells cultured without a target. Data shown are from 6 independent experiments. (G) In vitro proliferation of HD NK cells cultured with MM cells in the presence of anti-CD56/NCAM-1 blocking antibody. Numbers adjacent to gates indicate the frequency of Ki67+ NK cells. Bars represent data from 4 independent experiments shown as mean ± SEM of Ki67+ cells. (H) Proliferation of HDs NK cells cocultured (24 hours) with either K562 or K562 transfected with the cDNA coding for CD56 protein. A representative experiment and mean of data ± SEM from 3 independent experiments are shown. **P < .01, ***P < .001; Student t test. n.s., not significant.
To gain more insight into the specific mechanism underlying the accumulation of CD94low subset induced by MM cells, we determined CD94 expression upon 24-hour culture of NK cells in the presence of MM cell culture supernatant. Conditioned medium was ineffective for the accumulation of CD94lowCD56dim subset, suggesting that cell-to-cell contacts between NK cells and MM cells were required (supplemental Figure 4). Thus, we assessed the contribution of the main NK cell activating receptors that might potentially be involved in the interaction with MM cells.19 Remarkably, blocking DNAM-1 receptor significantly reduced the accumulation of CD94lowCD56dim NK cells, whereas inhibition of NKp46, NKp30, and NKG2D receptors did not significantly affect CD94lowCD56dim NK cell subset accumulation (Figure 4D). Because the ligands of DNAM-1 are widely expressed in several other tumor cell lines that do not induce CD94lowCD56dim NK cell expansion, we wondered whether MM cells may additionally provide some specific signal that might account for this peculiar accumulation in MM patients. NCAM-1, also known as CD56, is a glycoprotein typically expressed on NK cells but also present on neoplastic plasma cells.
CD56 has been implicated as having a role in cell–cell adhesion by homophilic interaction. Recently, it has been reported that the expression of CD56 in breast cancer enhances the formation of cytotoxic immunological synapse becoming a factor responsible for the sensitivity to NK cell killing.20 In light of this, we hypothesized that CD56, known to be commonly expressed also by MM cells, might account for the observed effect on NK cell activation.
To address this issue, we sorted by flow cytometry either CD56− or CD56+ MM cells from patients’ BM and we observed that only CD56+ MM cells were able to induce CD94low accumulation (Figure 4E). Accordingly, the addition of anti-CD56 blocking mAb to MM/NK cell cocultures prevented the accumulation of CD94lowCD56dim NK cells and, remarkably, their proliferation in response to MM cells (Figure 4F-G).
To further support the relevance of CD56 molecules in the observed proliferation of MM-associated NK cells, we stably transfected the cDNA coding for CD56 protein in the highly susceptible NK cell target K562 cell line. Reliable expression of CD56 was confirmed by staining with anti-CD56 mAb (Figure 4H). Consistent with our hypothesis, K562 cells expressing CD56 acquired the ability to induce proliferation of NK cells, whereas parental K562 was unable to mediate the same effect (Figure 4H), confirming that CD56–CD56 interaction between MM and NK cells can play a relevant role in the activation of NK cells.
Discussion
Immune effector cells, including NK cells, are known to play a crucial role in the control of tumor growth. The therapeutic potential of NK cells against cancers has stimulated their study and led to the discovery of several NK cell subsets, each of which is endowed with different functions.
The precise identification of tumor-associated NK cell subsets that are specifically activated along the disease may provide information regarding an ongoing immune response against the tumor and might be of help to identify an immuno-editing process occurring in a given patient.21
Although several studies have shown that tumor-associated NK cells in advanced disease can have profound functional defects and therefore be inefficacious against tumor, the further level of complexity from the wide heterogeneity and plasticity of NK cells can allow us to identify specific NK cell subsets endowed with enduring antitumor activity.22
Thus, the challenge is to understand which subpopulations mediate the antitumor response and which environmental factors can modulate their activity. In this regard, a large body of evidence reveals enrichment of selective NK cell subsets in both solid and hematological tumors,23 indicating that the outcome of NK cell antitumor effector functions is not always predictable because it is largely dependent on the specific tumor microenvironment. Although the mechanisms underlying the enrichment in specific NK cell subsets have not always been fully elucidated, it is conceivable that neoplastic cells or tumor-derived factors could take part in this process. In MM disease, tumor plasma cells appear to be mainly confined to the microenvironment of the BM and are rarely detected in the periphery.
Because several studies indicated that tumor-induced impairment of NK cell functions correlates with alterations of NK cell subset distribution, we analyzed different NK cell subsets on the basis of their receptor expression, including CD94/NKG2A molecules, 1 of the dominant NK cell inhibitory signal involved in MM resistance to NK cell killing. Surprisingly, we observed an enrichment of the CD94lowCD56dim subset in both PB and BM of MM patients that was more evident in the latter. The CD94lowCD56dim NK cell subset showed the highest cytotoxic potential against autologous MM cells and, interestingly, these cells were proliferating in MM patients, thus indicating that they can undergo in vivo activation in these patients.
Our data show that MM-associated NK cells are fully competent per se, at least in the disease stages included in this study, ranging from I to III, but most of them lose their cytotoxic potential in the autologous setting, most likely because of the high expression of HLA class I molecules displayed by MM cells. Analysis of NK cell subset distribution based on CD94 expression reveals that CD94lowCD56dim NK cells maintain the capability to degranulate against autologous MM. Although in vitro studies have demonstrated a higher killing potential of KIR/ligand-mismatched NKG2A− NK cells against MM cells,17 an accurate prediction of NK cell activity in patients was lacking. Our data not only corroborated previous reports but also provided in vivo evidence for a strong antimyeloma activity of a specific NK cell subpopulation devoid of the main inhibitory receptors.
The accumulation of CD94lowCD56dim NK cell subset accumulation also in MGUS and smoldering MM suggests an active role of NK cells not only in MM but also in the early phase of disease development. These findings represent an interesting observation that calls for further investigation considering that these initial phases of the disease are not currently treated and a future NK cell-based strategy might be envisaged for these precursor forms with the aim of blocking or, at least, slowing down the progression of the disease.
Altogether, these findings clearly highlight the relevance of inhibitory receptors, including NKG2A/CD94, in the anti-MM immune response. NKG2A has recently been identified as an immune checkpoint therapeutic target for both T cells and NK cells leading to the ongoing clinical testing of anti-NKG2A blocking antibodies. In this context, it has been recently shown that the use of novel anti-NKG2A mAbs in combination with anti-PD-L1 mAbs had a synergistic antitumor effect, improving the control of tumor growth.24,25 Another approach to bypass NKG2A-mediated inhibition is the generation of highly functional NK cells lacking NKG2A, achieved by using modern gene editing methodologies based on meganucleases, TALEN, or CRISPR/Cas9. The NKG2Anull cells generated in this way had a superior antitumor capacity compared with that of their NKG2A+ counterparts and could induce, in mice, a durable tumor remission.26
More in general, novel NK cell-based immunotherapeutic strategies are now oriented to the identification, isolation, expansion, and administration of multifunctional NK cell subsets with high antitumor potential. In the case of MM, expansion and infusion of a high number of CD94/NKG2Aneg NK cells could represent a way to optimize NK cell therapy and thus improve its efficacy.
CD56 expression is not restricted to NK cell population because it is also expressed by a T-cell subtype and some cancer cells.27 Our current data highlighted the relevance of CD56 molecule as an activating signal provided by tumor plasma cells to NK cells. Being an adhesion molecule, CD56 is involved in cell-to-cell interactions through multiple cis and trans homophilic binding.28 CD56+ immune cells are able to form strong immune synapses with each other through CD56 binding.20-29 For example, CD56+ DCs have been shown to induce the preferential activation and expansion of CD56+ γδ T cells via CD56.30 Otherwise, homophilic interaction between CD56 molecules can also occurs between immune cells and cancer cells. For instance, CD56 expressed by cytokine-induced killer cells confers them a stronger cytotoxic effect against CD56+ leukemia cells.31 Moreover, exploiting fluorescence microscopy, a recent study clearly showed that CD56 expression in breast cancer is associated with immunological synapse and granzyme B transfer to target cells, thus concluding that CD56 enhances the formation of cytotoxic immunological synapse.20 Our observation that CD94lowCD56dim NK cells display a high proliferative rate in these patients is of particular interest because this NK cell subset has been previously associated with a more differentiated phenotype endowed with low proliferative potential, at least on cytokine stimulation.13 We here showed that CD94lowCD56dim NK cells are able to actively proliferate in vitro upon interaction with MM cells and CD56 signal is critical for inducing this effect.
Our data also demonstrate that DNAM-1 activating receptor is required to induce the accumulation and a proper activation of CD94lowCD56dim NK cells by MM cells. The immunological synapses forming between NK cells and target cells are extremely relevant to obtain a proper NK cell activation. In this context, the homophilic interaction between CD56 molecules in trans seems to confer to MM cells a particular activating potential for NK cells. Therefore, CD56 homophilic binding between NK and MM cells occurs and represents an additional activating signal able to improve myeloma cell recognition by NK cells and, at the same time, a critical factor to prompt their proliferation upon interaction with target cells.
In conclusion, our current results represent an advance in understanding the crucial signals involved in anti-MM response by NK cells, providing further support for the clinical employment of anti-NKG2A mAbs in the treatment of these patients and, potentially, also of those in the earlier stages of the disease. This information might as well be useful for designing novel and more effective NK cell-based immunotherapeutic strategies for MM disease.
Send data sharing e-mails to the corresponding author, Guido Ferlazzo, at guido.ferlazzo@unime.it.
Acknowledgments
This work was supported in part by grants from the Associazione Italiana Ricerca sul Cancro IG11650, Programma Operativo Fondo Europeo di Sviluppo Regionale 2007-2013—linea d’intervento 4.1.2.A, Italian Ministry of Health, Ricerca Finalizzata 2018, Italian Ministry of Education, University and Research (MIUR), PRIN 2017 (G.F.), and Finanziamento Annuale Individuale Attività Base di Ricerca 2017 by MIUR (P.C.)
Authorship
Contribution: C.B. and S.C. designed and performed experiments, analyzed results and prepared figures, and wrote the manuscript; D.O. and F.L. designed some of the research work and performed cell sorting by flow cytometry; P.C. analyzed data and provided interpretation of FACS data; C.D.P. and G.S.M. collected, stored, and processed peripheral blood and bone marrow samples and performed experiments; A.A., C.M., and V.I. provided critical biological samples, managed patients, and evaluated clinical parameters and performed statistical analysis; C.C., D.P., and M.C.M. provided critical reagents and analyzed data; and G.F. designed the experiments, supervised the study, analyzed data, and wrote the manuscript.
Conflict-of-interest disclosure: The authors declare no competing financial interests.
Correspondence: Guido Ferlazzo, Laboratory of Immunology and Biotherapy, University of Messina, Pad. H–A.O.U. Policlinico, Via Consolare Valeria 1, 98125 Messina, Italy; e-mail: guido.ferlazzo@unime.it.

