

Key Points
The proportion of Treg cells is increased in patients with mixed chimerism after SCT and acts to suppress the alloreactive immune response.
Host and donor cells both contribute to the expanded Treg cell pool in this setting.

Abstract
Transplantation is an effective treatment of many clinical disorders, but the mechanisms that regulate immunological tolerance are uncertain and remain central to improving patient outcome. Hemopoietic stem cell transplantation (SCT) often establishes “mixed chimerism” in which immune cells from both the donor and patient coexist in vivo in a setting of immunological tolerance. We studied immune function in 69 patients within 2 months following SCT; 37 were fully donor and 32 displayed mixed chimerism. The proportion of T regulatory (Treg) cells was increased during mixed chimerism and comprised equal numbers of donor and host-derived regulatory cells. This was associated with a tolerogenic PD-L1+ profile on dendritic cells. Importantly, effector T cells from patients with mixed chimerism exhibited reduced cytotoxicity against host target cells in vitro, but this was restored following depletion of CD4+ Treg cells. These data show that Treg cells play a major role in sustaining immunological tolerance during mixed chimerism. These insights should help to guide novel interventions to improve clinical transplantation.
Introduction
The ultimate goal of transplantation immunology is the generation of tolerance to allogeneic tissue in the absence of long-term immunosuppression and with intact third-party immunity. Operational tolerance was first demonstrated in fraternal bovine twins that shared a placental circulation and was termed “mixed hemopoietic chimerism.”1 Active induction of mixed chimerism (MC) to promote tolerance toward donor antigens was achieved by transplanting allogeneic hemopoietic stem cells into neonatal mice,2 but the establishment of MC to facilitate allogeneic transplantation in adult humans has proven to be a significant challenge.3-8
Clinical regimens to induce MC rely on reduced-intensity conditioning protocols together with T-cell depletion or costimulatory blockade, which reduce host resistance without eliminating host hemopoiesis.6-8 However, the mechanisms that mediate chimeric tolerance in this setting remain undefined. Studies within patients have shown that MC does not have to be maintained indefinitely or allografts to be tolerated long-term,9 which suggests that thymic (central) deletion of alloreactive T cells is not sufficient to explain sustained chimerism in this setting, despite a major role in murine models.10 Indeed, studies have suggested that suppression mediated by regulatory T cells or monocytoid cells11 or the induction of peripheral anergy9,12 may be more important.
MC is observed frequently following reduced-intensity conditioned allogeneic hemopoietic stem cell transplantation (allo-HSCT) for hematological malignancies,13-17 particularly when in vivo T-cell depletion is incorporated into the conditioning regimen.18-22 T-cell depletion is used in this setting to suppress the alloreactive immune response and reduce the risk of graft-versus-host disease (GVHD). However, allo-reactive immune responses also underlie the graft-versus-leukemia effect, and because disease relapse remains the major clinical challenge in allo-HSCT, it is imperative that the degree of T-cell depletion is titrated according to clinical risk.23,24
In this study, we investigated the mechanisms of immune tolerance in a cohort of patients with stable mixed T-cell chimerism originating early posttransplant. We show that T regulatory (Treg) cells, derived from both the patient and the donor, play the dominant role in suppression of alloreactive immune responses in this setting. These findings suggest a range of potential options to modulate immune tolerance in the early posttransplant period.
Materials and methods
Study participants
Patients with acute myeloid leukemia undergoing reduced-intensity conditioned allo-HCT between 2013 and 2017 were eligible for investigation (supplemental Table 1). All patients received 10 mg/d alemtuzumab from day −5 pre-HSCT for 5 days, fludarabine (30 mg/m2 for 5 days), melphalan (140 mg/m2 for 1 day), and posttransplant cyclosporin A for GVHD prophylaxis. Antimicrobial prophylaxis and viral monitoring were carried out according to standard institutional policies. Analyses of peripheral blood mononuclear cell (PBMC) and T-cell chimerism were performed at 50 days posttransplant as described previously.19
Flow cytometry
PBMCs were isolated by density gradient centrifugation using lymphocyte cell separation media (Cedarlane). Cell populations were analyzed using multiparameter flow cytometry (supplemental Table 2 antibody list). Mononuclear cells were stained with antibodies on ice for 20 minutes, protected from light, washed in MACs buffer (Sigma-Aldrich), and compared with unstained controls. For Treg analysis, cells were surface stained and then fixed, permeabilized, and stained for intranuclear FoxP3 expression using the eBioscience FoxP3/Transcription factor staining buffer set (Thermofisher). An example gating strategy for Treg cells is shown in supplemental Figure 1A. Dead cells were discriminated using propidium iodide (BD Biosciences) or fixed viability dyes (eBioscience). Data were acquired on a Gallios flow cytometer (Beckman Coulter) and analyzed using Kaluza, version 1.3, software. Absolute T-cell counts were calculated by multiplying the percentage of T cells (from all lymphocytes) by the clinically derived lymphocyte count obtained from the same bleed (×109/L).
Detection of KDM5D messenger RNA
To assess the composition of host and donor cellular compartments, 1 × 10⁶ post-HSCT PBMC were cell surface–stained and subjected to the PrimeFlow RNA assay (eBioscience) per the manufacturer’s instructions. A β-2M housekeeper probe and a customized KDM5D probe (to discriminate between male and female cells) were used in all analyses, whereas a FoxP3 probe was added to assess Tregs. To gain sensitivity, target probe hybridization was extended to 3 hours, whereas preamplification, amplification, and label probe hybridization steps were extended to 2 hours each. Examples of the gating strategy and control experiments are shown in supplemental Figure 1B-C.
Post-HSCT T-cell responses to HLA-DR+ cell stimulation
In vitro coculture was adapted from Jedema et al.25 Stimulator HLA-DR+ cells were enriched from pre-HSCT patient PBMC samples (>90% purity) using anti-HLA-DR magnetic beads (Miltenyi Biotech). These were irradiated (30 Gy) to prohibit proliferation and alteration of the final stimulator:effector cell ratio. T cells (>98% purity) were obtained using negative magnetic selection (Stem Cell Technologies, Cambridge, United Kingdom) from post-HSCT PBMCs. For patients displaying MC, T cells were also depleted of CD25 expressing Tregs, using anti-CD25 magnetic beads (>95% pure; Miltenyi Biotech). T cells were labeled with 10 μM/1 × 106 cells Violet cell tracer (VCT; Invitrogen) for 20 minutes at 37°C. The reaction was stopped by adding RPMI 1640 media containing 10% fetal calf serum. After 2 washes, 1 × 10⁵ T cells were cultured at a 1:1 ratio with HLA-DR+ stimulator host cells in RPMI 1640 media supplemented with penicillin and streptomycin, l-glutamine, and 10% fetal calf serum. Cultures were set up in triplicate and incubated at 37°C for 5 days. Upon harvest, death was assessed with propidium iodide, and the number of stimulator and responder cells assessed in comparison with a known quantity of Accu-Chek counting beads (Molecular Probes, Invitrogen). An index of in vitro cytotoxicity, defined as the percentage of remaining stimulator patient-derived HLA-DR+ cells divided by the percentage of remaining responder posttransplant VCT+ T cells, was then generated. An example of the gating strategy is shown in supplemental Figure 2A. The relative survival of HLA-DR+ antigen-presenting cells (APCs) and T cells during culture is shown in supplemental Figure 2B.
Statistical analyses
Summarized means of grouped data were analyzed by 2-way analysis of variance (ANOVA) with post hoc Tukey tests. One-way ANOVA or Kruskal-Wallis tests with post hoc Dunn tests compared means across 3 groups; unpaired Student t tests, Mann-Whitney U analyses, and Wilcoxon matched pair signed rank tests did likewise across 2 groups. Analyses were undertaken using Prism software (GraphPad). The effect of chimerism on overall survival was estimated using the Kaplan-Meier method and log-rank test. Chimerism was treated as a baseline variable using a landmark analysis. The effect of chimerism on time-to-event outcomes with competing risks (relapse and GVHD) was estimated by the Gray method. These calculations were performed with R 2.14.1 (the R project for Statistical Computing).
Study approval
Clinical data and samples were obtained following written informed consent (in accordance with the Declaration of Helsinki) to the Biological Correlates of Stem-cell Transplantation study and approved by the South Birmingham Research Ethics Committee (no. Q5/1Q2707/175).
Results
MC is established following T cell–depleted allo-HSCT
A total of 69 consecutive patients undergoing reduced-intensity conditioned allo-HSCT for the treatment of acute myeloid leukemia was recruited into the study; blood samples were taken at 4 to 8 weeks after transplant. The proportion of donor and host cells within both the PBMC and T-cell compartments was measured using variable number of tandem repeats–specific polymerase chain reaction. The detection limit of the assay was 1%; as such, ≥99% donor chimerism was considered to be “fully donor,” whereas ≤98% donor chimerism constituted MC.
Thirty-seven patients (54%) were fully donor in both the PBMC and T-cell fractions (full chimerism [FC]), whereas 32 patients (46%) demonstrated MC in PBMC and/or T cells (Figure 1A). The degree of chimerism varied within MC patients, although the percentage of donor cells in the PBMC fraction was generally greater than the T-cell fraction. Indeed, the ratio of donor to host T cells was 1.2:1, indicating similar proportions of donor and host-derived T cells within patients at this early time point. Interestingly, this pattern of T-cell MC was stable, and no patients spontaneously converted to FC within the first 6 months (Figure 1B-C). Donor lymphocyte infusions were administered at 6 months if MC persisted, according to institutional protocol. No differences in the proportion of CD56+ natural killer cells or CD19+ B cells were seen within the 2 groups (data not shown).
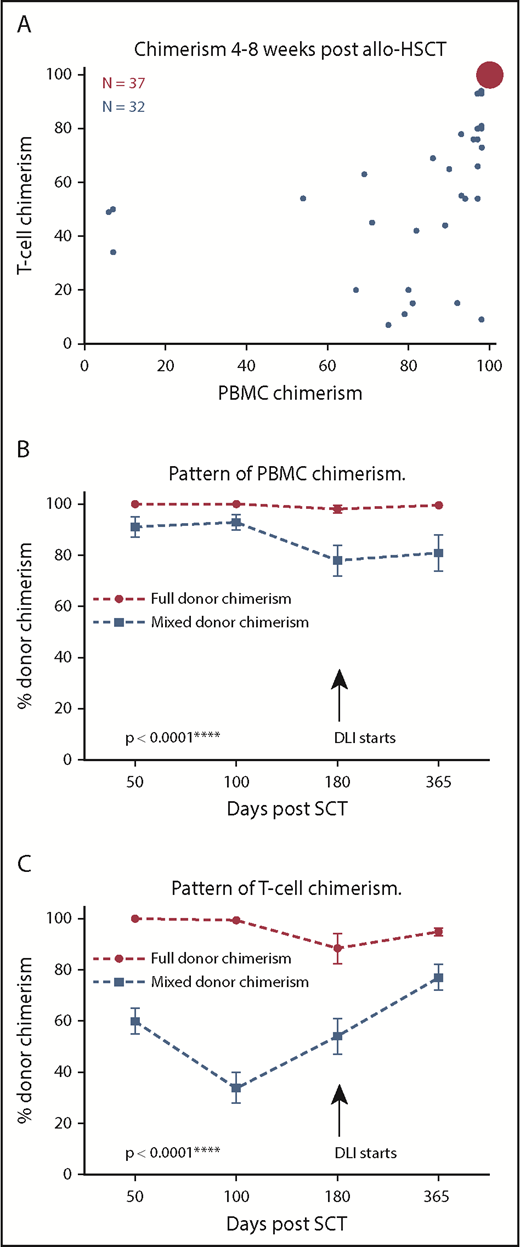
PBMC and T-cell donor chimerism following HSCT. (A) Bubble chart demonstrating PBMC and T-cell donor chimerism levels at day 50 posttransplant. The area of each bubble represents the number of events. The first group (n = 37, red), displayed FC, in which both PBMC and T-cell donor chimerism was ≥99%. The second group (MC, n = 32, blue) demonstrated MC in both PBMC and T-cell fractions (PBMC and T-cell chimerism ≤98%). The pattern of PBMC donor chimerism up to day 365 according to donor chimerism at day 50 posttransplant. PBMC chimerism remained stable at complete (or near complete) donor chimerism in patients who demonstrated FC by day 50 posttransplant. In contrast, PBMC donor chimerism remained significantly lower in those found to have MC at day 50, even beyond the initiation of donor lymphocyte infusion (DLI) at day 180 (****P < .0001; 2-way ANOVA, with post hoc Tukey test, mean, and standard error shown for all data points; FC, n = 37; MC, n = 32). (B) The pattern of T-cell donor chimerism up to day 365 according to donor chimerism at day 50 posttransplant. (C) T-cell chimerism remained stable at complete (or near complete) donor chimerism for the first 100 days in patients who demonstrated FC by day 50 posttransplant, but displayed an average drop of 10% by day 180. In contrast, T-cell donor chimerism remained significantly lower in those found to have MC at day 50 with a trend toward partial correction following instigation of DLI at day 180 (****P < .0001, 2-way ANOVA, with post hoc Tukey test, mean, and standard error shown for all data points; FC, n = 37; MC, n = 32).
PBMC and T-cell donor chimerism following HSCT. (A) Bubble chart demonstrating PBMC and T-cell donor chimerism levels at day 50 posttransplant. The area of each bubble represents the number of events. The first group (n = 37, red), displayed FC, in which both PBMC and T-cell donor chimerism was ≥99%. The second group (MC, n = 32, blue) demonstrated MC in both PBMC and T-cell fractions (PBMC and T-cell chimerism ≤98%). The pattern of PBMC donor chimerism up to day 365 according to donor chimerism at day 50 posttransplant. PBMC chimerism remained stable at complete (or near complete) donor chimerism in patients who demonstrated FC by day 50 posttransplant. In contrast, PBMC donor chimerism remained significantly lower in those found to have MC at day 50, even beyond the initiation of donor lymphocyte infusion (DLI) at day 180 (****P < .0001; 2-way ANOVA, with post hoc Tukey test, mean, and standard error shown for all data points; FC, n = 37; MC, n = 32). (B) The pattern of T-cell donor chimerism up to day 365 according to donor chimerism at day 50 posttransplant. (C) T-cell chimerism remained stable at complete (or near complete) donor chimerism for the first 100 days in patients who demonstrated FC by day 50 posttransplant, but displayed an average drop of 10% by day 180. In contrast, T-cell donor chimerism remained significantly lower in those found to have MC at day 50 with a trend toward partial correction following instigation of DLI at day 180 (****P < .0001, 2-way ANOVA, with post hoc Tukey test, mean, and standard error shown for all data points; FC, n = 37; MC, n = 32).
DCs are less activated and express a tolerogenic PD-L1+ phenotype in patients with MC
Dendritic cells (DCs) are pivotal in priming immune responses; to interrogate the mechanisms that may regulate MC, we initially investigated the phenotype of CD11c+ conventional (cDC) and CD123+ plasmacytoid DC (pDC) in relation to chimerism.
The ratio of cDC to pDC was 2.5:1 in FC and MC patients (Figure 2A). CD86 is a marker of activation on DC, and a markedly reduced proportion of CD86+ DC was observed in patients with MC compared with those with FC (MC 58% vs FC 81%; P = .0068; Figure 2B).
![Figure 2. DCs are less activated and express a tolerogenic PD-L1+ phenotype in patients with MC. (A) The contribution and phenotype of cDC and pDC within the peripheral mononuclear cell compartment at 4 to 8 weeks after allo-HSCT was assessed by flow cytometry. The ratio of cDC:pDC was similar in patients with FC (2.5:1; n = 15) or MC (2.6:1; n = 15). (B) Expression of CD86 on DC in relation to chimerism status. A total of 81% of DC in FC expressed CD86 (n = 15) compared with only 58% of DC in MC (n = 15; **P = .0068). (C) Expression of PD-L1 and PD-L2 on DC in relation to chimerism status. A total of 41% of DC in MC expressed PD-L1 compared with 18% of DC in FC (**P = .0052; FC, n = 15; MC, n = 15). No difference was observed in the level of PD-L2 expression (FC, 4.3%; MC, 7% [not significant]). DCs therefore appear to have a tolerogenic phenotype in the setting of MC. (D) Expression of PD-L1 on DC subsets. Increased PD-L1 expression was most pronounced on the cDC subset in MC (47%; n = 15) compared with cDC in FC (20%; n = 15; **P = .0053), whereas a trend was observed toward increased PD-L1 expression on pDC in MC. (E) Expression of PD-L1 on host and donor DC in MC. This was determined by combining cell surface phenotyping with RNA probes specific for the KDM5D (SMCY) gene, derived from the Y chromosome. Host and donor cells were thereby distinguishable in the context of patients undergoing gender-mismatched allo-HSCT. PD-L1 expression was observed on a mean of 67% donor DC compared with only 29% of host DC (n = 10; ***P = .0002). For graphs with unpaired data, the mean and standard error of the mean are shown; analyses were undertaken with 2-tailed Mann-Whitney U tests. Paired analysis used a Wilcoxon matched pairs signed rank test.](https://ash.silverchair-cdn.com/ash/content_public/journal/bloodadvances/3/5/10.1182_bloodadvances.2018025502/2/m_advances025502f2.png?Expires=1767783968&Signature=bYRmwZFzuMS9FqXi7pDl1GIdDxa3rWWbN7wWAh6lNfliq7YMdn2CFe~WMoD83c61mBouewcdMuhu6XRvR92fndvCoDhmGhddaeRK7rGRSlVx1qAPm8MtXDW0xwizl5W3rgET6gYgoAnEBLPPyDqGnFndLyC-n~2yT2e2FAP5CqN9mg3N8pxiX8isddlpNbebUjHAfldkKX070uYslr55vVSypHZCrS57GBSbsupTArmQKQ367NEuPTrXHzGt6bycpEXvfPPr~4y4VPL0VhgZBZpXSEMAHPFRlWr5-V9aw6Sl39xlxayKF5bmU95VhYbFaPXg~gmKaF-lewnothvHbA__&Key-Pair-Id=APKAIE5G5CRDK6RD3PGA)
DCs are less activated and express a tolerogenic PD-L1+phenotype in patients with MC. (A) The contribution and phenotype of cDC and pDC within the peripheral mononuclear cell compartment at 4 to 8 weeks after allo-HSCT was assessed by flow cytometry. The ratio of cDC:pDC was similar in patients with FC (2.5:1; n = 15) or MC (2.6:1; n = 15). (B) Expression of CD86 on DC in relation to chimerism status. A total of 81% of DC in FC expressed CD86 (n = 15) compared with only 58% of DC in MC (n = 15; **P = .0068). (C) Expression of PD-L1 and PD-L2 on DC in relation to chimerism status. A total of 41% of DC in MC expressed PD-L1 compared with 18% of DC in FC (**P = .0052; FC, n = 15; MC, n = 15). No difference was observed in the level of PD-L2 expression (FC, 4.3%; MC, 7% [not significant]). DCs therefore appear to have a tolerogenic phenotype in the setting of MC. (D) Expression of PD-L1 on DC subsets. Increased PD-L1 expression was most pronounced on the cDC subset in MC (47%; n = 15) compared with cDC in FC (20%; n = 15; **P = .0053), whereas a trend was observed toward increased PD-L1 expression on pDC in MC. (E) Expression of PD-L1 on host and donor DC in MC. This was determined by combining cell surface phenotyping with RNA probes specific for the KDM5D (SMCY) gene, derived from the Y chromosome. Host and donor cells were thereby distinguishable in the context of patients undergoing gender-mismatched allo-HSCT. PD-L1 expression was observed on a mean of 67% donor DC compared with only 29% of host DC (n = 10; ***P = .0002). For graphs with unpaired data, the mean and standard error of the mean are shown; analyses were undertaken with 2-tailed Mann-Whitney U tests. Paired analysis used a Wilcoxon matched pairs signed rank test.
DCs are less activated and express a tolerogenic PD-L1+phenotype in patients with MC. (A) The contribution and phenotype of cDC and pDC within the peripheral mononuclear cell compartment at 4 to 8 weeks after allo-HSCT was assessed by flow cytometry. The ratio of cDC:pDC was similar in patients with FC (2.5:1; n = 15) or MC (2.6:1; n = 15). (B) Expression of CD86 on DC in relation to chimerism status. A total of 81% of DC in FC expressed CD86 (n = 15) compared with only 58% of DC in MC (n = 15; **P = .0068). (C) Expression of PD-L1 and PD-L2 on DC in relation to chimerism status. A total of 41% of DC in MC expressed PD-L1 compared with 18% of DC in FC (**P = .0052; FC, n = 15; MC, n = 15). No difference was observed in the level of PD-L2 expression (FC, 4.3%; MC, 7% [not significant]). DCs therefore appear to have a tolerogenic phenotype in the setting of MC. (D) Expression of PD-L1 on DC subsets. Increased PD-L1 expression was most pronounced on the cDC subset in MC (47%; n = 15) compared with cDC in FC (20%; n = 15; **P = .0053), whereas a trend was observed toward increased PD-L1 expression on pDC in MC. (E) Expression of PD-L1 on host and donor DC in MC. This was determined by combining cell surface phenotyping with RNA probes specific for the KDM5D (SMCY) gene, derived from the Y chromosome. Host and donor cells were thereby distinguishable in the context of patients undergoing gender-mismatched allo-HSCT. PD-L1 expression was observed on a mean of 67% donor DC compared with only 29% of host DC (n = 10; ***P = .0002). For graphs with unpaired data, the mean and standard error of the mean are shown; analyses were undertaken with 2-tailed Mann-Whitney U tests. Paired analysis used a Wilcoxon matched pairs signed rank test.
PD-L1 and PD-L2 play important roles in the promotion of tolerogenic function by DC and impair T-cell immunity to minor histocompatibility antigens with subsequent attenuation of the graft-versus-leukemia response.26-28 Interestingly, PD-L1 expression was twice as high on DC from patients with MC compared with those with FC (41% vs 18%, P = .0052; Figure 2C). This was most pronounced in cDC (P = .0053; Figure 2D), although a similar trend was also observed within the pDC subset. Expression of PD-L2 did not vary between different groups (4.3% FC vs 7% MC; Figure 2C).
A challenge in clinical studies has been to directly visualize donor or host cells to assess the effect of chimerism on individual immune lineages. To accomplish this, we used PrimeFlow RNA in patients undergoing gender-mismatched HSCT. This determined cellular origin according to RNA expression of the KDM5D (SMCY) gene derived from the Y chromosome and was combined with conventional immunophenotyping to examine host and donor DCs using flow cytometry. Interestingly, PD-L1 expression by donor DC was approximately double that observed on host DC in patients with MC (average 67% vs 29%; P = .0002) (Figure 2E). Together, these observations show that DC demonstrate a less activated and more tolerogenic phenotype in the setting of MC.
Proportion of Treg to nonregulatory CD4 T cells is increased in patients with MC and comprises equivalent numbers of host and donor-derived cells
We went on to assess potential determinants of peripheral tolerance. Initially, the frequency of CD4+CD25+CD127lowFoxP3+ Treg cells in the CD4 T-cell pool was defined. This value was 4.7% in patients with FC, revealing that effector CD4+ T cells are the dominant population and in keeping with the strong clinical alloreactive immune responses associated with this group.29 In contrast, the proportion of Treg cells in patients with MC was almost double this value at 8.7% (P = .03; Figure 3A). No difference was observed in the absolute number of Treg cells between the 2 groups (Figure 3B), but an inverse correlation was apparent between the number of Treg cells and the percentage of donor chimerism (r = −0.25, P = .04; Figure 3C). PrimeFlow RNA was used to determine the contribution of donor and host cells to the expanded Treg compartment in MC donors (supplemental Figure 2B); we observed comparable numbers of cells from both sources (Figure 3D). Functional analysis showed that Treg production of interleukin-10 and transforming growth factor-β was equivalent between patients with FC and MC (Figure 3E)

Treg cells comprise a larger proportion of the CD4+repertoire in patients with MC. (A) The percentage of CD4+CD25+CD127lowFoxP3+ Treg cells within the CD4+ T-cell pool is shown in relation to chimerism status. Patients with MC demonstrate a higher frequency of Treg cells (8.7%, n = 29) compared with patients with FC (4.7%, n = 35; *P = .03). (B) The absolute number of Treg cells was similar between FC and MC cohorts at 2.6 × 10⁶/mL (n = 35) and 2.7 × 10⁶/mL (n = 29), respectively. (C) The number of Treg cells is inversely correlated to the degree of donor T-cell chimerism. Pearson’s coefficient r = −0.25, *P = .04 (n = 64). (D) The number of host and donor-derived Treg cells within patients with MC calculated using flowRNA probes specific to the KDM5D gene on the Y chromosome. No differences were seen between the 2 groups (n = 11). (E) Interleukin-10 and transforming growth factor-β production by Treg cells from patients with FC and MC. (F) The number of CD4+ T cells within peripheral blood in the first year after transplant in relation to chimerism status. No differences were seen between the 2 groups (FC, n = 35; MC, n = 29). (G) The number of CD8+ T cells within peripheral blood in the first year after transplant in relation to chimerism status. No differences were seen between the 2 groups (FC, n = 35; MC, n = 29). All graphs show the mean and standard error. Analyses were undertaken with 2-tailed Mann-Whitney U tests (A-B) and Wilcoxon matched pairs signed rank test (C).
Treg cells comprise a larger proportion of the CD4+repertoire in patients with MC. (A) The percentage of CD4+CD25+CD127lowFoxP3+ Treg cells within the CD4+ T-cell pool is shown in relation to chimerism status. Patients with MC demonstrate a higher frequency of Treg cells (8.7%, n = 29) compared with patients with FC (4.7%, n = 35; *P = .03). (B) The absolute number of Treg cells was similar between FC and MC cohorts at 2.6 × 10⁶/mL (n = 35) and 2.7 × 10⁶/mL (n = 29), respectively. (C) The number of Treg cells is inversely correlated to the degree of donor T-cell chimerism. Pearson’s coefficient r = −0.25, *P = .04 (n = 64). (D) The number of host and donor-derived Treg cells within patients with MC calculated using flowRNA probes specific to the KDM5D gene on the Y chromosome. No differences were seen between the 2 groups (n = 11). (E) Interleukin-10 and transforming growth factor-β production by Treg cells from patients with FC and MC. (F) The number of CD4+ T cells within peripheral blood in the first year after transplant in relation to chimerism status. No differences were seen between the 2 groups (FC, n = 35; MC, n = 29). (G) The number of CD8+ T cells within peripheral blood in the first year after transplant in relation to chimerism status. No differences were seen between the 2 groups (FC, n = 35; MC, n = 29). All graphs show the mean and standard error. Analyses were undertaken with 2-tailed Mann-Whitney U tests (A-B) and Wilcoxon matched pairs signed rank test (C).
Reconstitution of T cells is comparable in patients with MC and FC
We next assessed the effect of chimerism on the non-Treg T-cell compartment. Serial analyses were performed within individual patients to appraise T-cell reconstitution between 4 weeks and 1 year after transplant. The total number of T cells remained low throughout the posttransplant period (data not shown), but no differences were observed in the magnitude or pattern of CD4+ or CD8+ T-cell reconstitution between the groups (Figure 3F-G). The distribution of CD4+ or CD8+ memory subsets, as determined by CCR7 and CD45RA expression, was also not influenced by chimerism status (supplemental Figure 3).
Treg cells inhibit the killing of host cells in MC
We went on to examine the ability of the expanded Treg pool in MC patients to suppress alloreactive responses in vitro (Figure 4A). T cells were isolated 4 to 8 weeks after transplant, labeled with VCT, and cocultured at a 1:1 ratio with irradiated host HLA-DR+ APC enriched from pretransplant PBMC samples. The relative proportion of surviving “effector” cells (posttransplant T cells) to “target” cells (host APC) was reassessed 5 days later. In MC, APC persisted in coculture with T cells and generated an effector:target ratio of 1:5 in patients with MC because of the relative increased survival of target cells compared with T cells. In contrast, this ratio fell to 1:1.3 in patients with FC (P = .011; Figure 4B). Importantly, negligible T-cell proliferation was observed in either culture over this period (supplemental Figure 2C), and the relative survival of T cells was also equivalent within FC and MC cocultures (supplemental Figure 2B). As such, this difference in the effector:target ratio can be attributed directly to T cell–mediated lysis of the APC population.
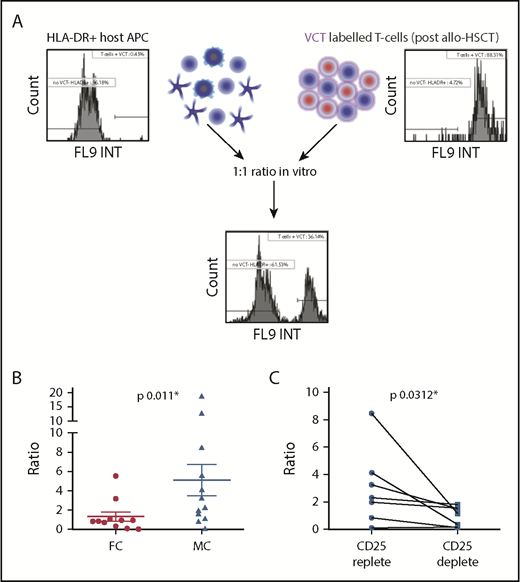
Treg cells limit cytotoxic alloreactive immune responses in the setting of MC. (A) Irradiated host HLA-DR+ APCs were cocultured with responder T cells isolated posttransplant. Cells were cocultured at a ratio of 1:1 for 5 days and then the number of residual live cells was determined by propidium iodide and Accu-Chek counting beads. An index of in vitro cytotoxicity was then defined as the percentage of remaining stimulator host HLA-DR++ cells divided by the percentage of remaining responder T cells. (B) Ratio of host HLA-DR+ cells: post-HSCT T cells, 1.3: 1 in the context of FC compared with 5:1 in the context of MC (*P = .011), indicating that T cells from patients with MC are less able to eliminate HLA-DR++ APCs. The mean and standard error are shown, and analysis was undertaken with a 2-tailed Mann-Whitney U test (FC, n = 11; MC, n = 12). (C) Coculture assays were reestablished from patients with MC following depletion of CD25+ cells (Treg cells) before in vitro culture. The ratio of host HLA-DR++ cells to T cells was significantly decreased, indicating that Treg cells act directly to suppress donor alloreactive cytotoxicity in the context of MC (*P = .0312). The mean and standard error are shown; analysis was undertaken with a Wilcoxon matched pairs signed rank test (n = 7).
Treg cells limit cytotoxic alloreactive immune responses in the setting of MC. (A) Irradiated host HLA-DR+ APCs were cocultured with responder T cells isolated posttransplant. Cells were cocultured at a ratio of 1:1 for 5 days and then the number of residual live cells was determined by propidium iodide and Accu-Chek counting beads. An index of in vitro cytotoxicity was then defined as the percentage of remaining stimulator host HLA-DR++ cells divided by the percentage of remaining responder T cells. (B) Ratio of host HLA-DR+ cells: post-HSCT T cells, 1.3: 1 in the context of FC compared with 5:1 in the context of MC (*P = .011), indicating that T cells from patients with MC are less able to eliminate HLA-DR++ APCs. The mean and standard error are shown, and analysis was undertaken with a 2-tailed Mann-Whitney U test (FC, n = 11; MC, n = 12). (C) Coculture assays were reestablished from patients with MC following depletion of CD25+ cells (Treg cells) before in vitro culture. The ratio of host HLA-DR++ cells to T cells was significantly decreased, indicating that Treg cells act directly to suppress donor alloreactive cytotoxicity in the context of MC (*P = .0312). The mean and standard error are shown; analysis was undertaken with a Wilcoxon matched pairs signed rank test (n = 7).
Cocultures from MC patients contain autologous effector T cells that would not be expected to demonstrate alloreactive recognition. To determine whether Treg cells are actively suppressing alloreactive responses in this patient group, we next depleted CD25+ cells before culture of T-effector cells with host APC. This led to substantially increased lysis of host APC target cells (Figure 4C), indicating that Treg cells do indeed suppress donor alloreactive immune responses in patients with MC. Importantly, CD25+ T-cell depletion before coculture using T cells derived from fully donor patients did not mediate increased killing of target APC (supplemental Figure 2D).
Discussion
MC can provide a robust tolerogenic platform for allogeneic transplantation,3,5 but the mechanisms that regulate immune tolerance in this setting remain unclear. MC of only short-term duration after allo-HSCT may establish tolerance for subsequent kidney transplantation29 ; our study therefore focused on immune regulation in the first 2 months following hemopoietic transplantation when the allogeneic immune response is established.30-34
Priming of the allogeneic immune response is dominated by “direct” host DC stimulation of donor T cells,35 although “indirect” antigen presentation by donor DC can also play a role.36 We observed that DCs are less activated during MC, and this may underlie the associated findings of an increased proportion of regulatory T cells and reduced alloreactive function in this setting. Tolerogenic DC do indeed play a role in limiting the alloreactive response,27 and PD-1/PD-L1 signaling is an important underlying mechanism.37 We also observed that PD-L1 expression is increased on cDC in the setting of MC and that this pattern is specific to the donor-derived cells. This suggests that donor DC may play the major role in regulating allogeneic immune responses during MC and that maturation of effector alloreactive T cells in this setting may arise from direct presentation on host APC.
Morris et al38 have recently used an elegant approach based on T-cell receptor sequence analysis of alloreactive T cells to demonstrate that alloreactive cells are eliminated in patients with MC, but it is important to note that this effect was not seen until 6 months posttransplant.
These findings suggest an important role for peripheral tolerance mediated by Treg cells in MC, particularly early following transplant. This concept is supported by animal models that show that either host or donor-derived Treg cells can facilitate hemopoietic stem cell engraftment,39 and that the adoptive transfer of Treg cells directly facilitates bone marrow engraftment in reduced-intensity protocols.40 Nonhuman primate models have also shown that Treg cells are required to establish tolerance following nonmyeloablative conditioning regimens.5,41 Clinically, T-cell function is deliberately modulated early posttransplant to prevent severe GVHD, and increased exposure to cyclosporin in the first 21 days after transplant is an independent risk factor for relapse.40 However, we did not observe a difference in the average area under the curve of trough cyclosporin level according to chimerism (supplemental Figure 4), suggesting that the differences we observed in MC occur in the presence of immunosuppression.
We observed a twofold increase in Treg cells to non-Treg CD4 T cells in patients with MC compared with those who were fully donor. Importantly, both host and donor cells contributed to this population, suggesting that the presence of residual host Treg cells may play a pivotal role in maintaining chimeric tolerance. Indeed, attenuation of antitumor responses by residual host Treg cells has been previously demonstrated42,43 and indicates their potential potency in regulation of alloreactive immunity. In contrast, murine and clinical studies involving the adoptive transfer of donor Treg cells show that these can suppress GVHD while maintaining graft-versus-leukemia responses.44-46 Similarly, in our study, patients with MC exhibited a 3.5-fold increased risk of disease relapse (supplemental Figure 5B; P < .001) and a reciprocal threefold decreased risk of acute GVHD (supplemental Figure 5C; P = .005), although the cohort was too small to permit meaningful multivariate analysis. Nevertheless, the association between MC and increased risk of disease relapse has not been seen in all studies, and our findings suggest that the relative contribution of host and donor Treg cells may be an additional factor to consider in this regard.
The Treg cells present after transplant might derive from recent thymic emigration5 or peripheral conversion from T-effector cells. Interestingly, alemtuzumab can drive the generation of Treg cells in vitro, and T-cell immune reconstitution following alemtuzumab therapy is characterized by early expansion of Treg cells.47-49 As such, its incorporation within the conditioning protocol may well provide a direct explanation for the relatively high incidence of MC in the patient cohort.
Overall, our data support a model whereby MC is characterized by the retention of host DC and Treg cells, which in turn limit donor DC activation and promote a tolerogenic phenotype. Subsequent alloreactive T-cell responses generated from naive donor T cells are not fully activated and, in combination with active Treg cell suppression, the allogeneic immune response is inhibited (Figure 5). It will be important in future studies to assess the effect of these factors on chimerism within other immune subsets such as natural killer and B cells.
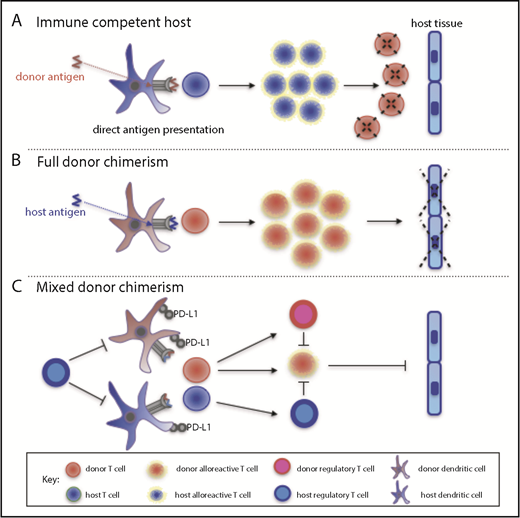
A model for the maintenance of MC following allo-HSCT. (A) In an immunocompetent host, donor cells are processed by host DC and presented to host T cells, which then eliminate residual donor cells. This scenario can occur following entry of fetal cells into the maternal circulation during pregnancy or during rejection of solid organ grafts. (B) In the setting of profound host immune suppression following allo-HSCT, all host T cells are eliminated by conditioning so that a host alloreactive response to donor cells is abrogated. Instead, donor T cells recognize host peptide/major histocompatibility complex complexes on DC; this alloreactive response leads to both GVHD and the graft-versus-leukemia effect. (C) MC may be established in the setting of moderate host immune suppression following allo-HSCT. Here, residual host Treg cells may limit the activation of DCs, which then fail to induce a cytotoxic allogeneic immune response by donor T cells. Propagation of the allogeneic immune response is inhibited further by the presence of donor Treg and donor DCs that are rendered tolerogenic.
A model for the maintenance of MC following allo-HSCT. (A) In an immunocompetent host, donor cells are processed by host DC and presented to host T cells, which then eliminate residual donor cells. This scenario can occur following entry of fetal cells into the maternal circulation during pregnancy or during rejection of solid organ grafts. (B) In the setting of profound host immune suppression following allo-HSCT, all host T cells are eliminated by conditioning so that a host alloreactive response to donor cells is abrogated. Instead, donor T cells recognize host peptide/major histocompatibility complex complexes on DC; this alloreactive response leads to both GVHD and the graft-versus-leukemia effect. (C) MC may be established in the setting of moderate host immune suppression following allo-HSCT. Here, residual host Treg cells may limit the activation of DCs, which then fail to induce a cytotoxic allogeneic immune response by donor T cells. Propagation of the allogeneic immune response is inhibited further by the presence of donor Treg and donor DCs that are rendered tolerogenic.
A striking finding in our study was that alloreactive T-cell elimination of host cells in vitro was less effective in the setting of MC but was fully restored following the depletion of Treg cells. This provides strong support for the concept of active suppression of alloimmune responses in MC following allo-HSCT and raises a number of potential therapeutic options. Therapeutic conversion to FC is considered important in patients with stable MC to limit disease relapse. This is usually attempted through the delivery of donor leukocyte infusions,30,50,51 but our findings suggest that targeting the DC compartment, potentially with PD-L1 blockade, might also boost donor allogeneic immune responses and that the elimination of Treg cells through agents such as anti-CD25 antibodies might also prove effective. In addition, although our studies were performed in patients following hemopoietic transplantation, a degree of MC is seen in many patients following solid organ transplantation; these observations might also be instructive in that setting.
The full-text version of this article contains a data supplement.
Acknowledgments
The authors thank Claire Shannon-Lowe for her support in establishing the Prime-Flow RNA technique.
This study was funded by Bloodwise (grant 12052) and the Medical Research Council UK (grant RRAK17205).
Authorship
Contribution: F.A.M.K. designed and performed all research, analyzed, and interpreted data; performed statistical analyses; and wrote the manuscript; J.Z. assisted in data interpretation and wrote the manuscript; C.F.I., H.P., L.M., Y.L.T.C., and S.E.E. assisted in data interpretation and reviewed the manuscript; J.N., Y.L.T.C., and S.N. consented patients, collected samples, collected clinical data, and reviewed the manuscript; M.G. provided chimerism analyses for the cohort and reviewed the manuscript; C.C. and R.M. assisted in data interpretation, had clinical responsibility for the clinical cohort, and reviewed the manuscript; and P.M. designed research, interpreted data, and wrote the manuscript.
Conflict-of-interest disclosure: M.G. has been paid honoraria by the following for-profit companies: Pfizer, Ariad, Celgene, and Labcentrics; he has been compensated for his scientific advisory role by Oxford Gene Technology and Ariad; and declares research funding for the West Midlands Regional Genetics Laboratory from Novartis, Ariad, Celgene, Affymetrix, and Oxford Gene Technology (none of which was used for this study). The remaining authors declare no competing financial interests.
Correspondence: Francesca A. M. Kinsella, College of Medical and Dental Sciences, University of Birmingham and Birmingham Health Partners, Vincent Dr, Edgbaston, Birmingham B15 2TT, United Kingdom; e-mail: f.a.m.kinsella@bham.ac.uk; and Paul Moss, College of Medical and Dental Sciences, University of Birmingham and Birmingham Health Partners, Vincent Dr, Edgbaston, Birmingham B15 2TT, United Kingdom; e-mail: p.moss@bham.ac.uk.

