

Key Points
The machine learning algorithms produced clinically reasonable and robust risk stratification scores for aGVHD.
Predicting scores for aGVHD also demonstrated the link between risk of development of aGVHD and overall survival after HSCT.

Abstract
Acute graft-versus-host disease (aGVHD) is 1 of the critical complications that often occurs following allogeneic hematopoietic stem cell transplantation (HSCT). Thus far, various types of prediction scores have been created using statistical calculations. The primary objective of this study was to establish and validate the machine learning–dependent index for predicting aGVHD. This was a retrospective cohort study that involved analyzing databases of adult HSCT patients in Japan. The alternating decision tree (ADTree) machine learning algorithm was applied to develop models using the training cohort (70%). The ADTree algorithm was confirmed using the hazard model on data from the validation cohort (30%). Data from 26 695 HSCT patients transplanted from allogeneic donors between 1992 and 2016 were included in this study. The cumulative incidence of aGVHD was 42.8%. Of >40 variables considered, 15 were adapted into a model for aGVHD prediction. The model was tested in the validation cohort, and the incidence of aGVHD was clearly stratified according to the categorized ADTree scores; the cumulative incidence of aGVHD was 29.0% for low risk and 58.7% for high risk (hazard ratio, 2.57). Predicting scores for aGVHD also demonstrated the link between the risk of development aGVHD and overall survival after HSCT. The machine learning algorithms produced clinically reasonable and robust risk stratification scores. The relatively high reproducibility and low impacts from the interactions among the variables indicate that the ADTree algorithm, along with the other data-mining approaches, may provide tools for establishing risk score.
Introduction
Allogeneic hematopoietic stem cell transplantation (HSCT) is a potentially curative therapeutic option for malignant or nonmalignant hematological diseases. However, the incidence of transplant-related mortality (TRM) is as high as 30% among HSCT patients.1 Acute graft-versus-host disease (aGVHD) is 1 of the most critical complications that may occur following HSCT.2 Traditional statistics, such as Cox’s proportional hazard models and logistic regressions (LRs), have been used to create various types of prediction scores to alert clinicians about whether a patient is at risk for developing severe aGVHD. Various predictive scoring systems3,4 have been created to distinguish these higher-risk patients from low-risk HSCT patients. However, the predictive accuracy of these systems is still suboptimal, and they are often unavailable to the clinicians who need to use them.
Recent progress in the field of machine learning algorithms, which are included as part of a data mining approach, may change the procedures used to analyze large and complex HSCT registry datasets. Machine learning is a data-driven analytic approach integrating multiple risk factors into a predictive tool.5 The paradigm underlying machine learning does not start with a predefined model; rather, it lets the data create the model according to the underlying pattern.6 One advantage of predictive models created by machine learning models is the elimination of the effect of selection bias in choosing variables. Furthermore, it also accounts for interaction and confounding factors, which cannot be completely adjusted for or eliminated using conventional statistics,7 meaning that these new models are expected to be more accurate and reliable. Research groups from Europe and China have tried to use machine leaning to create algorithms for predicting total survival and relapse among acute leukemia patients using relatively uniform databases.8-10 However, it remains to be seen whether machine leaning may be used to predict complications of HSCT using data from an entire registry database.
We used machine learning algorithms to establish a model for predicting the risk of aGVHD using pre-HSCT parameters obtained from a nationwide dataset in Japan. The primary objective of this study was to establish and validate this model for predicting aGVHD (grades II-IV and III-IV). We expected that our results could provide a clinically useful model for predicting aGVHD risk and demonstrate the utility of machine learning in future registry studies.
Methods
Inclusion and exclusion criteria
Data on adult patients (age ≥ 16 years) with malignant and nonmalignant hematological diseases who underwent allogeneic HSCT between 1 January 1992 and 31 December 2016 were obtained through the Japanese Transplant Registry Unified Management Program11,12 sponsored by the Japan Society for Hematopoietic Cell Transplantation and Japanese Data Center for Hematopoietic Cell Transplantation. Those patients were excluded if information about HLA mismatch, aGVHD grade, or clinical outcomes (dead or alive) was missing. Our protocol, which complied with the Declaration of Helsinki, was approved by the Ethics Committee of Kyoto University and the Japanese Data Center for Hematopoietic Cell Transplantation. Patient information is anonymized, and the patients consented to provide the data to the data center prior to performing the study.
Data collection and definition of each covariate
From the registry database, we extracted data on every pretransplant characteristic (supplemental Table 1), along with data on posttransplant aGVHD grade and prognoses. Patients were divided into standard- and advanced-risk groups according to earlier criteria for determining disease risk.13,14 Disparities in HLA-A, HLA-B, and HLA-DR antigens were determined at the serologic level from relatives and cord blood transplants. In unrelated bone marrow transplants, 8 antigens, including HLA-C, were examined at the allele level; a 6/6 or 8/8 match was considered HLA matched.1,15 Patients and donors were categorized into 2 groups based on their age (younger vs older than the median). For females, the data on their parity were not included in the dataset.
Diagnosis and classification of aGVHD cases were performed by the attending physicians at each center based on conventional criteria.16
Machine learning algorithms
Predictive models for aGVHD (grade II-IV and III-IV) were developed using 5 machine learning algorithms: Naive Bayse (NB) and alternating decision tree (ADTree) as algorithms providing interpretable structures, along with multilayer perceptron (MLP), random forest (RF), and adaptive boosting (AdaBoost) as algorithms providing only opaque connections between variables and responses (“black box” models).6,9,17-21
For each algorithm, a prediction model was trained and tested using 10-fold cross-validation. The performance of each model was evaluated by quantifying the area under the receiver operator characteristic curves (AUCs)22,23 using the validation cohort. The best models, or those that provided the largest AUCs, were analyzed further. Detailed algorithms for NB, MLP, RF, and AdaBoost are shown in supplemental Methods, whereas the algorithm for ADTree is shown in the next section.
ADTree
ADTree is a machine learning algorithm designed for prediction19 ; it generates alternating levels of prediction (shown as rectangles in figures) and decision nodes (shown as ellipses). Each prediction node has been given a weight, which represents its contribution to the final score.
Creating predictive models with ADTree involves pursuing multiple paths. To calculate the score, one starts at the root and proceeds along multiple paths down the tree as follows: if the node is a prediction node, proceed along all the edges starting from it; if the node is a decision node, proceed along the edge corresponding to the patient characteristics. The cumulative score gathered by the patient is the sum of the prediction values along all paths that the patient traverses in the decision tree.20 Higher scores are designed to be associated with expectedly higher incidences of aGVHD.
Model development and validation
The ADTree algorithm was used to create the predictive model using the training cohort (randomly selected patients making up 70% of the entire cohort). Validation was performed by testing this model on the validation cohort (consisting of 30% of the entire cohort) using conventional statistical methods.1,15 Overall survival (OS) was calculated with the Kaplan-Meier method and compared using the Cox proportional-hazards model according to the aGVHD predictive scores determined by the ADTree algorithm. The cumulative incidence of aGVHD was calculated using Gray’s method while considering relapse and death as competing risks.24 The Fine-Gray proportional-hazards model was used to compare the incidence of aGVHD with the aGVHD predictive scores that were determined by the machine learning.25 TRM was calculated considering relapse as a competing risk.1,26 Data in the database were fixed in September of 2017. WEKA (version 3.8; The University of Waikato, Wakaito, New Zealand) and Stata (version 13.1; Stata Corp., College Station, TX) software packages were used to analyze data. The α level for all tests was set to 0.05, and P < .05 was considered statistically significant.
Results
Patient characteristics
We included only patients who fulfilled the eligibility criteria, not satisfying the exclusion criteria shown in Methods, and evaluated 26 695 patients with malignant (n = 25 329) and nonmalignant (n = 1366) diseases between 16 and 69 years of age (median, 45 years), who underwent allogeneic HSCT between 1992 and 2016 (Table 1). The median follow-up period for survivors was 58.7 months (range, 1.4-306.6) after HSCT. Pretransplant patient characteristics that were included in the predictive models are shown in supplemental Table 1. Of the entire cohort, 70% of the patients were randomly selected for inclusion in the training cohort, which was used to build the predictive models. The remaining 30% of patients were placed in the validation cohort, which was used to confirm the model using conventional (machine learning–independent) statistical calculations. There were no significant differences between the training and validation cohorts in terms of the pretransplant characteristics (supplemental Table 2). The missing values for performance status (PS) and hematopoietic cell transplant comorbidity index (HCT-CI) were treated as independent categories (“Not available”). In all, 60.8% (n = 16 230) of all of the patients (n = 26 695) had data available for all of relevant variables shown in supplemental Table 1.
Patient characteristics (N = 26 695)
| Variables | Data |
|---|---|
| Sex | |
| Female | 11 113 (41.6) |
| Male | 15 578 (58.3) |
| Age, y | |
| Median | 45 |
| Range | 16-69 |
| PS | |
| 0-1 | 21 567 (80.8) |
| ≥2 | 1 638 (6.1) |
| Missing | 3 490 (13.1) |
| HCT-CI | |
| ≤2 | 14 906 (55.8) |
| ≥3 | 2 275 (8.5) |
| Missing | 9 514 (35.7) |
| Disease | |
| AML/MDS | 13 613 (51.0) |
| ALL | 5 129 (19.2) |
| ATL | 1 153 (4.3) |
| CML | 2 141 (8.0) |
| NHL | 2 218 (8.3) |
| AA | 1 024 (3.9) |
| Other | 1 417 (5.3) |
| Disease risk | |
| Standard | 14 088 (52.7) |
| High | 12 607 (47.2) |
| Pretransplant therapy period, mo | |
| Median | 8.2 |
| Range | 1.2-779.3 |
| Donor source | |
| Rel-BM | 4 899 (18.4) |
| Rel-PB | 5 389 (20.2) |
| UR-BM | 10 801 (40.5) |
| UR-CB | 5 425 (20.3) |
| HLA mismatch | |
| No | 13 969 (52.3) |
| Yes | 12 726 (47.7) |
| Sex mismatch | |
| No | 13 136 (49.2) |
| M to F | 5 729 (21.4) |
| F to M | 5 657 (21.1) |
| ABO mismatch | |
| No | 12 060 (45.1) |
| Minor | 5 169 (19.3) |
| Major | 4 694 (17.5) |
| Both | 2 408 (9.0) |
| Conditioning regimens | |
| MAC | 16 480 (61.7) |
| RIC | 8 277 (31.0) |
| GVHD prophylaxis | |
| CyA based | 12 612 (47.2) |
| Tac based | 14 083 (52.8) |
| Follow-up period, mo | |
| Median | 58.7 |
| Range | 1.4-306.6 |
| Transplant year | |
| 2008 or before | 12 495 (46.8) |
| 2009 or later | 14 200 (53.2) |
Unless otherwise indicated, data are n (%).
AA, aplastic anemia; ALL, acute lymphoblastic leukemia; AML, acute myelogenous leukemia; ATL, adult T-cell lymphoma/leukemia; CML, chronic myelogenous leukemia; CyA, cyclosporine; F, female; GVHD, graft-versus-host disease; M, male; MAC, myeloablative conditioning; MDS, myelodysplastic syndrome; NHL, non-Hodgkin lymphoma; Rel-BM, bone marrow from relative; Rel-PB, peripheral blood stem cells from relative; RIC, reduced-intensity conditioning; Tac, tacrolimus; UR-BM, bone marrow from unrelated donor; UR-CB, cord blood from unrelated donor.
In total, grade II-IV aGVHD was observed among 42.6% of all patients (n = 11 380/26 695) on day 27 (in median) after HSCT, while grade III-IV aGVHD was noted in 17.1% of all patients (n = 4554) on day 29 (in median) after HSCT. Severe aGVHD (grade III-IV) was directly related to the TRM (n = 2645; 58.0% of patients with grade III-IV aGVHD). Overall, 849 patients of these patients died of aGVHD (18.6%).
Comparison of predictive models
Prediction models for grade II-IV and grade III-IV aGVHD were developed using 5 major machine learning algorithms and 1 classical algorithm (LR) based on the randomly selected training cohort dataset (n = 18 645). The ranking of the importance of each variable responsible for the model was calculated (supplemental Figure 1); HLA mismatch and HSCT type were the most essential variables for predicting the incidence of aGVHD. AUCs for predictive models ranged from 0.558 to 0.616 for grade II-IV aGVHD and from 0.566 to 0.622 for grade III-IV aGVHD in the validation cohort (Table 2). In both cases, the ADTree model gave the best predictive performances; therefore, it was used for subsequent analyses.
Performance of each machine learning model and 1 classical statistical model according to the AUCs in the validation cohort
| Model | AUCs | |
|---|---|---|
| Grade II-IV | Grade III-IV | |
| NB | 0.604 | 0.622 |
| ADTree | 0.616 | 0.622 |
| MLP | 0.576 | 0.566 |
| RF | 0.558 | 0.593 |
| AdaBoost | 0.597 | 0.611 |
| LR | 0.562 | 0.539 |
| Model | AUCs | |
|---|---|---|
| Grade II-IV | Grade III-IV | |
| NB | 0.604 | 0.622 |
| ADTree | 0.616 | 0.622 |
| MLP | 0.576 | 0.566 |
| RF | 0.558 | 0.593 |
| AdaBoost | 0.597 | 0.611 |
| LR | 0.562 | 0.539 |
ADTree model output
According to the predictive power for each machine learning algorithm (Table 2), the ADTree was used to develop predictive models for aGVHD grade II-IV and III-IV using the training dataset (final number of variables was set at 15). The prediction model, consisting of a smaller number of variables, demonstrated a lower AUC (for grade II-IV aGVHD: 0.616 with 15 variables, 0.611 with 10 variables, and 0.586 with 5 variables). The ADTree algorithm was applied to the training cohort, and parameters were optimized through 10-fold cross-validation.8 The ADTree prediction models that were created are shown in Figure 1. For grade II-IV aGVHD (Figure 1A), HLA disparity, initial diagnosis, and donor age were selected as the first decision nodes, followed by patient sex, sex mismatch, donor source, disease risk, body mass index, conditioning regimen, graft-versus-host disease (GVHD) prophylaxis, HCT-CI, and so forth. The following variables were included in the ADTree model for predicting grade III-IV aGVHD (Figure 1B): disease risk, HLA disparity, donor source, donor age, usage of irradiation, diagnosis, and period between the diagnosis and HSCT. Patient age was not selected as a significant variable in either model. As shown in Methods, patient age was treated as a binary variable (younger vs older than the median) to reduce the calculation burden to build the model; even if patient age were treated as a continuous variable or more granular categorical variable (per decades), it was not included in the final ADTree model. The year of HSCT also was not included in the final models; the subgroup analyses, including only HSCT in the modern era (2006 or after), yielded similar models composed of the same variables.
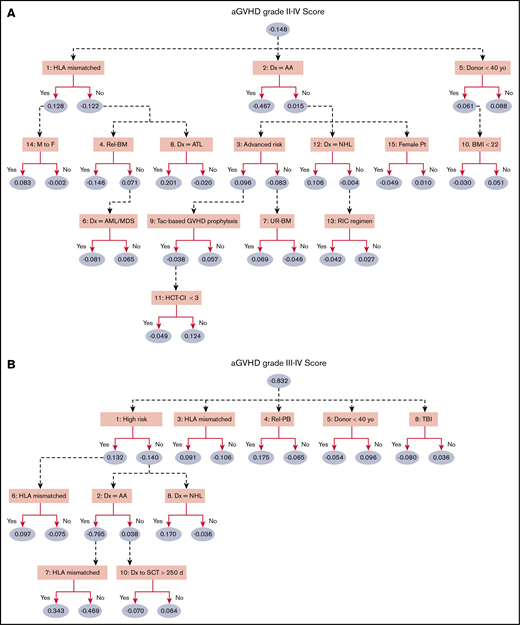
ADTree predictive model of aGVHD. The ADTree consists of various levels of prediction (ellipses) and decision nodes (rectangles). Each prediction node is associated with a weight, representing its contribution to the cumulative prediction score (the larger scores indicate higher incidence of aGVHD), whereas each decision node contains a splitting attribute. Variables are not mutually exclusive. Patients traverse the tree according to their pretransplant characteristics (ie, variable values), and the cumulative scores for grade II-IV aGVHD (A) and grade III-IV aGVHD (B) are calculated. Numbers that appear before the variable names indicate the rankings in ADTree. AA, aplastic anemia; AML/MDS, acute myeloid leukemia or myelodysplastic syndrome; ATL, adult T-cell leukemia/lymphoma; BMI, body mass index; Dx, diagnosis; M to F, male donor to female recipient; Rel-BM, bone marrow from relatives; NHL, non-Hodgkin lymphoma; Pt, patient; Rel-PB, peripheral blood stem cell from relatives; RIC, reduced-intensity conditioning regimen; SCT, stem cell transplantation; Tac, tacrolimus; TBI, total body irradiation; UR-BM, bone marrow from unrelated donor; yo, years old.
ADTree predictive model of aGVHD. The ADTree consists of various levels of prediction (ellipses) and decision nodes (rectangles). Each prediction node is associated with a weight, representing its contribution to the cumulative prediction score (the larger scores indicate higher incidence of aGVHD), whereas each decision node contains a splitting attribute. Variables are not mutually exclusive. Patients traverse the tree according to their pretransplant characteristics (ie, variable values), and the cumulative scores for grade II-IV aGVHD (A) and grade III-IV aGVHD (B) are calculated. Numbers that appear before the variable names indicate the rankings in ADTree. AA, aplastic anemia; AML/MDS, acute myeloid leukemia or myelodysplastic syndrome; ATL, adult T-cell leukemia/lymphoma; BMI, body mass index; Dx, diagnosis; M to F, male donor to female recipient; Rel-BM, bone marrow from relatives; NHL, non-Hodgkin lymphoma; Pt, patient; Rel-PB, peripheral blood stem cell from relatives; RIC, reduced-intensity conditioning regimen; SCT, stem cell transplantation; Tac, tacrolimus; TBI, total body irradiation; UR-BM, bone marrow from unrelated donor; yo, years old.
Some interactions between variables were discovered by the ADTree algorithm. For instance, HSCT for female patients receiving grafts from male donors was a risk factor for aGVHD grade II-IV only if there was also an HLA mismatch (Figure 1A). Additionally, the risk of developing aGVHD among patients with aplastic anemia was strongly influenced by HLA mismatch but was not affected by the period between disease onset and HSCT (Figure 1B).
The conventional LR model constructed as a comparison revealed that donor type (unrelated donors compared with the relatives), male sex, poor PS, conditioning regimen, GVHD prophylaxis, HLA and sex mismatch, and advanced disease were significant risk factors for grades II-IV and III-IV GVHD (data not shown).
Validations
Prediction scores for each patient in the validation cohort (n = 8050) were calculated according to the ADTree algorithm, and distributions are shown in Figure 2. For grade II-IV aGVHD, scores were distributed from −0.995 to 0.405 (median, −0.148; Figure 2A). This cohort was divided equally into 5 groups based on the score: low-risk group (Low; range, −0.995 to −0.433; median −0.516; n = 1595), low-intermediate risk group (Low-Int; range, −0.430 to −0.217; median, −0.315; n = 1573), intermediate-risk group (Int; range, −0.212 to −0.092; median, −0.156; n = 1661), high-intermediate risk group (High-Int; range, −0.092 to 0.030; median, −0.033; N = 1581), and high-risk group (High; range, 0.031-0.405; median, 0.112; n = 1640) (Figure 2A). The distribution of scores for aGVHD grade III-IV is also displayed in Figure 2B. The distribution was determined using the same method (ie, equal division into 5 groups based on the score: Low, Low-Int, Int, High-Int, and High).
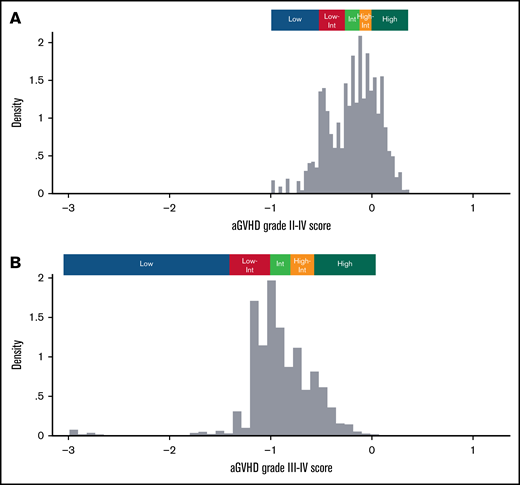
Distribution of aGVHD scores in the validation cohort. Distributions of aGVHD prediction scores calculated by the ADTree model are displayed for grade II-IV aGVHD (A) and grade III-IV aGVHD (B) among patients in the validation cohort (n = 8050). Higher values indicate a higher risk for developing aGVHD.
Distribution of aGVHD scores in the validation cohort. Distributions of aGVHD prediction scores calculated by the ADTree model are displayed for grade II-IV aGVHD (A) and grade III-IV aGVHD (B) among patients in the validation cohort (n = 8050). Higher values indicate a higher risk for developing aGVHD.
The incidence of aGVHD (for grade II-IV and grade III-IV) was calculated and compared among the 5 subgroups for aGVHD risk using conventional statistical techniques (competitive hazard risk models), along with OS and TRM (Figure 3; Table 3). For grade II-IV, the incidence of aGVHD was stratified according to each risk group. There was a remarkably high incidence of aGVHD among patients sorted into the High-risk group compared with patients in the other groups (Figure 3A; Table 3; hazard ratio [HR], 2.57 vs Low-risk group; P < .01). The probability of grade II-IV aGVHD and 95% confidence intervals (CIs) were estimated in the validation cohort (supplemental Figure 2A). OS decreased as the risk of aGVHD increased, probably because of the higher incidence of TRM (Figure 3B-C; Table 3; HR, 2.23 and 2.06 in the High-risk and Low-risk groups, respectively). There was a significant relationship between the raw values of the prediction score (continuous variables) and the higher incidence of aGVHD, higher TRM, and inferior OS, which were calculated using conventional Gray-Fine or Cox proportional-hazard models (supplemental Table 3).
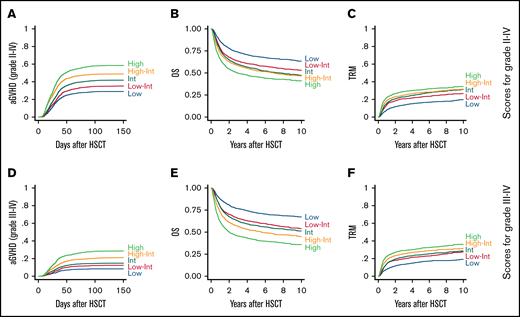
Incidence of aGVHD, OS, and TRM according to aGVHD scores in the validation cohort. (A) The cumulative incidence of grade II-IV aGVHD among the validation cohort (n = 8050) is shown according to each risk group for grade II-IV aGVHD (Low, n = 1595; Low-Int, n = 1573; Int, n = 1661; High-Int, n = 1581; High, n = 1640). OS (B) and TRM (C) calculated for the same subgroups. (D) The cumulative incidence of grade III-IV aGVHD among the validation cohort is shown according to each risk group for grade III-IV aGVHD (Low, n = 1304, Low-Int, n = 1603; Int, n = 1922; High-Int, n = 1598; High, n = 1623). OS (E) and TRM (F) calculated for the same subgroups.
Incidence of aGVHD, OS, and TRM according to aGVHD scores in the validation cohort. (A) The cumulative incidence of grade II-IV aGVHD among the validation cohort (n = 8050) is shown according to each risk group for grade II-IV aGVHD (Low, n = 1595; Low-Int, n = 1573; Int, n = 1661; High-Int, n = 1581; High, n = 1640). OS (B) and TRM (C) calculated for the same subgroups. (D) The cumulative incidence of grade III-IV aGVHD among the validation cohort is shown according to each risk group for grade III-IV aGVHD (Low, n = 1304, Low-Int, n = 1603; Int, n = 1922; High-Int, n = 1598; High, n = 1623). OS (E) and TRM (F) calculated for the same subgroups.
Validation analysis of predictive score by ADTree
| Risk group | aGVHD | Overall mortality | TRM | ||||||
|---|---|---|---|---|---|---|---|---|---|
| HR | 95% CI | P | HR | 95% CI | P | HR | 95% CI | P | |
| Grade II-IV | |||||||||
| Low | Reference | Reference | Reference | ||||||
| Low-Int | 1.26 | 1.11-1.42 | <.01* | 1.45 | 1.28-1.62 | <.01* | 1.42 | 1.21-1.66 | <.01* |
| Int | 1.57 | 1.39-1.76 | <.01* | 1.66 | 1.48-1.86 | <.01* | 1.62 | 1.40-1.89 | <.01* |
| High-Int | 2.00 | 1.78-2.24 | <.01* | 1.78 | 1.58-1.99 | <.01* | 1.77 | 1.54-2.06 | <.01* |
| High | 2.57 | 2.30-2.87 | <.01* | 2.23 | 2.00-2.49 | <.01* | 2.06 | 1.78-2.39 | <.01* |
| Grade III-IV | |||||||||
| Low | Reference | Reference | Reference | ||||||
| Low-Int | 1.52 | 1.20-1.93 | <.01* | 1.56 | 1.37-1.77 | <.01* | 1.42 | 1.20-1.67 | <.01* |
| Int | 1.85 | 1.48-2.31 | <.01* | 1.71 | 1.51-1.94 | <.01* | 1.51 | 1.29-1.78 | <.01* |
| High-Int | 2.72 | 2.19-3.38 | <.01* | 2.11 | 1.86-2.39 | <.01* | 1.78 | 1.51-2.09 | <.01* |
| High | 3.87 | 3.13-4.78 | <.01* | 2.93 | 2.60-3.31 | <.01* | 2.09 | 1.78-2.45 | <.01* |
Statistically significant.
The incidence of grade III-IV aGVHD was also stratified among subgroups (Figure 3D; Table 3; HR, 3.87, High-risk vs Low-risk groups; P < .01). The probability of grade III-IV aGVHD and 95% CIs were also estimated in the validation cohort (supplemental Figure 2B). The correlation between grade III-IV GVHD prediction score and OS was more pronounced (Figure 3E), most likely as a result of the higher incidence of TRM among the higher-risk patients (Figure 3F). There was also a significant relationship between the prediction values (raw scores) and the higher incidence of aGVHD, higher TRM, and inferior OS (supplemental Table 3).
Discussion
This machine learning–guided retrospective cohort study investigating risk prediction scores for aGVHD revealed 2 major findings: ADTree provided the most accurate predictive model for aGVHD among various machine learning algorithms, and the established ADTree model clearly distinguished among 5 subgroups, based on the incidence of aGVHD, which was closely related to OS rates and the incidence of TRM. This study marked the first time that machine learning has been used to predict the risk of aGVHD.
No standard procedures have been established for evaluating and selecting which machine learning models are appropriate for use in registry database analyses.8 A report from the European Society for Blood and Marrow Transplantation (EBMT) showed that the ADTree model was selected without comparing its power of prediction with other machine learning models.8 Another study compared various machine learning models, such as ADTree, LR, MLP, NB, and RF. That study concluded that ADTree was the second best model (after LR) in terms of predicting early TRM.9 We used ADTree to create our prediction model because it showed the highest AUC for GVHD prediction. As many as 15 variables were included in the model to create the most precise prediction; the lower number of variables was related to the inferior accuracy, although the study from EBMT successfully established the overall mortality model using 10 variables.8 The prediction of GVHD might be more difficult than that of total mortality, which required the higher number of variables. Furthermore, the visually comprehensive structure of ADTree makes it an optimal model for use in the medical field compared with other models like MLP, which is composed of the “black box” process and does not a provide clear calculation process.9
In addition to demonstrating the strongest power of prediction and an easy-to-understand structure, an important advantage of the ADTree algorithm is its ability to detect interactions between variables. For instance, our ADTree-based model discovered an interaction between sex mismatch and HLA mismatch. HSCT involving female patients with male donors was known not to be associated with poorer prognosis,27 but the present study revealed that this effect of higher aGVHD risk in male-to-female HSCT was apparent only in the setting of HLA-mismatched HSCT. In the previous study from Europe, Gahrton et al28 reported that female-to-female HSCT had a significantly lower nonrelapse mortality and better OS compared with male-to-female HSCT. Their report did not show significant differences in the incidence of GVHD, and our study is the first to report this point. Unfortunately, already-established biological data cannot interpret this phenomenon; therefore, we expect that our findings can generate new biological studies of sex-related minor histocompatibility antigens (eg, to explain this phenomenon). As another example, HLA disparity, which is a major contributing factor for aGVHD, had the largest effect among aplastic anemia patients. These data demonstrate the importance of deliberately selecting donors for aplastic anemia patients, even if that increases the time spent on donor coordination. The ADTree-based model revealed that the period between disease onset and HSCT was irrelevant to predicting aGVHD risk among these patients. The ADTree model is adept at identifying specific characteristics of unique subpopulations, whereas these characteristics are usually neglected in conventional statistical analyses.29 Compared with the conventional model (eg, LR), ADTree did not find “brand new risk factors” for GVHD; however, a more accurate (higher AUC) and interaction-familiar prediction model was provided.
To take full advantage of machine learning models, it is important to know how to manipulate raw data generated from this technique. In this study, we stratified aGVHD risk scores (continuous variables) into 5 subgroups (categorical variables) to evaluate the expected hazards among each group. Because it is difficult to use raw prediction scores to evaluate aGVHD risk in the clinical field, the expected hazards in each stratified group can give the attending physicians more comprehensive clues for determining the risk of aGVHD during selection of donor graft selections, determining aGVHD prophylaxis regimens, and, moreover, identifying rapid diagnostic or therapeutic interventions in higher-risk subgroups. Translating the raw scores into subcategories might lead to the loss of important clinical information,8 but we suspect that categorization may be necessary to allow this model to be used in making clinical decisions. Division into 5 subgroups was adopted in this study to allow for the most accurate analysis using a database that included a large number of patients; division into 3 subgroups may identify the differentiated risk groups more clearly; however, this “rough prediction” provides only a limited prediction capacity and can be less informative in the clinical field.
The present study revealed the utility of machine learning as a prognostic tool for aGVHD after allogeneic HSCT. Using 10-fold internal cross-validation guaranteed the robustness of the established predictive model,9 and using machine learning prevented any bias from researchers in terms of variable selection and statistical calculations. However, there are some limitations to this study that must be addressed. For instance, we treated HLA disparity between donors and recipients as binary data (ie, mismatched or matched); however, the degree of HLA disparity may not be equivalent between each combination of raw HLA data. For example, the difference between HLA-A02:01 and HLA-A02:02 may not always be the same as that between HLA-A02:01 and HLA-A11:01, although there is very little biological data to support this view.30 Including all data for HLA antigen or allele combination in the model requires a larger number of patients/donors and will significantly increase the burden of calculation. Once this limitation is overcome in the future, this model will provide more information on how the degree of HLA disparity affects the risk of aGVHD. Nevertheless, our analysis is valid as long as each combination of HLA mismatch is reasonably categorized.
Another limitation is that our outcome measure, the incidence of aGVHD, was also treated as a binary variable in all of the machine learning models that we used in this study. Information on the onset time for cases of aGVHD was not included in the process of model building, even though onset data were included in multivariate statistical models during validation analyses. To our knowledge, no machine learning model has succeeded in handling the time-dependent outcomes. In this study, the onset of aGVHD is limited to a small window (usually 30-100 days after HSCT); therefore, the effect of dismissing information regarding the time of onset is suboptimal.
Overfitting is the conventionally discussed limitation in machine learning,31 and our algorithm is not completely free of this limitation, even though we limited the number of variables to 15 in our model. Therefore, international validations (using EBMT or Center for International Blood and Marrow Transplant Research cohorts in the current system) should be performed in the future. Comparing our model with the EBMT or Center for International Blood and Marrow Transplant Research model, which can be established with the same method using their cohort, can be the strongest validation and provide scientifically essential discussion.
In conclusion, we demonstrated the feasibility of using machine learning algorithms to predict aGVHD. ADTree established a clinically reasonable and accurate predictive model using a nationwide transplant database in Japan. This study will be helpful in establishing various other prognostic predictive models in the field of HSCT, as well as using machine learning to analyze other big data sets, such as those containing biological or genetic information. Greater accuracy in prediction (ie, higher AUC values) will likely be achieved if big data, such as HLA, killer immunoglobulin-like receptor, and single nucleotide polymorphisms, can be properly integrated into future models. Distributing these established models to clinicians via Web tools or mobile applications will provide strong instruments to determine the most appropriate therapeutic strategies in the clinical practice.
Acknowledgments
The authors thank all of the physicians and data managers at the centers who contributed valuable data on transplantation to the Japan Society for Hematopoietic Cell Transplantation.
This work was supported in part by research funding from the Nakayama Foundation for Human Science and the Takeda Science Foundation (Y. Arai), as well as by the Practical Research Project for Allergic Diseases and Immunology (Research Technology of Medical Transplantation) from the Japan Agency for Medical Research and Development (Y. Atsuta).
Authorship
Contribution: Y. Arai designed the study, reviewed and analyzed data, and wrote the manuscript; T.K., K.F., Y.S., M.M., J.S., and T.T interpreted data and revised the manuscript; and N.U., T.F., K.K., Y.O., T.E., M.T., K. Ikegame, T.M., K. Iwato, T.I., Y.K., and Y. Atsuta contributed to data collection and critiqued the manuscript.
Conflict-of-interest disclosure: The authors declare no competing financial interests.
Correspondence: Yasuyuki Arai, Department of Transfusion Medicine and Cell Therapy, Graduate School of Medicine, Kyoto University, 54 Shogoin Kawahara-cho, Sakyo-ku, Kyoto 606-8507, Japan; e-mail: ysykrai@kuhp.kyoto-u.ac.jp.

