

Key Points
Activated neutrophils can suppress T-cell proliferation in a CD11b-dependent multistep process involving ROS production and degranulation.
MDSC activity results in nonapoptotic T-cell damage.

Abstract
Myeloid-derived suppressor cells (MDSCs) have the capacity to suppress T-cell–mediated immune responses and impact the clinical outcome of cancer, infections, and transplantation settings. Although MDSCs were initially described as bone marrow–derived immature myeloid cells (either monocytic or granulocytic MDSCs), mature neutrophils have been shown to exert MDSC activity toward T cells in ways that remain unclear. In this study, we demonstrated that human neutrophils from both healthy donors and cancer patients do not exert MDSC activity unless they are activated. By using neutrophils with genetically well-defined defects, we found that reactive oxygen species (ROS) and granule-derived constituents are required for MDSC activity after direct CD11b-dependent interactions between neutrophils and T cells. In addition to these cellular interactions, neutrophils are engaged in the uptake of pieces of T-cell membrane, a process called trogocytosis. Together, these interactions led to changes in T-cell morphology, mitochondrial dysfunction, and adenosine triphosphate depletion, as indicated by electron microscopy, mass spectrometry, and metabolic parameters. Our studies characterize the different steps by which activated mature neutrophils induce functional T-cell nonresponsiveness and irreparable cell damage.
Introduction
Myeloid-derived suppressor cells (MDSCs) have gained much attention recently. Their capacity to suppress T-cell–mediated immune responses has been recognized to affect the clinical outcome of cancer, chronic microbial infections, and organ transplantations.1 However, their exact origin is not completely clear. Initially MDSCs were believed to be a specific type of immature myeloid immune cell that was released under specific conditions from the bone marrow. However, it is now clear that both immature and mature myeloid cells can exert MDSC activity.1
One subtype of MDSC has a granulocytic origin, so those cells are called granulocytic MDSCs (g-MDSCs). Granulocytes comprise eosinophils and basophils, but the type most abundantly present in the circulation is the neutrophil, a cell type that forms the first line of defense of our immune system against bacterial and fungal infections. In mice, g-MDSCs can easily be identified by flow cytometry as CD11b+Ly6Ghi cells. In humans, these cells are identified by a combination of markers: lineage– (CD3, CD19, CD56), HLA-DR–, CD33+, CD14–, CD15+, and CD66b+.2
In patients with cancer, the presence of increased neutrophil counts in the circulation is directly correlated with a bad prognosis.3 Different types of neutrophils have been reported to circulate: regular high-density neutrophils without MDSC activity and a fraction of low-density neutrophils with the MDSC activity of both mature and immature states.4 Whether such low-density neutrophils are activated granulocytes that have degranulated and therefore have a lower density (as is true for the bulk of activated normal neutrophils5-7 ) or whether they are actually a specific low-density subtype of neutrophils being as granular as but larger than regular neutrophils4 is still unclear. However, this may suggest a role of neutrophil activation in achieving functional g-MDSC activity.
In this study, we observed that human neutrophils from both treatment-naive cancer patients and healthy controls can suppress T-cell activation but only upon activation with specific stimuli. To unravel the mechanism of neutrophil-mediated T-cell suppression, we used neutrophils isolated from patients with genetically well-defined phagocyte defects, and we found that both the production of reactive oxygen species (ROS) and the release of granule-derived myeloperoxidase (MPO) were required for neutrophils to exert MDSC activity in a process involving direct CD11b-dependent neutrophil-T-cell interactions. Apart from delivering ROS to T cells, the cellular interactions also resulted in the uptake of pieces of T-cell membrane by the neutrophils with a concomitant change in the immunophenotypic features of the T cells. Together, these neutrophil-defined suppressive activities induced a nonapoptotic form of irreparable T-cell damage that resulted in T cells with an altered morphology and protein signature along with a severely energy-deprived metabolic state.
Materials and methods
T-cell proliferation
Purified T cells were labeled with carboxyfluorescein diacetate succinimidyl ester (CFSE) (molecular probes; Life Technologies, Carlsbad, CA) and cultured in 96-well flat-bottom plates (Nunclon Delta Surface; Thermo Scientific, Waltham, MA) for 6 days, unless otherwise indicated, at 37°C in Iscove modified Dulbecco medium (Gibco, Life Technologies), and supplemented with 10% (v/v) fetal calf serum (Bodinco, Alkmaar, The Netherlands), 104 U/mL penicillin, 10 ng/mL streptomycin, 200 mM glutamine, and 0.035% (v/v) β-mercaptoethanol (Sigma-Aldrich, St. Louis, MO). Proliferation was induced by anti-CD3 (clone 1XE [IgE isotype] hybridoma supernatant, 1:1000; Sanquin, Amsterdam, The Netherlands) and anti-CD28 (clone 15E8 [IgG1 isotype] 5 μg/mL; Sanquin), monoclonal antibodies (20 000 T cells per well), or by interleukin-15 (IL-15) (10 ng/mL; 100 000 T cells per well; R&D Systems, Minneapolis, MN) or phytohemagglutinin (PHA) (10 μg/mL; 20 000 T cells per well; Merck, Darmstadt, Germany). Unless indicated otherwise, neutrophils were added in a 1:3 ratio (60 000 or 300 000 neutrophils per well) in the presence or absence of neutrophil-activating stimuli: N-formylmethionyl-leucyl-phenylalanine (fMLF) (1 μM; Sigma-Aldrich), tumor necrosis factor α (TNF-α) (10 ng/mL; PeproTech EC, London, United Kingdom), complement component 5a (C5a) (10−2 μM; Sigma), IL-8 (84 ng/mL; PeproTech), platelet activating factor (PAF) (1 μM; Sigma), Pam3CSK4 (10 μg/mL; EMC Microcollections, Tübingen, Germany), FSL-1 (1 μg/mL; EMC Microcollections), lipopolysaccharide (20 ng/mL; E coli 055:B5; Sigma), oligodeoxynucleotide (40 μg/mL; EMC Microcollections), granulocyte colony-stimulating factor (G-CSF) (20 ng/mL; NEUPOGEN; Amgen, Thousand Oaks, CA), and granulocyte-macrophage colony-stimulating factor (GM-CSF) (10 ng/mL; PeproTech).
To neutralize the effects of ROS on T-cell proliferation, neutrophils were pre-incubated for 10 minutes with ROS scavenger catalase (100 μg/mL; Sigma) or N-acetylcysteine (100 μM; Sigma) before being added to the culture plates containing T cells. CD11b-dependent interactions were blocked by a 10-minute pre-incubation of neutrophils with the CD11b-blocking antibody clone 44a (10 μg/mL, isolated from the supernatant of hybridoma clones obtained from the American Type Culture Collection, Rockville, MD) or isotype control of purified mouse immunoglobulin G (10 μg/mL; BioLegend, San Diego, CA).
To investigate the effect of physical separation of neutrophils and T cells on T-cell proliferation, T cells were cultured on 6.5-mm polycarbonate filter inserts with 0.4-μm pores (Corning, Sao Paulo, Brazil) in 24-well flat-bottom plates (Nunclon Delta Surface, Thermo Scientific), and neutrophils were cultured on the bottom of the wells with or without T cells.
Pan-caspase inhibitor zVAD (100 µM; Abcam, Cambridge, United Kingdom) or receptor-interacting protein kinase-1 (RIPK1) inhibitor necrostatin-1 (100 µM; R&D Systems) were added to the T-cell and neutrophil coculture with the indicated stimuli to investigate whether T-cell damage was induced by apoptosis or necroptosis, respectively.
After 4 to 6 days, T-cell proliferation, indicated by CFSE dilution, was analyzed by flow cytometry. Cells were harvested from the culture plates and stained with antigen -presenting cell–labeled anti-CD4 (clone SK3; BD Biosciences, San Jose, CA) and PerCPCy5.5-labeled anti-CD8 (clone SK1; BioLegend) antibodies. For more information on material and methods, see supplemental Data.
Results
Activated neutrophils suppress T-cell proliferation and cytokine production
T cells purified from total peripheral blood mononuclear cells (PBMCs) by negative selection were labeled with CFSE, and proliferation was induced by anti-CD3 and anti-CD28 antibodies. The presence of untreated neutrophils or the presence of the neutrophil activator fMLF did not affect T-cell proliferation. However, when fMLF-activated neutrophils were added to T cells, a strong reduction of both CD4+ and CD8+ T-cell proliferation was observed (Figure 1A-B), quantified as relative precursor frequency (ie, as the percentage of naive T cells that responded to the stimulation with anti-CD3 and anti-CD28 antibodies,8 normalized for the condition with only stimulated T cells). Suppression of T-cell proliferation by fMLF-activated neutrophils was dose-dependent with an optimal T-cell:neutrophil ratio of 1:3 (Figure 1C). These results also indicate that optimal settings should be tested when measuring functional MDSC activity in vitro, because in the T-cell:neutrophil ratio of 1:8, the MDSC activity may not even be observed.
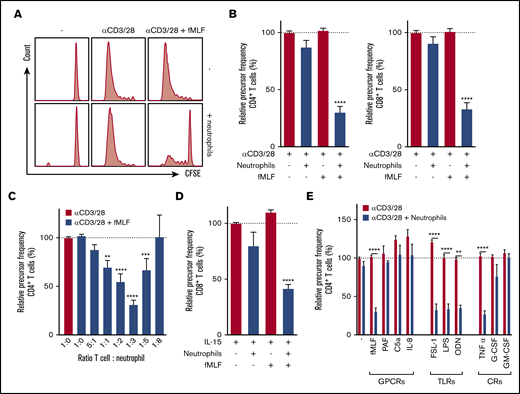
Activated neutrophils suppress T-cell proliferation. Purified T cells (either CD4+ or CD8+) were cultured in the presence or absence of anti-CD3 antibody or anti-CD28 antibody with unstimulated or fMLF-activated neutrophils (unless otherwise indicated). Cells were harvested after 5 to 6 days and analyzed by flow cytometry for CFSE dilution. (A) Representative fluorescence-activated cell sorting (FACS) plots of CFSE dilution of CD4+ T cells. (B) Quantification of CD4+ (left) and CD8+ (right) T-cell proliferation (n = 17). (C) Titration of the cell ratio with 4000 (5:1 ratio), 20 000 (1:1), 40 000 (1:2), 60 000 (1:3), 100 000 (1:5), or 160 000 (1:8) neutrophils per well of a 96-well plate (n = 3-17). (D) Purified T cells were cultured in the presence or absence of IL-15 with unstimulated or fMLF-activated neutrophils (n = 5). (E) Purified T cells were cultured with anti-CD3 and anti-CD28 antibodies (red bars), and in the presence of neutrophils (blue bars) and/or indicated stimuli. Three to 19 donors were tested in duplicate per stimulus. Error bars indicate standard error of the mean (SEM); ****P < .0001; ***P < .001; **P < .01. CR, cytokine receptor; GPCR, G-protein–coupled receptor; TLR, Toll-like receptor.
Activated neutrophils suppress T-cell proliferation. Purified T cells (either CD4+ or CD8+) were cultured in the presence or absence of anti-CD3 antibody or anti-CD28 antibody with unstimulated or fMLF-activated neutrophils (unless otherwise indicated). Cells were harvested after 5 to 6 days and analyzed by flow cytometry for CFSE dilution. (A) Representative fluorescence-activated cell sorting (FACS) plots of CFSE dilution of CD4+ T cells. (B) Quantification of CD4+ (left) and CD8+ (right) T-cell proliferation (n = 17). (C) Titration of the cell ratio with 4000 (5:1 ratio), 20 000 (1:1), 40 000 (1:2), 60 000 (1:3), 100 000 (1:5), or 160 000 (1:8) neutrophils per well of a 96-well plate (n = 3-17). (D) Purified T cells were cultured in the presence or absence of IL-15 with unstimulated or fMLF-activated neutrophils (n = 5). (E) Purified T cells were cultured with anti-CD3 and anti-CD28 antibodies (red bars), and in the presence of neutrophils (blue bars) and/or indicated stimuli. Three to 19 donors were tested in duplicate per stimulus. Error bars indicate standard error of the mean (SEM); ****P < .0001; ***P < .001; **P < .01. CR, cytokine receptor; GPCR, G-protein–coupled receptor; TLR, Toll-like receptor.
Cytokine release after T-cell stimulation with anti-CD3/anti-CD28 antibodies was also strongly suppressed by fMLF-activated neutrophils in these cultures (supplemental Figure 1). By comparing autologous and allogeneic settings, we observed that mixing neutrophils and T cells from different donors did not induce alloreactivity (supplemental Figure 2). To exclude the possibility that neutrophils suppressed T-cell proliferation solely as a result of recognition of anti-CD28 antibodies through their immunoglobulin G Fc receptors,9 suppression of T-cell activation induced by the cytokine IL-15 or the lectin PHA was also tested. IL-15 is known to activate CD8+ T cells,10 and this activation was inhibited in the presence of fMLF-activated neutrophils (Figure 1D). In addition, PHA-induced T-cell proliferation was inhibited when neutrophils were activated by fMLF (data not shown).
Other neutrophil activators besides fMLF were also tested for their capacity to induce the MDSC activity of neutrophils. The G protein–coupled receptor ligand PAF, C5a, and IL-8, all known to activate neutrophils,11,12 did not induce MDSC activity (Figure 1E, left), whereas neutrophil activation by Toll-like receptor (TLR) ligands,13-15 such as TLR2, TLR4, and TLR9, all strongly induced neutrophils to suppress T-cell proliferation (Figure 1E, middle). The addition of these ligands in the absence of neutrophils did not affect T-cell proliferation. The inflammatory cytokine TNF-α could induce suppressive activity, but the growth factors G-CSF and GM-CSF could not do so (Figure 1E, right). These observations with CD4+ T cells were similar for CD8+ T cells (data not shown), which holds true for all of the following experiments unless stated otherwise.
Neutrophils from cancer patients do not show spontaneous suppression of T-cell activation
Because neutrophil MDSC activity in patients with cancer has previously been reported,16-19 we isolated fresh neutrophils from patients to test neutrophil MDSC activity in chemotherapy-naive cancer patients. We received blood samples from untreated patients with head-and-neck cancer (HNC; n = 8) or mammary carcinoma (MC; n = 3), all localized without metastasis. Neutrophils from these patients were able to suppress T-cell proliferation only when activated, similar to the findings obtained with healthy control neutrophils. In other words, neutrophils from patients with HNC or MC did not show any spontaneous MDSC activity (Figure 2A).
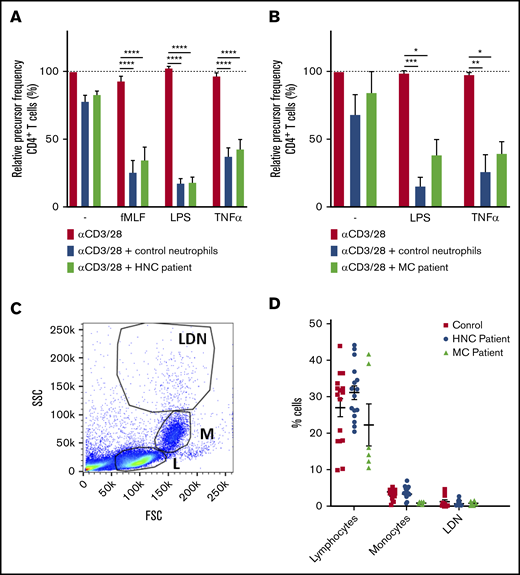
Neutrophils from patients with HNC do not show spontaneous suppression of T-cell activation. (A-B) Purified T cells from control donors were cultured with anti-CD3 and anti-CD28 antibodies (red bars) and in the presence of neutrophils from control donors (blue bars) or patients with HNC (A: green bars, 8 donors tested in duplicate) or patients with MC (B: green bars, 3 donors tested in duplicate), and/or indicated stimuli. Cells were harvested after 5 to 6 days and analyzed by flow cytometry for CFSE dilution among CD4+ T cells (8 donors tested in duplicate). (C-D) PBMCs from healthy controls (red square), HNC patients (blue circle, 8 patients tested in duplicate), or MC patients (green triangle, 3 patients tested in duplicate) were analyzed by flow cytometry and divided into 3 separate cell populations: lymphocytes (L), monocytes (M), and low-density neutrophils (LDNs). Shown is a representative plot (C) and the percentage of cells of each indicated cell population (D). Error bars indicate SEM. *P < .05, **P < .01, ***P < .001, ****P < .0001.
Neutrophils from patients with HNC do not show spontaneous suppression of T-cell activation. (A-B) Purified T cells from control donors were cultured with anti-CD3 and anti-CD28 antibodies (red bars) and in the presence of neutrophils from control donors (blue bars) or patients with HNC (A: green bars, 8 donors tested in duplicate) or patients with MC (B: green bars, 3 donors tested in duplicate), and/or indicated stimuli. Cells were harvested after 5 to 6 days and analyzed by flow cytometry for CFSE dilution among CD4+ T cells (8 donors tested in duplicate). (C-D) PBMCs from healthy controls (red square), HNC patients (blue circle, 8 patients tested in duplicate), or MC patients (green triangle, 3 patients tested in duplicate) were analyzed by flow cytometry and divided into 3 separate cell populations: lymphocytes (L), monocytes (M), and low-density neutrophils (LDNs). Shown is a representative plot (C) and the percentage of cells of each indicated cell population (D). Error bars indicate SEM. *P < .05, **P < .01, ***P < .001, ****P < .0001.
Blood cells with strong MDSC activity were described to separate with the PBMC fraction, when centrifuged over a Ficoll-Hypaque gradient, having the same morphology as granulocytes.6,20 However, when we analyzed the PBMCs of the patients with HNC or MC, we observed neither an increase in the number of cells with a granulocyte morphology (low-density neutrophils) (Figure 2B-C) nor a higher expression of either granulocyte-associated or MDSC-associated surface markers compared with the low-density neutrophil fractions collected from healthy donors (supplemental Figure 3). High-density neutrophils from the HNC patients were more positive for the marker LOX-1, which was suggested to be an MDSC marker,21 although the expression remained low (not significant) (supplemental Figure 3). In fact, LOX-1 was shown to be a cell surface marker that is upregulated upon neutrophil activation, as we found upon short-term neutrophil activation (supplemental Figure 3). Our data clearly suggest that not all patients with cancer have detectable numbers of circulating neutrophils with an inherently vigorous and spontaneous MDSC activity, which points toward the requirement of pre-activation to become able to suppress T cells.
Suppressive activity of neutrophils requires ROS production
The neutrophil activators that induced suppressive activity of neutrophils toward T cells (fMLF, TNF-α, and lipopolysaccharide) were found to be potent inducers of ROS by the nicotinamide adenine dinucleotide phosphate hydrogen (NADPH) oxidase system (Figure 3A), whereas the neutrophil activators that could not induce the MDSC activity (PAF, C5a, and IL-8) induced almost no ROS production (Figures 1E and 2A). This suggested a role for ROS in neutrophil MDSC activity.
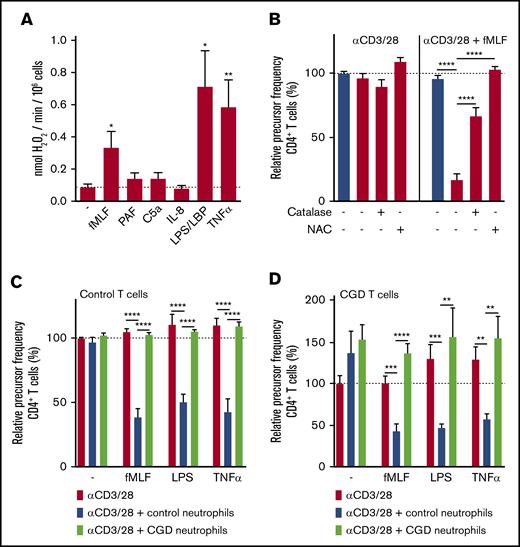
Suppressive activity of neutrophils requires ROS production. (A) Neutrophils were stimulated with the indicated stimuli and production of H2O2 was determined by measuring Amplex Red conversion into fluorescent Resorufin (n = 5). (B-D) Purified T cells from control donors (B-C) or CGD patients (D) were cultured with anti-CD3 and anti-CD28 antibodies (red bars) in the presence of neutrophils from control donors (blue bars) or CGD patients (green bars), and/or with indicated stimuli and antioxidants. Cells were harvested after 4 to 6 days and analyzed by flow cytometry for CFSE dilution among CD4+ T cells (n = 3 to 5 donors tested in duplicate). Error bars indicate SEM. ****P < .0001; ***P < .001; **P < .01; *P < .05. LBP, lipopolysaccharide binding protein.
Suppressive activity of neutrophils requires ROS production. (A) Neutrophils were stimulated with the indicated stimuli and production of H2O2 was determined by measuring Amplex Red conversion into fluorescent Resorufin (n = 5). (B-D) Purified T cells from control donors (B-C) or CGD patients (D) were cultured with anti-CD3 and anti-CD28 antibodies (red bars) in the presence of neutrophils from control donors (blue bars) or CGD patients (green bars), and/or with indicated stimuli and antioxidants. Cells were harvested after 4 to 6 days and analyzed by flow cytometry for CFSE dilution among CD4+ T cells (n = 3 to 5 donors tested in duplicate). Error bars indicate SEM. ****P < .0001; ***P < .001; **P < .01; *P < .05. LBP, lipopolysaccharide binding protein.
Supportive evidence for this role of ROS was obtained by adding the antioxidants catalase or N-acetylcysteine (NAC). Catalase is an enzyme that catalyzes the conversion of extracellular hydrogen peroxide (H2O2) into water and oxygen. Addition of this enzyme to the T-cell proliferation assay partially prevented the suppressive activity of fMLF-activated neutrophils toward T-cell proliferation (Figure 3B), whereas NAC, besides scavenging extracellular ROS, also enters cells to inactivate intracellular ROS, which completely reverted the MDSC effects (Figure 3B).
To further prove the involvement of NADPH oxidase activity and ROS production in g-MDSC activity, cells from patients with chronic granulomatous disease (CGD) were tested. Neutrophils from CGD patients are unable to generate ROS as a result of a mutation in 1 of the subunits of the NADPH oxidase system.22,23 Suppressive activity of activated CGD neutrophils was completely absent upon coculture with anti-CD3/anti-CD28–stimulated CGD or control T cells (Figure 3C-D), confirming the involvement of phagocyte-derived ROS in the suppression of T-cell proliferation by activated neutrophils.
Suppressive activity of neutrophils requires degranulation
Neutrophils contain different types of granules: azurophilic (primary) granules that specifically contain MPO, proteases, and defensins and specific (secondary and tertiary) granules that contain lactoferrin and vitamin-B12–binding protein, among other components. The neutrophil activators that were able to induce g-MDSC activity induced a higher release of both azurophilic and specific granules, as was indicated by MPO and lactoferrin measured in the supernatant, respectively, in contrast to activators that did not induce suppressive activity (Figure 4A-B). Because they are known positive controls for the release of specific granules or of all granules, neutrophils were pre-incubated with PAF or cytochalasin B (an actin filament polymerization inhibitor), respectively.
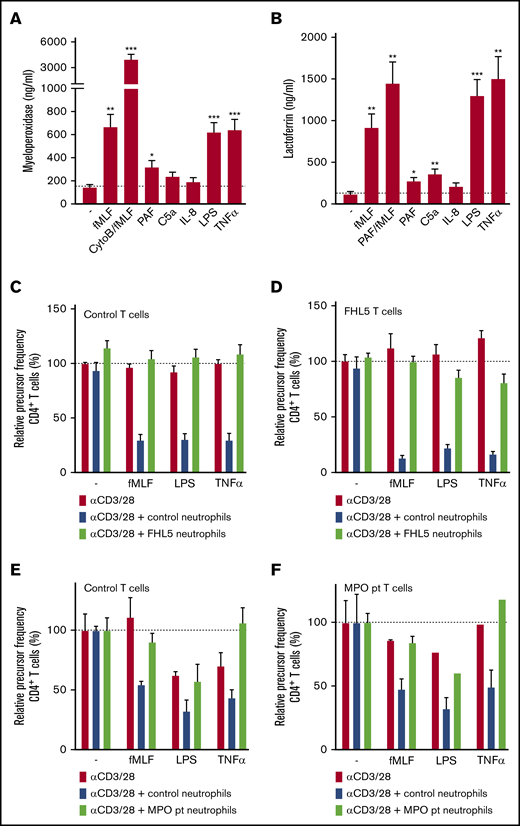
Suppressive activity of neutrophils requires degranulation. (A-B) Neutrophils were stimulated with the indicated stimuli for 4 hours at 37°C after which supernatants were harvested and analyzed for the presence of myeloperoxidase (from primary granules) (A) and lactoferrin (from secondary granules) (B) by enzyme-linked immunosorbent assay (n = 7). (C-F) Purified T cells from control donors (C,E; n = 2), FHL-5 (D; n = 2), or MPO-deficient (F; n = 1) patients were cultured with anti-CD3 and anti-CD28 antibodies (red bars), in the presence of neutrophils from control donors (blue bars), FHL-5 patients (C-D, green bars), or an MPO-deficient patient (E-F, green bars), and/or indicated stimuli. Cells were harvested after 4 to 6 days and analyzed by flow cytometry for CFSE dilution among CD4+ T cells. Error bars indicate SEM. ***P < .001; **P < .01; *P < .05. CytoB, cytochalasin B; pt, patient.
Suppressive activity of neutrophils requires degranulation. (A-B) Neutrophils were stimulated with the indicated stimuli for 4 hours at 37°C after which supernatants were harvested and analyzed for the presence of myeloperoxidase (from primary granules) (A) and lactoferrin (from secondary granules) (B) by enzyme-linked immunosorbent assay (n = 7). (C-F) Purified T cells from control donors (C,E; n = 2), FHL-5 (D; n = 2), or MPO-deficient (F; n = 1) patients were cultured with anti-CD3 and anti-CD28 antibodies (red bars), in the presence of neutrophils from control donors (blue bars), FHL-5 patients (C-D, green bars), or an MPO-deficient patient (E-F, green bars), and/or indicated stimuli. Cells were harvested after 4 to 6 days and analyzed by flow cytometry for CFSE dilution among CD4+ T cells. Error bars indicate SEM. ***P < .001; **P < .01; *P < .05. CytoB, cytochalasin B; pt, patient.
Subsequently, the suppressive activity of neutrophils from patients with familial hemophagocytic lymphohistiocytosis type 5 (FHL-5) was assessed. These patients have a mutation in MUNC18-2, which leads to defective granule exocytosis in natural killer (NK) and cytotoxic T cells and also in neutrophils, whereas the ROS formation is intact.24 Addition of activated FHL-5 neutrophils (Figure 4C-D) did not lead to suppression of T-cell proliferation.
We hypothesized that the release of MPO from azurophilic granules might be needed to convert ROS, produced in the form of H2O2 by the NADPH oxidase, into the more stable hypochlorous acid instead of the less stable H2O2. Indeed, neutrophils from a rare, complete MPO-deficient patient lacked MDSC activity toward both healthy donor T cells and T cells from the MPO-deficient patients, but they produced normal amounts of H2O225 and showed normal degranulation26 (Figure 4E-F).
Suppressive activity of neutrophils depends on physical CD11b-dependent contact
Because cellular proximity was previously suggested to be involved,27 our observation comparing catalase as a mild extracellular ROS scavenger and NAC as the stronger scavenger of both extra- and intracellular ROS (Figure 3B), suggested that intercellular contact is needed to deliver a concentrated amount of toxic long-acting ROS to suppress T-cell activation by neutrophils. By performing our T-cell coculture with a Transwell filter, we observed that in the absence of physical contact or cellular proximity, activated neutrophils were unable to suppress T-cell proliferation (Figure 5A). In addition, when neutrophils were co-incubated with T cells in the lower compartment (ie, below the Transwell filter), the MDSC activity of neutrophils was normally induced (data not shown), but the proliferation of the T cells on top of the filter was not suppressed (Figure 5A). This confirms that release of ROS and granule proteins, when physically separated, could not suppress T-cell proliferation.
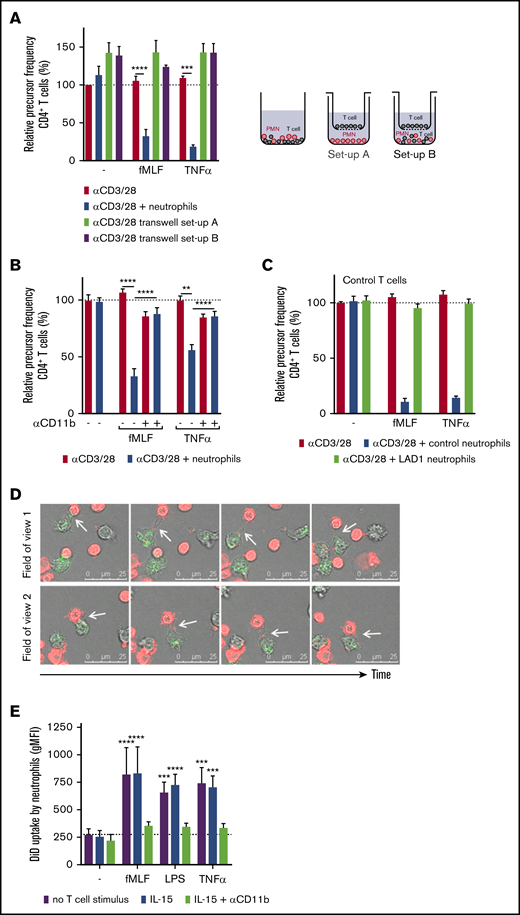
The suppressive activity of neutrophils depends on CD11b-dependent physical contact. (A) Purified T cells were cultured with anti-CD3 and anti-CD28 antibodies (red bars) and cultured either together with neutrophils in a well (blue bars) or physically separated from neutrophils by culturing the T cells on a Transwell filter insert. Neutrophils were incubated without (setup A, green bar) or with (setup B, purple bar) purified T cells in the lower compartment. T cells on top of the Transwell filter were harvested after 5 days and analyzed by flow cytometry for CFSE dilution among CD4+ T cells (n = 4). (B) Purified T cells (red bars) and neutrophils (blue bars) were cultured together with the indicated stimuli. Where indicated, neutrophils were pre-incubated with a CD11b-blocking antibody before they were added to the assay (n = 3-5). The isotype control had no effect on the MDSC activity (not included in graph). (C) Purified T cells from healthy donors (n = 2) were incubated with either control neutrophils or neutrophils from LAD-1 patients (n = 2). (D) Live cell imaging of 1,1′-dioctadecyl-3,3,3′,3′-tetramethylindodicarbocyanine,4-chlorobenzenesulfonate salt (DiD)–labeled T cells (red) and neutrophils in the presence of anti-CD3 antibodies, anti-CD28 antibodies, TNF-α, and dihydrorhodamine-1,2,3 (turns green after reaction with ROS). The coculture was imaged for 4 hours. Two fields of view of 1 representative experiment of 3 is shown. The white arrows indicate the uptake of the T-cell membrane by the neutrophil. (E) DiD-labeled purified T cells were cocultured for 3 hours with neutrophils and indicated stimuli with or without a CD11b-blocking antibody, after which cells were harvested for flow cytometric analysis in which the amount of uptake of DiD-labeled T-cell membrane by neutrophils was determined (n = 4). Error bars indicate SEM. ****P < .0001; ***P < .001; **P < .01. MFI, mean fluorescent intensity.
The suppressive activity of neutrophils depends on CD11b-dependent physical contact. (A) Purified T cells were cultured with anti-CD3 and anti-CD28 antibodies (red bars) and cultured either together with neutrophils in a well (blue bars) or physically separated from neutrophils by culturing the T cells on a Transwell filter insert. Neutrophils were incubated without (setup A, green bar) or with (setup B, purple bar) purified T cells in the lower compartment. T cells on top of the Transwell filter were harvested after 5 days and analyzed by flow cytometry for CFSE dilution among CD4+ T cells (n = 4). (B) Purified T cells (red bars) and neutrophils (blue bars) were cultured together with the indicated stimuli. Where indicated, neutrophils were pre-incubated with a CD11b-blocking antibody before they were added to the assay (n = 3-5). The isotype control had no effect on the MDSC activity (not included in graph). (C) Purified T cells from healthy donors (n = 2) were incubated with either control neutrophils or neutrophils from LAD-1 patients (n = 2). (D) Live cell imaging of 1,1′-dioctadecyl-3,3,3′,3′-tetramethylindodicarbocyanine,4-chlorobenzenesulfonate salt (DiD)–labeled T cells (red) and neutrophils in the presence of anti-CD3 antibodies, anti-CD28 antibodies, TNF-α, and dihydrorhodamine-1,2,3 (turns green after reaction with ROS). The coculture was imaged for 4 hours. Two fields of view of 1 representative experiment of 3 is shown. The white arrows indicate the uptake of the T-cell membrane by the neutrophil. (E) DiD-labeled purified T cells were cocultured for 3 hours with neutrophils and indicated stimuli with or without a CD11b-blocking antibody, after which cells were harvested for flow cytometric analysis in which the amount of uptake of DiD-labeled T-cell membrane by neutrophils was determined (n = 4). Error bars indicate SEM. ****P < .0001; ***P < .001; **P < .01. MFI, mean fluorescent intensity.
We investigated whether the dependence on cellular proximity was caused by the need for direct neutrophil-specific CD11b-mediated interactions with T cells (T cells do not express CD11b or CD18 integrins). T-cell proliferation experiments were performed with neutrophils pre-incubated with a CD11b-blocking antibody. Blockade of CD11b-mediated interactions completely prevented neutrophil MDSC activity (Figure 5B). The requirement for integrin-dependent cell-cell contact was confirmed with neutrophils from a patient with leukocyte adhesion deficiency type 1 (LAD-1) with homozygous mutations in the ITGB2 gene encoding CD18. The patient’s cells had no expression of β2-integrins on their cell surface, including integrin αMβ2 (CD11b/CD18). When LAD-1 neutrophils were incubated with T cells, they (while ROS production and degranulation were intact) could not suppress the proliferation of donor T cells (Figure 5C), confirming the involvement of CD11b-mediated interactions in neutrophil MDSC activity. This was further supported when we tested the blockade of β2-integrin ligands on T cells with blocking antibodies against ICAM-1. We observed that MDSC activity was inhibited by about 50% (data not shown). The fact that inhibition by the anti-ICAM-1 monoclonal antibody, while blocking interactions between T cells (as shown by the absence of T-cell aggregates), was not able to fully prevent the MDSC activity of activated neutrophils (data not shown). This suggests that additional molecules such as ICAM-3 may also function as ligands for CD11b and C18 in the physical neutrophil interaction with T cells.28,29
To gain more insight into the early interactions between neutrophils and T cells and suppression of T-cell activation, we visualized the intercellular contacts by live-cell imaging (Figure 5D; supplemental Movie). T cells were labeled with membrane dye 1,1′-dioctadecyl-3,3,3′,3′-tetramethylindodicarbocyanine,4-chlorobenzenesulfonate salt (DiD; red) and cocultured with neutrophils in the presence of anti-CD3 and anti-CD28 antibodies, TNF-α and dihydrorhodamine-1,2,3 in the medium (dihydrorhodamine-1,2,3 turns green when ROS is produced). The cells were imaged during the first 4 hours of coculture. Interactions between the 2 cell types were taking place regularly within a time frame of minutes, and in some cases, more than once. These short interactions resulted in neutrophils containing pieces of T-cell membrane (Figure 5D), which has been described as trogocytosis.30 This phenomenon was also observed when T-cell proliferation was induced with IL-15 (data not shown). To quantify the uptake of T-cell membrane by neutrophils, neutrophil positivity for membrane dye DiD (with which T cells were prelabeled) was measured by flow cytometry after 3 hours of coculture (Figure 5E), as described before.31,32 Irrespective of T-cell activation, only activated neutrophils were positive for the T-cell membrane dye, which could again be blocked by the CD11b-blocking antibody. Thus, once activated, neutrophils are prone to crawl around in these cultures to interact intensely with T cells in a nonspecific way, as illustrated by exchange of the membrane dye.
Suppressive activity of neutrophils results in a population of small nonresponsive T cells
Upon flow cytometry analysis, specifically under the conditions of suppression of T-cell proliferation by neutrophils, an increase of the population of smaller forward scatter low (FSClow) and CFSE+ T cells appeared in the FSC/side scatter (SSC) plot (Figure 6A; data not shown). These small T cells did not appear in experiments performed under conditions in which MDSC activity of control neutrophils was absent or blocked, or when neutrophils from CGD, FHL-5, MPO-deficient patients, or LAD-1 patients were tested (data not shown), meaning that ROS and degranulation as toxic effector mechanisms of neutrophils were involved in the generation of this population of small T cells.
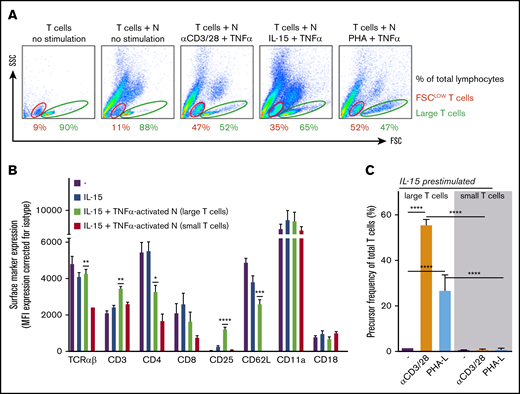
Suppressive activity of neutrophils (N) results in a population of small nonresponsive T cells. (A) Gating of FSClow (red) and large (green) T cells on FSC/SSC plots of (representative) flow cytometric analysis of purified T cells cultured with or without neutrophils in the presence of IL-15 and TNF-α (n = 3). (B) The surface marker expression of indicated proteins was measured by flow cytometric analysis of unstimulated T cells (purple bars), T cells stimulated for 2 days with IL-15 (blue bars), and T cells stimulated for 2 days with IL-15 in the presence of activated neutrophils. The latter T cells were separated into large (green bars) and small (red bars) groups (n = 3). (C) T cells cultured for 2 days in the presence of IL-15 and TNF-α–activated neutrophils were sorted into small and large T cells and cultured separately in the presence of anti-CD3/CD28 antibodies or phytohemagglutinin-L (PHA-L). Cells were harvested after 4 to 6 days and were analyzed by flow cytometry for CFSE dilution (n = 5-9). Error bars indicate SEM. ****P < .0001; ***P < .001; **P < .01; *P < .05.
Suppressive activity of neutrophils (N) results in a population of small nonresponsive T cells. (A) Gating of FSClow (red) and large (green) T cells on FSC/SSC plots of (representative) flow cytometric analysis of purified T cells cultured with or without neutrophils in the presence of IL-15 and TNF-α (n = 3). (B) The surface marker expression of indicated proteins was measured by flow cytometric analysis of unstimulated T cells (purple bars), T cells stimulated for 2 days with IL-15 (blue bars), and T cells stimulated for 2 days with IL-15 in the presence of activated neutrophils. The latter T cells were separated into large (green bars) and small (red bars) groups (n = 3). (C) T cells cultured for 2 days in the presence of IL-15 and TNF-α–activated neutrophils were sorted into small and large T cells and cultured separately in the presence of anti-CD3/CD28 antibodies or phytohemagglutinin-L (PHA-L). Cells were harvested after 4 to 6 days and were analyzed by flow cytometry for CFSE dilution (n = 5-9). Error bars indicate SEM. ****P < .0001; ***P < .001; **P < .01; *P < .05.
We reasoned that these smaller T cells were the consequence of progressive pinching off of pieces of T-cell membrane by activated neutrophils. To investigate the impact of trogocytosis on T-cell phenotype and function, we purified small and large T cells after 2 days of IL-15 stimulation in coculture with activated neutrophils. Multiple markers were reduced on the surface of small T cells compared with large T cells present in the same cocultures or with T cells that had been cultured without neutrophils (Figure 6B). Many of the downregulated markers are associated with T-cell activation (eg, TCRαβ, CD3, CD4, CD8, and CD25). We subsequently purified small and large T cells by fluorescence-activated cell sorting after 2 days of IL-15 stimulation in coculture with activated neutrophils and subsequently cultured in the presence of the strong stimuli anti-CD3 and anti-CD28 antibodies or PHA. The purified large T cells responded with strong proliferation (in addition to IL-15–induced growth), whereas the small T cells did not show any activation or proliferative capacity at all (Figure 6C).
T-cell suppression is induced by a nonapoptotic pathway
To investigate and define the MDSC-induced state of T cells after contact with activated neutrophils, we first tested whether the nonresponsive small T cells were apoptotic or not, for which we used annexin V as a marker for surface membrane–exposed phosphatidylserine and cell-impermeable Hoechst that binds intracellular DNA when cells have become leaky. Only in the absence of T-cell stimulation and neutrophils did the FSClow cells obtain an apoptotic phenotype (Hoechst+annexin V+). In the presence of MDSC activity by activated neutrophils, the majority of small T cells (FSClow/CFSE+) did not achieve an apoptotic phenotype but were clearly Hoechst+ (Figure 7A; supplemental Figure 4A). The neutrophils in the same coculture had already undergone apoptosis at day 1, as indicated by positive staining for annexin V and Hoechst (data not shown). In support of the absence of classic annexin V+ apoptosis of the T cells, staining for active caspase-3 also remained negative in these small T cells and did not change in the presence of high doses of the pan-caspase inhibitor zVAD (Figure 7B; supplemental Figure 4B). MDSC activity was also not prevented by zVAD (supplemental Figure 4C). Nonetheless, Hoechst positivity of small T cells indicates that these cells had become permeable without complete disruption of the cells or CFSE leakage out of the cell (which can be explained by its strong binding to intracellular molecules33 ). On the basis of these data, the form of damage that T cells undergo cannot be described as a process of caspase-dependent apoptosis. We subsequently investigated whether T-cell damage was induced by a process called necroptosis by using an inhibitor of RIPK1, which is a key mediator of this cell death process.34-36 At doses of necrostatin-1 up to 100 µM, we also did not observe a major effect of this inhibitor on the MDSC activity under the conditions tested (supplemental Figure 4D).
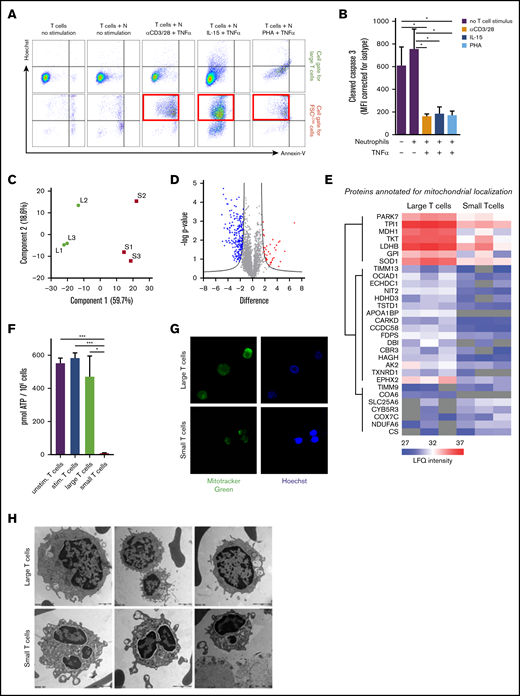
T-cell suppression is induced by a nonapoptotic pathway. T cells cultured for 2 days in the presence of IL-15 and TNF-α–activated neutrophils were harvested for flow cytometry or separated into small and large T cells by FACS for proteomic comparison, electron microscopy imaging, adenosine triphosphate (ATP) level determination, and MitoTracker staining. (A) Representative FACS plots of annexin V and Hoechst binding in cell gate for large T cells or FSClow T cells; the red squares indicate the FSClow T cells induced by MDSC activity of activated neutrophils (n = 3). (B) Flow cytometric analysis of cytoplasmic presence of cleaved caspase-3 in T cells after indicated culture conditions of 2 days (n = 4). (C) Principal component analysis of mass spectrometry label-free quantification (LFQ) intensities of small (S) and large (L) T cells. (D) Volcano plot representation of a 2-sided non-paired Student t test (small vs large T cells) with an false discovery rate of 0.05 and an S0 value of 2. Proteins more abundant in small T cells compared with large T cells are red and proteins less abundant are blue (see supplemental Table 1 for protein identification). (E) Heat plot representation of LFQ values of proteins annotated for mitochondrial localization (Human MitoCarta 2.0; 1158 entries) affected in this analysis. (F) ATP levels were measured in T cells cultured for 2 days either unstimulated (purple bars), stimulated by IL-15 and TNF-α (blue bars), or in the presence of neutrophils activated by IL-15 and TNF-α. The latter T cells were separated into large (green bars) and small (red bars) T cells (n = 3). (G) Live cell imaging of mitochondria stained with MitoTracker Green and Hoechst in small and large T cells. Shown are representative images of 3 experiments (magnification ×40). (H) Representative electron microscopy photos of small and large T cells (n = 4). Scale bar for top left image is 1 μm; scale bars for other images are 2 μm. *P < .05, ***P < .001. Stim, stimulated; Unstim, unstimulated.
T-cell suppression is induced by a nonapoptotic pathway. T cells cultured for 2 days in the presence of IL-15 and TNF-α–activated neutrophils were harvested for flow cytometry or separated into small and large T cells by FACS for proteomic comparison, electron microscopy imaging, adenosine triphosphate (ATP) level determination, and MitoTracker staining. (A) Representative FACS plots of annexin V and Hoechst binding in cell gate for large T cells or FSClow T cells; the red squares indicate the FSClow T cells induced by MDSC activity of activated neutrophils (n = 3). (B) Flow cytometric analysis of cytoplasmic presence of cleaved caspase-3 in T cells after indicated culture conditions of 2 days (n = 4). (C) Principal component analysis of mass spectrometry label-free quantification (LFQ) intensities of small (S) and large (L) T cells. (D) Volcano plot representation of a 2-sided non-paired Student t test (small vs large T cells) with an false discovery rate of 0.05 and an S0 value of 2. Proteins more abundant in small T cells compared with large T cells are red and proteins less abundant are blue (see supplemental Table 1 for protein identification). (E) Heat plot representation of LFQ values of proteins annotated for mitochondrial localization (Human MitoCarta 2.0; 1158 entries) affected in this analysis. (F) ATP levels were measured in T cells cultured for 2 days either unstimulated (purple bars), stimulated by IL-15 and TNF-α (blue bars), or in the presence of neutrophils activated by IL-15 and TNF-α. The latter T cells were separated into large (green bars) and small (red bars) T cells (n = 3). (G) Live cell imaging of mitochondria stained with MitoTracker Green and Hoechst in small and large T cells. Shown are representative images of 3 experiments (magnification ×40). (H) Representative electron microscopy photos of small and large T cells (n = 4). Scale bar for top left image is 1 μm; scale bars for other images are 2 μm. *P < .05, ***P < .001. Stim, stimulated; Unstim, unstimulated.
Although a fraction of small T cells appeared at day 1 after g-MDSC induction and after an overnight coculture of T cells with activated neutrophils, a more sizeable proportion of these small T cells became detectable after 2 days. Therefore, small and large T cells were purified after a 2-day culture in the presence of IL-15 and TNF-α–activated neutrophils and subjected to mass spectrometry analysis, which showed that small and large T cells had striking differences in their protein composition (Figure 7C-D; supplemental Table 1). For instance, proteins that were more abundant in the large T-cell population were involved in metabolic processes (supplemental Figure 5A). The population of small T cells was enriched for proteins characterized by many gene ontology (GO) terms, ranging from chromatic silencing to chemokine production and hemostasis. Most of the GO terms were related to the immune response that resulted from a select number of proteins that are also expressed in granulocytes and may originate partly from their granules (supplemental Figure 5B). Consistent with the state of unresponsiveness and the metabolism-related GO terms, 30 proteins annotated for mitochondrial localization were affected in the small T cells, most being downregulated (Figure 7E). In support of these findings, small T cells showed strongly reduced if not absent adenosine triphosphate levels compared with large T cells or with T cells that had been cultured without neutrophils (Figure 7F). In addition, staining of the mitochondria showed less clear mitochondrial staining in the small T cells by MitoTracker fluorescence whereas the nuclear stain was much brighter in the small T cells (Figure 7G), which is compatible with the ultrastructural findings of cellular decay and mitochondrial swelling (Figure 7G; supplemental Figure 6).
Discussion
MDSC activity of human neutrophils has been poorly characterized. In this study, we show that classic granulocyte effector functions essential for antimicrobial defense, such as the production of ROS and the release of the contents of the neutrophil granules, are both required. These essential features contribute to a process of CD11b- and CD18-mediated, contact-dependent suppression of T-cell–mediated immune responses, which is associated with a change in T-cell morphology, metabolic depletion, and features of irreparable cell damage.
The fact that neutrophils were capable of MDSC activity only after neutrophil activation could indicate that low-density pre-activated neutrophils with spontaneous MDSC activity likely circulate only under certain disease conditions whereas they are absent in healthy individuals.6,27,37 However, we have not been able to detect spontaneous MDSC activity of neutrophils in naive untreated cancer patients, nor have we been able to detect an increased number of low-density neutrophils. Even though we are using the same methods, our data indicate a yet unexplained difference with data from previous publications on the subject.6,17,18,20 Conversely, we did observe that the neutrophils from cancer patients were clearly able to exert MDSC activity in the same way as we have now characterized for neutrophils in general. Taken together and combined with our own data on the requirement of activation to induce MDSC activity, we hypothesize that this neutrophil activity will be able to offset tumor-infiltrating lymphocytes within tumor tissue, in particular when attracted to the tumor to receive local activation triggers.38-43
In this study we observed that suppression of T-cell proliferation by activated neutrophils depends on ROS and granule constituents as demonstrated by knockout neutrophils with genetically well-defined phagocyte defects. It has been suggested that ROS blocks NF-κB activation, leading to impaired T-cell activation.44 MPO-dependent long-acting ROS products were shown to be involved. Our data confirm MPO as an important granule-derived constituent for the ROS-dependent g-MDSC activity. But additional factors released by degranulation may also play a role. For instance, arginase-1 is an enzyme that is stored in granules and converts L-arginine into urea and L-ornithine,18,45,46 which has g-MDSC activity in mouse models.47 Arginase results in a shortage of L-arginine in T cells, a decrease in the expression of the TCR-CD3 ζ chain, and lack of cell cycle regulators.20,48
The production of ROS, the mobilization of granule proteins, and the intercellular contact for trogocytosis collectively result in a population of small FSClow T cells. Although cell-cell contact is required for trogocytosis to occur, the appearance of small T cells is not its immediate consequence, because in cocultures with activated CGD neutrophils (which lack any MDSC activity), small T cells did not appear, whereas trogocytosis was not impaired (data not shown). Neutrophil trogocytosis does occur at an early stage during the multistep process of exerting its full g-MDSC activity and may be an initial necessary but not sufficient step in this process. Thus, the exact role of trogocytosis in the multistep process leading to the eventual generation of small, energy-deprived T cells remains unclear at the moment and needs further study.
We attempted to define the process of the damaged small T-cell subset undergoing inevitable cell death by ROS and degranulation upon neutrophil activation. MDSCs consisting of myeloid cells different from neutrophils have been reported to inhibit T-cell proliferation by the induction of apoptosis.49,50 The small T cells described in this study did not show important hallmarks of apoptosis (ie, active caspase-3 and extracellular phosphatidylserine exposure). Although the small T cells were permeable (Hoechst+), the cells did not completely disintegrate (CFSE+ for at least 6 days). Instead of the typical cell swelling in case of necrosis,51 we observed cell shrinkage. As demonstrated in additional experiments, classical apoptosis and necroptosis inhibitors (pan-caspase inhibitor zVAD and the RIPK1 kinase inhibitor necrostatin-1, respectively) were unable to fully prevent T-cell damage by MDSC activity of activated mature neutrophils. To describe this specific process of T-cell death by MDSC activity remains challenging. This type of cell death seems to depend not only on the known cell death mechanisms of apoptosis and necroptosis. Autophagy also seems unlikely as the major pathway involved in the induction of T-cell damage because we did not detect any of the typical hallmarks of an autophagy-dependent nonapoptotic form of cell death characterized by focal ballooning of the perinuclear space, vacuoles with a double membrane, or dilation and fragmentation of endoplasmic reticulum (autosis)52 in electron microscopy images. Electron microscopy imaging showed clear blebbing at the cell border and morphologic alterations of the mitochondria and endoplasmic reticulum. This together with the altered expression of surface markers and cellular adenosine triphosphate depletion explains the observed nonresponsive and damaged state of this small T-cell subset. We may speculate on the sequential steps during or after trogocytosis by neutrophils by perturbing the cell membrane and underlying cortical actin from the T cells. Once damaged, these T cells get smaller in size and show a blebbing morphology resulting from a discontinuous actin layer after 1 or 2 days. Mitochondria stop functioning and the cell membrane becomes permeable.
In conclusion, we describe the multifaceted mechanism by which activated mature neutrophils suppress T-cell proliferation in humans. In a CD11b-dependent interaction with T cells, a multistep process involving ROS formation and degranulation results in nonapoptotic but irreparable T-cell damage undergoing relatively slow but inevitable cell death (supplemental Figure 7). In the resulting small T cells, neutrophil-derived substances may act as the effector molecules that convey definite T-cell suppression by metabolic stress and cell damage without complete T-cell disintegration. Whether g-MDSC activity of neutrophils can be selectively inhibited when treating cancer53 while leaving the effector mechanisms of neutrophils against microbial pathogens unaffected remains to be clarified. Identification of such selective inhibitors will be of great importance for clinical practice, especially when treating cancer patients.
Acknowledgments
The authors thank the patients, parents, and treating physicians for their cooperation; M. van den Biggelaar, M. von Lindern, D. Roos, and R. van Lier for reading the manuscript and providing helpful comments; and Simon Tol, Mark Hoogenboezem, and Eric Gouwerok for their technical support.
This work was supported by grants from Sanquin Blood Supply Product and Process Development Cellular Products Fund (PPOC 2089 and 1873).
Authorship
Contribution: T.W.K. and I.H.H. (principal investigators) conceived and designed the study; C.E.M.A., I.H.H., S.B., M.v.H., A.T.J.T., E.M., M.H.J., H.J., and F.P.J.v.A. performed the experiments; T.K.v.d.B. contributed to the design of the study; C.E.M.A. and I.H.H. initiated many of the experiments, performed the analysis, and wrote the manuscript together with T.W.K., E.P.B., and A.J.H; mass spectrometry analysis was performed under the supervision of A.B.M; and J.-P.d.B. and C.L.Z. assisted with sample collection from patients with head-and-neck cancer and provided clinical information.
Conflict-of-interest disclosure: The authors declare no competing financial interests.
Correspondence: Cathelijn Aarts, Department of Blood Cell Research, Sanquin Research and Landsteiner Laboratory, AMC, University of Amsterdam, Plesmanlaan 125, 1066 CX Amsterdam, The Netherlands; e-mail: c.aarts@sanquin.nl.

