

Key Points
Overexpression of WT1 and PRAME are common in MDS patients with thrombocytopenia. Both are independent poor prognostic factor for outcome.
The evaluation of WT1/PRAME transcript analysis can better risk-stratify the patients, thus guiding individualized treatment.

Abstract
Thrombocytopenia is associated with life-threatening bleeding and is common in myelodysplastic syndromes (MDS). Robust molecular prognostic biomarkers need to be developed to improve clinical decision making for patients with MDS with thrombocytopenia. Wilms tumor 1 (WT1) and preferentially expressed antigen in melanoma (PRAME) are promising immunogenic antigen candidates for immunotherapy, and their clinical effects on patients with MDS with thrombocytopenia are still not well understood. We performed a multicenter observational study of adult patients with MDS with thrombocytopenia from 7 different tertiary medical centers in China. We examined bone marrow samples collected at diagnosis for WT1 and PRAME transcript levels and then analyzed their prognostic effect for patients with MDS with thrombocytopenia. In total, we enrolled 1110 patients diagnosed with MDS with thrombocytopenia. Overexpression of WT1 and PRAME was associated with elevated blast percentage, worse cytogenetics, and higher Revised International Prognostic Scoring System (IPSS-R) risk. Further, both WT1 and PRAME overexpression were independent poor prognostic factors for acute myeloid leukemia evolution, overall survival, and progression-free survival. Together, the 2 genes overexpression identified a population of patients with MDS with substantially worse survival. On the basis of WT1 and PRAME transcript levels, patients with MDS with IPSS-R low risk were classified into 2 significantly divergent prognostic risk groups: a low-favorable group and a low-adverse group. The low-adverse group had survival similar to that of patients in the intermediate-risk group. Our study demonstrates that the evaluation of WT1/PRAME transcript analysis may improve the prognostication precision and better risk-stratify the patients.
Introduction
The myelodysplastic syndromes (MDS) comprise a group of clonal bone marrow stem cell disorders characterized by ineffective hematopoiesis, peripheral cytopenias, and propensity to acute myeloid leukemia (AML) transformation.1-3 Thrombocytopenia is common in MDS and leads to significant mortality because of life-threatening bleeding risk and increased risk for transformation to AML.4 The initial cytopenia presentation of patients with MDS with thrombocytopenia can be variable, including isolated thrombocytopenia, bicytopenia, and pancytopenia. At this time, there is no information available on the differences in clinical profiles and prognosis among different cytopenia subtypes. Especially for patients with MDS with isolated thrombocytopenia, the diagnosis of immune thrombocytopenia rather than MDS may initially occur,5-8 as different kinds of causes, from normal variants to severe congenital and acquired disorders, can be responsible for thrombocytopenia. Given the difficulty of diagnosis coupled with the fact that MDS with thrombocytopenia subtype is poorly described, proper workup of both patient and disease features is essential to provide diagnostic and therapeutic strategy recommendations.
MDS are a group of heterogeneous disorders for which customized treatment plans are tailored to the predicted prognosis, which makes the precise prediction of the prognosis necessary for the management of patients. Current prognostic scoring systems stratify patients with MDS into different risk groups on the basis of clinical/hematological parameters, but not of molecular genetic characteristics. The current scoring systems of MDS need to be improved in the future because of the poor interobserver concordance of morphologic evaluation variables and the fact that approximately 50% of patients lack informative cytogenetic abnormalities.9 It is essential that more multicenter prospective studies are devoted to developing robust prognostic factors. Recently, some somatic mutations have been linked to the prognosis of patients with MDS. Although our burgeoning knowledge of gene sequencing could provide novel insights into the prognostic effects of somatic mutations in patients with MDS , no specific mutation has been detected in some patients with MDS , and this approach with low mutation frequency and interpatient variation has been complicated by reports of frequent somatic mutations in the aging healthy population.10 Significantly, the assessment of associated genes can be accomplished through detecting transcript levels, with the advantages of simplicity and wide applicability in clinical practice.
Wilms tumor 1 (WT1) and preferentially expressed antigen in melanoma (PRAME) are promising immunogenic antigens candidates for specific immunotherapy.11,12 WT1 is a transcription factor that plays a critical role in regulating myeloid differentiation in hematopoiesis. During hematopoiesis, abnormal expression of WT1 retards cell proliferation and/or differentiation.13-15 PRAME encodes a tumor-associated antigen that is preferentially expressed in human melanoma.16 PRAME has been described to be a repressor of retinoic acid (RA) signaling, capable of inhibiting RA-induced hematopoietic differentiation, cell cycle arrest, and apoptosis.17-20 Accumulating evidence has suggested that WT1 and PRAME are overexpressed in many malignant neoplasms, including leukemia and MDS.21-26 Both WT1 and PRAME have been shown to be associated with MDS clone.21,23,27-29 Previous studies have demonstrated the prognostic significance and the usefulness of monitoring minimal residual disease of WT1 and PRAME expression level in patients with acute leukemia.23,25,26,30,31 However, the prognostic significance of WT1 and PRAME is not yet well understood in patients with MDS with thrombocytopenia. A combination of current prognostic scoring systems with WT1 and PRAME transcript levels may further guide the design of individualized treatment of patients with MDS. To address the question, transcript levels of WT1 and PRAME were detected from a large set of samples of patients with MDS with thrombocytopenia to investigate whether WT1 and PRAME can predict long-term prognosis in our study.
Materials and methods
Patients and study design
We conducted a retrospective multicenter analysis in adult patients presenting with thrombocytopenia at the onset of MDS. We have reviewed all the patients who were diagnosed with MDS between July 2007 and February 2018 from 7 different tertiary medical centers in China. The diagnosis of MDS was confirmed on the basis of standard criteria.1-3,32,33 Two experts separately assessed all cytogenetic studies to identify the abnormalities. We included 1110 patients with MDS with thrombocytopenia from 6582 patients with MDS. According the number of cytopenia lines at the onset of the disease, 191 patients with isolated thrombocytopenia (group A), 389 patients with bicytopenia (group B), and 530 patients with pancytopenia (group C) were enrolled in this study (as shown in Figure 1). All samples and clinical data were collected with patient consent under an institutional review board-approved protocol in accordance with the Declaration of Helsinki. Patient clinical profiles are shown in Table 1.

Clinical profile of patients with MDS with thrombocytopenia
| Feature | Isolated thrombocytopenia (n = 191) | Bicytopenia (n = 389) | Pancytopenia (n = 530) | P |
|---|---|---|---|---|
| Age at diagnosis, y | 56 (37-68) | 57 (38.5-66) | 53 (38-63) | .056 |
| Sex | .137 | |||
| Female | 95 (49.7) | 162 (41.6) | 247 (46.6) | |
| Male | 96 (50.3) | 227 (58.4) | 283 (53.4) | |
| Cytopenias | ||||
| Hb, g/dL | 117 (108-131) | 94 (69-113) | 71 (58-84) | .000 |
| ANC, ×109/L | 3.0 (2.2-4.7) | 1.9 (1.2-3.2) | 0.9 (0.5-1.3) | .000 |
| Platelets, × 109/L | 46 (31-67) | 46 (25-70) | 35 (18-63) | .000 |
| Severe thrombocytopenia | 19 (9.9) | 64 (16.5) | 152 (28.7) | .000 |
| Moderate thrombocytopenia | 87 (45.5) | 144 (37.0) | 180 (34.0) | |
| Bone marrow blasts, % | 2.5 (1.0-5.0) | 4.0 (1.8-8.5) | 4.0 (1.2-10.5) | .000 |
| WHO classification | .000 | |||
| MDS-SLD | 26 (13.6) | 59 (15.2) | 82 (15.5) | |
| MDS-MLD | 9 (4.7) | 25 (6.4) | 23 (4.3) | |
| MDS-RS | 2 (1.0) | 5 (1.3) | 6 (1.1) | |
| 5q- | 0 | 0 | 1 (0.2) | |
| MDS-EB-1 | 44 (23.0) | 108 (27.8) | 103 (19.4) | |
| MDS-EB-2 | 19 (9.9) | 84 (21.6) | 149 (28.1) | |
| MDS-U | 91 (47.6) | 108 (27.8) | 166 (31.3) | |
| Cytogenetic risk | ||||
| Very good | 3 (1.6) | 8 (2.1) | 7 (1.3) | .037 |
| Good | 110 (57.6) | 227 (58.4) | 291 (54.9) | |
| Intermediate | 63 (33.0) | 103 (26.5) | 135 (25.5) | |
| Poor | 8 (4.2) | 19 (4.9) | 38 (7.2) | |
| Very poor | 7 (3.7) | 32 (8.2) | 59 (11.1) | |
| MK | 13 (6.8) | 61 (15.7) | 77 (14.5) | .014 |
| IPSS-R | ||||
| Very low | 25 (13.1) | 13 (3.3) | 0 (0.0) | .000 |
| Low | 85 (44.5) | 79 (20.3) | 49 (9.2) | |
| Intermediate | 32 (16.8) | 144 (37.0) | 170 (32.1) | |
| High | 34 (17.8) | 91 (23.4) | 138 (26.0) | |
| Very high | 15 (7.9) | 62 (15.9) | 173 (32.6) | |
| AML evolution | 24 (12.6) | 61 (15.7) | 121 (22.8) | .002 |
Data are n (%) or median (interquartile range).
5q-, MDS with isolated del(5q); ANC, absolute neutrophil count; Hb, hemoglobin; IPSS-R, Revised International Prognostic Scoring System; MDS-EB, MDS with excess blasts; MDS-MLD, MDS with multilineage dysplasia; MDS-RS, MDS with ring sideroblasts; MDS-SLD, MDS with single-lineage dysplasia; MDS-U, MDS-unclassifiable; MK, monosomal karyotype; WBC, white blood cell.
RNA extraction, complementary DNA synthesis, and RQ-PCR
We analyzed pretreatment bone marrow samples from adult patients with MDS with thrombocytopenia enrolled in our study. Samples for evaluation were available for 1042 patients for WT1 transcript levels and 529 patients for PRAME. Total RNA extraction, reverse transcription of RNA, and TaqMan-based RQ-PCR technology measurement of WT1 and PRAME transcript were performed as we previously described.23,25,26,30,31,34 The housekeeping gene Abelson (ABL) was selected as a control gene for RNA expression. All samples were analyzed in duplicate. The transcript levels were calculated as WT1 or PRAME transcript copy number/ABL copy number in percentage.
Treatment regimen
The regimen included allogeneic hematopoietic stem cell transplantation (allo-HSCT), chemotherapy, hypomethylating agents (HMA), and supportive care, as previously published.35-37
Pretransplant conditioning therapy consisted of simustine, busulfan, cyclophosphamide, cytarabine, and rabbit antithymocyte globulin. Short-term methotrexate, mycophenolate mofetil, and cyclosporine A were used for graft-versus-host disease prophylaxis. All HSCT recipients were treated with granulocyte colony stimulating factor-mobilized, fresh, unmanipulated bone marrow cells, and peripheral blood stem cells. Stem cell harvesting, HLA typing, and donor selection were performed as described previously.38
Different intensive therapies were given to 174 patients with WT1 or PRAME overexpression. A total of 124 patients underwent allo-HSCT, and 50 patients only received chemotherapy or HMA.
Definitions
Cytopenia in MDS was defined as: hemoglobin lower than 10 g/dL, platelet count lower than 100 × 109/L, and absolute neutrophil count lower than 1.8 × 10⁹/L.1-3,32,33,39 Severe thrombocytopenia was defined as PLT lower than 20 × 109/L, moderate thrombocytopenia was defined as PLT 20 to 50 × 109/L, and mild thrombocytopenia was defined as PLT 50 to 100 × 109/L.4,6 Constant cytopenia was defined as at least 6 months unless cytogenetic studies revealed MDS.1-3,33 Bicytopenia in our study was defined as blood cell count that satisfied platelet count lower than 100 × 109/L and 1 of 2 followed the following criteria: hemoglobin lower than 10 g/dL and absolute neutrophil count lower than 1.8 × 10⁹/L. Pancytopenia was defined as hemoglobin lower than 10 g/dL, platelet count lower than 100 × 109/L, and absolute neutrophil count lower than 1.8 × 10⁹/L. We considered MDS with isolated thrombocytopenia as when the initial neutrophil count was more than 1.8 × 10⁹/L and the hemoglobin concentration was more than 100 g/L, but the initial platelet count was less than 100 × 109/L.4,6
Response criteria were listed in the supplemental Table 1, according to the report of the International Working Group.40
Statistical analysis
We summarized patient profiles with frequencies and percentages for categorical variables and medians and interquartile range for continuous variables. We compared the baseline characteristics among groups with a χ2 test for categorical variables and variance tests (ANOVA) or Kruskal-Wallis H for continuous variables. We measured OS, progression-free survival (PFS), and time to evolution to AML from the time of diagnosis of MDS. We estimated the OS, PFS, and time to evolution to AML with Kaplan-Meier techniques and used a log-rank test to assess potential differences between subgroups. For univariable and multivariable survival analysis, we used Cox proportional hazards regression to identify the independent prognostic significance of WT1 and PRAME for OS, PFS, and evolution to AML. Only patients with complete information of both WT1 and PRAME transcript levels were included in the multivariable analysis. We constructed Cox models to select variables by enter method, adjusting for clinical and hematological characteristics, with candidate variables having a univariable P < .10.
We used receiver operating characteristic (ROC) curves to explore WT1 and PRAME transcript level cutoff values that best differentiated patients with MDS with respect to the higher-risk group. We used the Youden index (sensitivity + specificity − 1) to calculate the optimal thresholds along the receiver operating characteristic curves. We classified a 2-sided P < .05 as significant. We carried out statistical analyses using the IBM SPSS software package (version 20.0).
Results
Demographic and clinical features of patients with MDS with thrombocytopenia
We screened 6582 patients with MDS and a total of 1110 patients with MDS with thrombocytopenia (191 isolated thrombocytopenia, 389 bicytopenia, 530 pancytopenia) met the inclusion criteria for this study. The demographic details and clinical characteristics were provided in Table 1. In the isolated thrombocytopenia group, the median cell counts at the time of onset were Hb 117 g/dL, ANC 3.0 × 10⁹/L, and PLT 46 × 109/L. A total of 118 (61.8%) patients still manifested isolated thrombocytopenia, whereas 45 (23.6%) had progressed to bicytopenia and 28 (14.6%) had progressed to pancytopenia by the time of bone marrow examination diagnosis.
The bone marrow blasts of the isolated thrombocytopenia group were fewer in comparison with the bicytopenia and pancytopenia group (median bone marrow blasts, 2.5%, 4.0%, and 4.0%; P = .000). MDS-U and MDS-EB1 comprised the majority of subtypes in the isolated thrombocytopenia group (representing 47.6% and 23.0% of patients), followed by MDS-SLD (13.6%), MDS-EB2 (9.9%), and MDS-MLD (4.7%). The most frequent World Health Organization (WHO) subtype in patients with bicytopenia and pancytopenia was MDS-EB (49.4% of bicytopenia and 47.5% of pancytopenia). Compared with the other 2 groups, patients with isolated thrombocytopenia had better cytogenetics and lower Revised International Prognostic Scoring System (IPSS-R). With the increase of cytopenia lines, the probability of AML evolution increased (12.6% of isolated thrombocytopenia, 15.7% of bicytopenia, and 22.8% of pancytopenia; P = .002; Table 1; Figure 2A).

Probability of AML evolution for patients with MDS according to cytopenia lines and WT1/PRAME transcript levels. (A) Probability of AML evolution for all patients with MDS based on cytopenia lines. (B) Probability of AML evolution for patients with MDS based on WT1 transcript levels. (C) Probability of AML evolution for patients with MDS based on PRAME transcript levels.
Probability of AML evolution for patients with MDS according to cytopenia lines and WT1/PRAME transcript levels. (A) Probability of AML evolution for all patients with MDS based on cytopenia lines. (B) Probability of AML evolution for patients with MDS based on WT1 transcript levels. (C) Probability of AML evolution for patients with MDS based on PRAME transcript levels.
Median follow-up of the whole patient cohort was 36 months. OS and PFS for the isolated thrombocytopenia group were longer than the bicytopenia and pancytopenia groups (P = .005 for OS and P = .008 for PFS; Figure 3A,D), demonstrating the favorable prognosis.

OS and PFS of patients with MDS according to cytopenia lines and WT1/PRAME transcript levels. OS (A) and PFS (D) of patients with MDS based on cytopenia lines. OS (B) and PFS (E) of patients with MDS based on the presence and absence of WT1 high expression. OS (C) and PFS (F) of patients with MDS based on the presence and absence of PRAME high expression.
OS and PFS of patients with MDS according to cytopenia lines and WT1/PRAME transcript levels. OS (A) and PFS (D) of patients with MDS based on cytopenia lines. OS (B) and PFS (E) of patients with MDS based on the presence and absence of WT1 high expression. OS (C) and PFS (F) of patients with MDS based on the presence and absence of PRAME high expression.
WT1 and PRAME gene transcript levels
The median WT1 and PRAME expression levels in bone marrow samples from patients with MDS with thrombocytopenia were 2.10% (interquartile range, 0.42%-8.30%) and 1.00% (interquartile range, 0.20%-19.65%). In total, 73.1% of patients with MDS with thrombocytopenia had higher WT1 transcript levels over the normal range, and 67.3% of patients had higher PRAME transcript levels over the normal range, as we previously described.34 WT1 and PRAME were highly expressed in patients with MDS with thrombocytopenia (supplemental Table 2; supplemental Figure 1). The transcript levels of WT1 and PRAME gradually grew with the increase in risk stratification (supplemental Figure 2).
Receiver operating characteristic curve analysis revealed that WT1 and PRAME transcript levels could significantly differentiate patients with respect to higher risk (IPSS-R high risk and very high risk; area under the curve, 0.670 [P = .000] for WT1; area under the curve, 0.687 [P = .000] for PRAME). The Youden index indicated that 4.9% and 0.3% were the optimal thresholds for WT1 and PRAME. Therefore, WT1 transcript levels higher than 4.9% and PRAME transcript levels higher than 0.3% were regarded as overexpression in our study (supplemental Figure 3).
The WT1 overexpression was identified in 27%, 33%, and 39% of patients (difference between isolated thrombocytopenia group and pancytopenia group, P = .006), and PRAME overexpression was identified in 58%, 66%, and 69% of patients of the isolated thrombocytopenia, bicytopenia, and pancytopenia group, respectively (P = .061). The frequency of PRAME overexpression was similar among 3 groups.
Clinical associations with WT1 and PRAME
To further correlate the role of WT1 and PRAME transcript levels with prognosis, clinicohematological characteristics were analyzed. For each gene, we compared the clinical features of patients who had WT1 and PRAME overexpression with those of patients who did not. Patients with overexpression of WT1 and PRAME were more likely to have an elevated blast percentage, worse cytogenetics, and higher IPSS-R risk compared with those who had not (Figure 4A,C-D). However, no differences were observed with respect to the severity of thrombocytopenia for both WT1 and PRAME (supplemental Figure 4).

Proportions of patients with WT1 and PRAME transcript levels, according to blast percentage, WHO classification, cytogenetics, and IPSS-R. Data are shown for the percentage of blasts in bone marrow aspirate (A), WHO classification (B), cytogenetics (C), and IPSS-R (D) at the time of MDS diagnosis. Overexpression of WT1 and PRAME were associated with elevated blast percentage (defined as ≥5%; P = .000 and P = .000 for WT1 and PRAME, respectively) (A), worse cytogenetics (P = .000 and P = .000 for WT1 and PRAME, respectively) (C), and IPSS-R higher risk (P = .000 and P = .000 for WT1 and PRAME, respectively) (D).
Proportions of patients with WT1 and PRAME transcript levels, according to blast percentage, WHO classification, cytogenetics, and IPSS-R. Data are shown for the percentage of blasts in bone marrow aspirate (A), WHO classification (B), cytogenetics (C), and IPSS-R (D) at the time of MDS diagnosis. Overexpression of WT1 and PRAME were associated with elevated blast percentage (defined as ≥5%; P = .000 and P = .000 for WT1 and PRAME, respectively) (A), worse cytogenetics (P = .000 and P = .000 for WT1 and PRAME, respectively) (C), and IPSS-R higher risk (P = .000 and P = .000 for WT1 and PRAME, respectively) (D).
AML evolution association with WT1 and PRAME
We also analyzed the correlation of WT1 and PRAME transcript levels with the risk for AML evolution. Evolution to AML was seen in 206 patients (18.6%), including 9 patients with very low or low-risk disease, 30 patients with intermediate-risk disease, and 167 patients with high-risk or very high risk disease.
Of the 206 patients with evolution to AML, 9 had an unknown WT1 expression level, 102 had an unknown PRAME expression level because of the absence of gene detection, 126 (64.0%) had WT1 overexpression, and 91(87.5%) had PRAME overexpression. Neither WT1 nor PRAME overexpression was detectable in the other 9 patients who progressed to AML. The combination of PRAME and WT1 could cover more patients for predicting AML evolution.
For patients with MDS, the presence of WT1 overexpression was associated with a 34.6% risk for AML evolution compared with a 10.5% risk without WT1 overexpression (P = .000). Likewise, the presence of PRAME overexpression was also related to a 26.1% risk for AML evolution compared with a 7.2% risk without PRAME overexpression (P = .000). MDS with WT1 or PRAME overexpression more likely evolved to AML (Figure 2B-C). Multivariate COX analyses showed that WT1 and PRAME overexpression were independent predictors of AML evolution (Table 2).
Univariable and multivariable analyses (COX regression) identifying independent risk factors for AML evolution of patients with MDS with thrombocytopenia
| Variable | AML evolution | |||
|---|---|---|---|---|
| Univariate Cox | Multivariate Cox | |||
| HR (95% CI) | P | HR (95% CI) | P | |
| Age (≧60 y vs <60 y) | 0.949 (0.714-1.263) | .721 | ||
| Sex (male vs female) | 1.610 (1.209-2.144) | .001 | 1.350 (.893-2.042) | .155 |
| IPSS-R (higher risk vs lower risk) | 2.386 (2.047-2.780) | .000 | 4.692 (2.668-8.252) | .000 |
| WT1 (≥4.9% vs <4.9%) | 3.635 (2.716-4.865) | .000 | 1.663 (1.099-2.516) | .016 |
| PRAME (≥0.3% vs <0.3%) | 3.955 (2.211-7.074) | .000 | 1.879 (1.019-3.468) | .044 |
The prognostic significance of WT1 and PRAME transcript levels
First, we examined the hazard ratio (HR) of death and progression associated with WT1 and PRAME. In this univariate analysis, WT1 and PRAME overexpression were both associated with shorter OS and PFS (Tables 3 and 4; Figure 3). Some patient and disease clinical features are known to influence survival for MDS, including age, sex, cytopenia lines, IPSS-R, and treatment options. We then examined how these variables were associated with OS and PFS in our cohort. Patients who were ≧60 years of age, male, higher risk, and in group B and C and who received chemotherapy or HMA had worse OS. Likewise, patients who were ≧60 years of age, male, higher risk, and in group B and C had worse PFS. There were no statistically differences in OS for patients stratified by thrombocytopenia (supplemental Figure 5C).
Univariable and multivariable analyses (COX regression) identifying independent risk factors for OS of patients with MDS with thrombocytopenia
| Variable | OS | ||||
|---|---|---|---|---|---|
| Univariate Cox | Multivariate Cox | ||||
| HR (95% CI) | P | HR (95% CI) | P | ||
| Age (≧60 y vs <60 y)* | 2.708 (2.066-3.551) | .000 | 1.458 (0.960-2.214) | .077 | |
| Sex (male vs female) | 1.575 (1.190-2.085) | .001 | 1.297 (0.863-1.951) | .211 | |
| IPSS-R (higher risk vs lower risk) | 2.940 (2.142-4.035) | .000 | 2.867 (1.715-4.793) | .000 | |
| Group (C&B vs A) | 1.957 (1.280-2.992) | .002 | 1.846 (1.003-3.398) | .049 | |
| WT1 (≥4.9% vs <4.9%) | 1.782 (1.348-2.357) | .000 | 1.522 (1.011-2.292) | .044 | |
| PRAME (≥0.3% vs <0.3%) | 3.104 (1.852-5.203) | .000 | 1.855 (1.040-3.308) | .036 | |
| Treatment (HSCT vs chemotherapy and HMA) | 0.505 (0.346-0.735) | .000 | 0.355 (0.193-0.653) | .001 | |
Group A, isolated thrombocytopenia group; Group B, bicytopenia group; Group C, pancytopenia group; HSCT, hematopoietic stem cell transplantation; OS, overall survival; PFS, progression-free survival PRAME, preferentially expressed antigen of melanoma; WT1, Wilms tumor 1.
Age was included in the analysis as a categorical variable on the basis of a best-split algorithm showing a statistical difference in OS between patients younger than 60 years and those aged 60 years or older (supplemental Figure 5A-B,D-E).
Univariable and multivariable analyses (COX regression) identifying independent risk factors for PFS of patients with MDS with thrombocytopenia
| Variable | PFS | ||||
|---|---|---|---|---|---|
| Univariate Cox | Multivariate Cox | ||||
| HR (95% CI) | P | HR (95% CI) | P | ||
| Age (≧60 y vs <60 y)* | 2.420 (1.847-3.171) | .000 | 1.152 (0.801-1.655) | .446 | |
| Sex (male vs female) | 1.726 (1.302-2.288) | .000 | 1.388 (0.987-1.952) | .060 | |
| IPSS-R (higher risk vs lower risk) | 3.467 (2.518-4.773) | .000 | 3.045 (1.950-4.755) | .000 | |
| Group (A and B vs C) | 1.937 (1.257-2.985) | .003 | 1.126 (0.700-1.812) | .624 | |
| WT1 (≥4.9% vs <4.9%) | 2.147 (1.622-2.842) | .000 | 1.521 (1.077-2.146) | .017 | |
| PRAME (≥0.3% vs <0.3%) | 3.342 (1.993-5.604) | .000 | 1.801 (1.114-2.914) | .016 | |
| Treatment (HSCT vs Chemotherapy and HMA) | 0.710 (0.488-1.034) | .074 | 0.799 (0.514-1.241) | .318 | |
Age was included in the analysis as a categorical variable on the basis of a best-split algorithm showing a statistical difference in OS between patients younger than 60 years and those aged 60 years or older (supplemental Figure 5A-B,D-E).
WT1 and PRAME overexpression often occur together in the same patient, and both are associated with IPSS-R. To determine the relative contribution of gene expression level to survival, we generated a multivariable Cox regression model using an enter procedure incorporating age, sex, IPSS-R, cytopenia lines, treatment, and gene transcript levels. As expected, the IPSS-R was strongly associated with OS and PFS. WT1 and PRAME overexpression also emerged as independent predictors of OS and PFS (Table 3-4). This analysis indicated that evaluation of the expression levels of WT1 and PRAME would add additional prognostic value and be complementary to the IPSS-R.
WT1 and PRAME overexpression occurred in largely overlapping groups of patients, and approximately 30% had an overexpression in at least 1 of these 2 genes. In addition, patients with MDS with overexpression of both WT1 and PRAME had significantly lower OS and PFS compared with those of the patients with either WT1 or PRAME overexpression (P = .013 for OS and P = .001 for PFS; Figure 5B,E). Together, the 2 genes identified a population of patients with substantially worse OS and PFS.

OS and PFS of patients with MDS according to IPSS-R and WT1 and PRAME transcript levels. Patients with MDS were grouped according to favorable (low WT1 or low PRAME) or adverse (high WT1 or high PRAME) expression profiles. Therefore, the proposed score was drawn up by assigning a value of 0 for each gene expressing a favorable RNA level and a value of 1 for each gene with an adverse expression profile. OS (A) and PFS (D) of patients with MDS based on IPSS-R. OS (B) and PFS (E) of patients with MDS based on WT1/PRAME score. It distinguished 3 subsets of patients with different OS (P < .001) and PFS (P < .001). The OS and PFS for patients with both WT1 and PRAME overexpression were significantly lower than that those for patients with either WT1 or PRAME overexpression (P = .013 for OS; P = .001 for PFS, respectively). OS (C) and PFS (F) of patients with MDS in the next-highest IPSS risk group is included for the purpose of comparison, P values were calculated between low-risk patients with WT1/PRAME overexpression and intermediate patients.
OS and PFS of patients with MDS according to IPSS-R and WT1 and PRAME transcript levels. Patients with MDS were grouped according to favorable (low WT1 or low PRAME) or adverse (high WT1 or high PRAME) expression profiles. Therefore, the proposed score was drawn up by assigning a value of 0 for each gene expressing a favorable RNA level and a value of 1 for each gene with an adverse expression profile. OS (A) and PFS (D) of patients with MDS based on IPSS-R. OS (B) and PFS (E) of patients with MDS based on WT1/PRAME score. It distinguished 3 subsets of patients with different OS (P < .001) and PFS (P < .001). The OS and PFS for patients with both WT1 and PRAME overexpression were significantly lower than that those for patients with either WT1 or PRAME overexpression (P = .013 for OS; P = .001 for PFS, respectively). OS (C) and PFS (F) of patients with MDS in the next-highest IPSS risk group is included for the purpose of comparison, P values were calculated between low-risk patients with WT1/PRAME overexpression and intermediate patients.
The survival analysis for integration of gene expression analysis into the IPSS-R is shown in Figure 5. According to WT1 and PRAME transcript levels, patients with MDS with IPSS-R low risk were classified into 2 prognostic risk groups, a low-favorable group and a low-adverse group, and they had divergent outcomes. The characteristics were shown in supplemental Table 3. MDS-U and MDS-SLD comprised the majority of subtypes in both groups. No statistical difference was observed in the WHO classification, cytogenetic risk, or other clinical variables. The patients in the low-adverse group had an OS similar to that of patients in the intermediate-risk group (Figure 5C,F; supplemental Figure 6). The 2 molecular biomarkers could reclassify patients in the IPSS-R low-adverse group to the intermediate-risk subgroup. These patients may benefit from earlier initiation of disease-modifying therapy.
Response to treatment of patients with WT1/PRAME overexpression
A total of 174 patients with WT1/PRAME overexpression initiated intensive treatment as a result of higher-risk disease at diagnosis or evidence of disease progression, including 124 patients in the allo-HSCT group and 50 patients in the chemotherapy or HMA group. Data on the patient- and treatment-related characteristics of both treatment groups were listed in supplemental Table 4 and 5.
The OS and PFS of patients with MDS in the HSCT group were better than those in the chemotherapy and HMA group (P = .000 for OS and P = .000 for PFS; Figure 6). In univariate and multivariate analyses (COX regression), undergoing HSCT was an independent factor associated with better OS (Table 3).
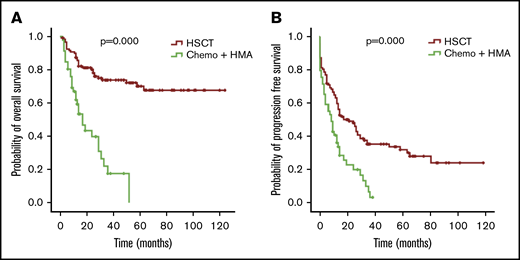
OS and PFS of patients with MDS with thrombocytopenia according to treatment. OS (A) and PFS (B) for the 174 patients with MDS, respectively.
OS and PFS of patients with MDS with thrombocytopenia according to treatment. OS (A) and PFS (B) for the 174 patients with MDS, respectively.
Discussion
To identify the disease features and explore the prognostic value of WT1 and PRAME in patients with MDS with thrombocytopenia, the transcript levels of WT1 and PRAME were detected from a large set of patients with MDS with thrombocytopenia at diagnosis. Our findings suggest that WT1/PRAME overexpression at diagnosis is associated with shorter OS and PFS, and high probability of AML evolution. The combination of WT1/PRAME transcript analysis with risk group may improve the prognostication precision in clinical practice.
The diagnosis of MDS is usually initially considered by cytopenia. Thrombocytopenia is a common and serious, life-threatening bleeding complications leading to significant mortality. The prevalence of isolated thrombocytopenia as a first manifestation at the onset of MDS was previously reported to be 1% to 12%.8 Approximately 30% of these patients were originally presumed to have immune thrombocytopenia.8 Patients with MDS with isolated thrombocytopenia are a challenge to clinicians because of the difficulty of diagnosis and lack of well-established treatment strategy. Observations from some prior studies have implied that patients with MDS with isolated thrombocytopenia have a relatively favorable prognosis.7 One recent study came to the opposite conclusion.8 However, the data were obtained from cases or smaller sample descriptive reports.5,7,8 Here, our data demonstrate that patients with MDS with isolated thrombocytopenia have a favorable prognosis, concordant with the majority of studies. The overexpression of WT1 or PRAME transcript levels are detected in more than half of our patients with thrombocytopenia. Therefore, monitoring WT1 and PRAME transcript levels has the potential to improve the diagnostic accuracy of MDS with thrombocytopenia. In addition, Gonzalez-Porras et al found that severe thrombocytopenia had an adverse prognostic clinical effect in low-risk patients with MDS.41 The assessment of severe thrombocytopenia was important to risk stratification and to further refining clinical decision making. Our results revealed similar negative effects of WT1 and PRAME overexpression for patients with MDS in a low-risk group. This suggested an underlying association between WT1/PRAME and severe thrombocytopenia in low-risk MDS.
MDS are clinically heterogeneous, premalignant disorders that range from conditions with a near-normal life expectancy to situations that are close to AML.42 The fact that MDS have highly variable clinical process makes risk stratification important in clinical decision making. Current scoring systems consider the percentage of bone marrow blasts, cytogenetic findings, classification, and cytopenias to predict the prognosis. However, there is poor interobserver concordance and reproductivity in some morphologic evaluation variables, and approximately half of patients lack informative cytogenetic abnormalities, resulting in silent progression of MDS to AML in different age groups.43 In addition, patients with identical chromosomal abnormalities are often clinically heterogeneous.9,44, Further study is required to develop more robust prognostic factors.
Recently, many studies have focused on the opportunity afforded by WT1 and PRAME in most patients with AML to provide a immunogenic antigens candidate for immunotherapy and to advocate WT1 and PRAME as universal markers for minimal residual disease assessment.45
WT1 gene encodes a transcription factor; its target genes are important for cellular growth and survival, including growth factors, extracellular matrix, and other transcription factors.13,46 It was first identified for its role in the pathogenesis of Wilms tumor.13 The WT1 gene, located at chromosome 11p13, encodes 10 exons and generates a 3-kb mRNA.13 Some studies showed that the degree of WT1 expression was highly associated with the type of MDS, as it was apparently higher in RAEB and s-AML, in contrast to RA.29,47 The bone marrow blasts and risk for AML evolution increased in patients with WT1 overexpression.23,29 In addition, a study showed the correlation between the degree of WT1 transcript levels and the IPSS score.48 The results of these studies implied that abnormal WT1 expression levels could be associated with high risk and may reflect the disease progression. However, these studies lack long-term follow-up observation.
PRAME was first revealed as a tumor-associated antigen via analysis of the specificity of tumor-reactive T-cell clones from the patient with melanoma.48 The human PRAME gene is located at chromosome 22 (22q11.22) and generates an approximately 12-kb mRNA.49 Overexpression of PRAME transcripts was initially associated with an advanced tumor stage and poor prognosis in several solid tumors, such as breast cancer, lung cancer, head and neck cancers, and ovarian cancer. In contrast, preliminary reports in AML indicated that patients with PRAME overexpression usually had a favorable response to chemotherapy and better survival.24,25,50 Information about PRAME expression and its prognostic value in MDS is very limited. Our previous study based on small numbers of patients found that PRAME was commonly overexpressed in MDS, and the transcript levels of WT1 in the high-risk group were higher than in the low-risk group.23 The clinical effect of PRAME on the prognosis of patients with MDS with thrombocytopenia has not, however, been evaluated yet. Based on a large cohort of patients with MDS with thrombocytopenia, our data identify that WT1 and PRAME transcript levels are independent prognostic factors, as their overexpression is correlated with poor OS and PFS, and a higher probability of AML evolution. Simultaneous detection of WT1 and PRAME expression covers more patients with MDS and allows a greater distinction between patients with MDS with significantly different outcomes.
However, the biological explanation of why WT1 and PRAME overexpression is associated with worse prognosis in MDS remains unclear. Recent studies have indicated that WT1 and PRAME are key to regulating hematopoiesis and apoptosis. WT1 overexpression indices increased apoptosis through transcriptional regulation of the Bcl-2 family member Bcl-2, BAK, and A1.51-55 In addition, WT1 overexpression competes with the differentiation-inducing signal mediated by G-CSFR and constitutively activated Stat3, resulting in the blocking of differentiation,56,57 which may be implicated in dysregulated hematopoiesis in MDS. PRAME was reported to be a repressor of RA signaling, capable of inhibiting RA-induced hematopoietic differentiation, cell cycle arrest, and apoptosis.17 Forced PRAME expression in normal hematopoietic progenitors inhibited myeloid differentiation.58 More important, both WT1 and PRAME are related to the MDS clone. WT1 and PRAME overexpression may be driver factors leading to clonal expansion and disease progression in MDS. Li and colleagues found that WT1 was expressed predominantly in MDS clonal cells, rather than in nonclonal cells.27 Similarly, another study revealed that elevated WT1 expression may be related to the presence of preleukemic MDS clones with poor prognostic chromosomal rearrangements.21 Our previous work suggested that PRAME was also overexpressed in the relative mature cells of clonal MDS, which suggested that their overexpression in MDS was related to malignant clonal characteristics.23 Collectively, both WT1 and PRAME overexpression may contribute to deregulated apoptosis and ineffective hematopoiesis and are associated with the MDS clone, which constitute the biological basis of incorporating both WT1 and PRAME in the IPSS-R.
Therefore, it is an attractive strategy to apply WT1- and PRAME-specific immunotherapy to patients with MDS with thrombocytopenia. In addition, WT1 and PRAME transcript levels contribute to distinguishing 2 prognostic subgroups within low-risk patients with MDS. The identification of patients with poor prognosis among those assigned as low risk is important because patients classified as lower risk are not often considered to receive intensive therapy such as bone marrow transplantation and antileukemic chemotherapy. And in Europe, HMA are not licensed to use for patients with MDS in lower risk.59 Our study supports the need for monitoring WT1/PRAME transcript levels and helping guide decision-making toward treatments that aim to alter the natural history of the disease and induce prolonged survival for the low-risk patients with poor prognosis.
As with any survey study, there are certain weaknesses in our study. The first is the retrospective nature of our work. The data for WT1 and PRAME transcript levels were collected retrospectively in our study, which caused incomplete information. Second, the biological mechanism of why overexpression of WT1 and PRAME is associated with a poor prognosis is unclear. Therefore, we are acutely aware that more prospective validations are needed. Regardless of the limitations, clinical and hematological information is sufficient in the majority of our patients, and samples from bone marrow aspiration were homogeneously collected before treatment. Furthermore, the technology of WT1 and PRAME detection has been well established from our large-scale clinical practice. These allow confident predictions to be made. Overall, our findings serve as a proof of concept that the integration of WT1 and PRAME significantly increase the ability to capture prognostic information in patients with MDS at diagnosis and may provide a basis for improving clinical decision making.
In conclusion, for patients with MDS with thrombocytopenia, our findings suggest that WT1/PRAME overexpression at diagnosis predicts poor survival and AML evolution. The integration of WT1/PRAME transcript analysis into risk groups may upstage some low-risk patients and better risk-stratify the patients. Interestingly, the prognosis of patients with MDS with isolated thrombocytopenia is favorable. For patients with higher WT1/PRAME transcript levels, allo-HSCT may be superior to chemotherapy and HMA.
Acknowledgments
The corresponding author had full access to all of the data in the study and had final responsibility for the decision to submit for publication.
This work was supported by National Natural Science Foundation of China (No. 81730004 and No. 81670116), Beijing Natural Science Foundation (No. H2018206423 and No. 7171013), Beijing Municipal Science and Technology Commission (No. Z171100001017084), the National Key Research and Development Program of China (No. 2017YFA0105500, No. 2017YFA0105503), and the Foundation for Innovative Research Groups of the National Natural Science Foundation of China (No.81621001).
The funders of the study had no role in study design, data collection, data analysis, data interpretation, or writing of the report.
Authorship
Contribution: Q.-S.H. and X.-H.Z. were responsible for data collection and management, statistical analysis and interpretation, literature research, and manuscript writing; J.-Z.W., Q.-Z.Z., Q.J., H.J., and J.L. were responsible for data management and statistical analysis; H.-X.L. assisted in statistical analysis; Y.L., J.-B.W., L.S., H.-Y.Z., Z.-L.L., and S.-J.G. were responsible for data collection and management; Y.-Z.Q. and Y.-R.L. performed the gene mutation studies; and B.H., Y.-Y.L., L.-P.X., and X.-J.H. planned, designed, and coordinated the study over the entire period and wrote the manuscript.
Conflict-of-interest disclosures: The authors declare no competing financial interests.
Correspondence: Xiao-Hui Zhang, Peking University People’s Hospital, No. 11 Xizhimen South St, Xicheng District, Beijing 100044, China; e-mail: zhangxh100@ sina.com.

