

Key Points
Inhibition of EV release resulted in accumulation of cellular miR-10a and enhanced apoptosis of BMSCs derived from patients with MM.
Inhibition of miR-10a–enriched EVs from BMSCs also inhibited proliferation of MM cells.

Abstract
Bone marrow stromal cells (BMSCs) interact with multiple myeloma (MM) cells in the bone marrow and create a permissive microenvironment for MM cell proliferation and survival. In this study, we investigated the role of extracellular vesicles (EVs) from BMSCs derived from patients with MM (MM-BMSCs). EV-encapsulated miR-10a expression was high while intracellular miR-10a was low in MM-BMSCs. We therefore hypothesized that miR-10a was packaged into EVs that were actively released into the extracellular space. Inhibition of EV release resulted in accumulation of intracellular miR-10a, inhibition of cell proliferation, and induction of apoptosis in MM-BMSCs. In contrast, proliferation and apoptosis of BMSCs derived from healthy individuals were unaffected by inhibition of EV release. Furthermore, miR-10a derived from MM-BMSCs was transferred into MM cells via EVs and enhanced their proliferation. These results suggest that inhibition of EV release induced apoptosis in MM-BMSCs and inhibited MM cell proliferation, indicating a possible role for MM-BMSC–targeted therapy.
Introduction
Multiple myeloma (MM) is a B-cell neoplasm that affects immunoglobulin-producing plasma cells and is characterized by the accumulation of monoclonal plasma cells in the bone marrow (BM). BM stromal cells (BMSCs) interact with MM cells in vivo and create a permissive microenvironment for MM cell proliferation,1 angiogenesis, metastasis,2 and development of drug resistance.3 Targeting the tumor microenvironment is thus an attractive approach for anticancer therapy.4 Despite improvements associated with new treatment modalities for MM, including proteasome inhibitors and/or immunomodulators,5,6 novel approaches are needed to improve outcomes, particularly in elderly patients. It is therefore necessary to understand the mechanisms that block the complex crosstalk between MM cells and the BM microenvironment (BMME). Strategies targeting the tumor vasculature and inhibiting the protumorigenic inflammatory response of the BMME have been successful, as shown by numerous agents.7-11 Inhibition of tumor cell–BMME interactions might represent another emerging strategy.12-14
Recent advances in cancer biology revealed that extracellular vesicles (EVs) are involved in the regulation of intercellular communication, stimulating interest in their role as a potential target for cancer therapy.15,16 EVs are membrane-wrapped structures that are secreted by most cells and exist in body fluids.17 They can be broadly separated into 2 classes: exosomes (30-120 nm in diameter) and microvesicles (100-500 nm in diameter). Accumulating evidence has shown that EVs contain proteins, lipids, DNA, messenger RNA, microRNA (miRNA), and long noncoding RNA, which can be transferred from producer cells to recipient cells, thus facilitating cell-to-cell communication.18-21 EVs derived from MM cells are considered mediators for BMME targeting endothelial cells, BMSCs, myeloid-derived suppressor cells, and osteoclasts,22-24 whereas BMSC-derived EVs (BMSC-EVs) affect the viability, survival, and drug resistance of MM cells.25,26 EV-based cancer therapies aim to use these vesicles containing miRNA and/or anticancer drugs for targeted delivery to tumor cells.27 We previously reported an antiangiogenic effect of reconstructed EVs that had been rejuvenated by transfection with specific miRNAs (miR-340) from BMSCs derived from young healthy donors,28 providing new insights into EV-based cancer therapy by modification of BMSC-EVs.
The current study investigated the biological properties of EVs and EV miRNAs derived from BMSCs with the goal of establishing novel strategies to target the MM microenvironment. EV miRNA expression differed between BMSCs derived from patients with MM (MM-BMSCs) and from healthy subjects (normal-BMSCs). A subset of miRNAs including miR-10a was selectively increased in EVs derived from MM-BMSCs, whereas these cells showed little or no expression of intracellular miR-10a. This study focused on the role of EV–miR-10a derived from MM-BMSCs in the BMME of patients with MM as a potentially promising target for controlling tumor proliferation in these patients.
Methods
Ethics
The use of patient samples was approved by the Institutional Review Board of Tokyo Medical University (no. 2648, approved 22 April 2014). Written informed consent was obtained from all participants before collection of the specimens, in accordance with the Declaration of Helsinki.
All animal experiments were conducted in compliance with the institutional guidelines of the Animal Experimental Center of Tokyo Medical University/Animal Biosafety Level 2 Laboratory for Use of Animals. The experimental protocols were approved by Tokyo Medical University’s Institutional Animal Care and Use Committee.
MM-BMSCs
Twenty-one patients (age range, 43-82 years; median age, 68.9 years) fulfilling the International Myeloma Working Group diagnostic criteria for MM were included (Table 1). The patients were classified according to the International Staging System as I (n = 8), II (n = 6), or III (n = 7). MM-BMSCs were isolated by using the conventional plastic-adhesion method. Details are provided in the supplemental Methods.
Characteristics of patients with MM
| Sample | Sex | Age, y | MM type | M-protein | PCBM, % | MM-PC cytogenetic alterations (FISH) | CRAB | ISS | FLC, mg/L |
|---|---|---|---|---|---|---|---|---|---|
| MM_1 | M | 67 | IgA κ | 1754 mg/dL | 30 | Normal IGH Tx, and P53 | − | 1 | Normal |
| MM_2 | M | 82 | IgA κ | 2234 mg/dL | 23 | Normal IGH Tx; del P53: 40% | − | 2 | Normal |
| MM_4 | M | 66 | IgG λ | 5818 mg/dL | 48.8 | t(4;14): 61%; normal P53 | − | 3 | 62.6 |
| MM_5 | M | 81 | IgG κ | 3547 mg/dL | 22 | Normal IGH Tx, and P53 | − | 2 | 25 |
| MM_6 | M | 63 | IgG κ | 2270 mg/dL | 50 | Normal IGH Tx, and P53 | Renal | 1 | 165 |
| MM_7 | M | 43 | BJ κ | 1.6 g/d | 15.2 | Normal IGH Tx; del P53: 6% | Plasmacytoma | 1 | 1 222 |
| MM_8 | F | 69 | IgA λ | 3991 mg/dL | 42 | Normal IGH Tx, and P53 | HyperCa, anemia, bone | 2 | 49.6 |
| MM_9 | M | 82 | IgG λ | 7670 mg/dL | 22 | Normal IGH Tx, and P53 | Renal, anemia, bone | 3 | 2 720 |
| MM_10 | F | 77 | BJ λ | 6 g/d | 50 | Normal IGH Tx, and P53 | Bone, plasmacytoma | 1 | 2 500 |
| MM_11 | F | 60 | IgG κ | 6549 mg/dL | 60 | Normal IGH Tx, and P53 | HyperCa, anemia, bone | 2 | 36.3 |
| MM_12 | F | 74 | IgA λ | 2790 mg/dL | 19.2 | t(4;14): 22%; normal P53 | Renal, anemia | 2 | 567 |
| MM_13 | M | 49 | BJ κ | 1.4 g/d | 36 | t(4;14): 38%; normal P53 | Renal, bone | 3 | 16 500 |
| MM_14 | M | 56 | IgA λ | 3484 mg/dL | 14.4 | Normal IGH Tx; del P53: 3% | Anemia, bone | 1 | 128 |
| MM_15 | F | 70 | BJ λ | 9.0 g/d | 70 | Normal IGH Tx, and P53 | Renal, anemia, bone | 3 | 3 100 |
| MM_16 | M | 69 | BJ λ | 7 g/d | 19 | Normal IGH Tx, and P53 | Plasmacytoma | 1 | 402 |
| MM_17 | M | 79 | IgG κ | 3603 mg/dL | 50 | Normal IGH Tx, and P53 | Anemia, bone | 2 | 430 |
| MM_18 | M | 71 | BJ λ | 15 g/d | 18.8 | Normal IGH Tx, and P53 | Bone | 3 | 4 110 |
| MM_19 | F | 62 | IgG λ + BJ λ | 562 mg/dL | 36.8 | Normal IGH Tx, and P53 | Anemia | 1 | 550 |
| MM_20 | F | 74 | IgG κ | 3471 mg/dL | 25 | Normal IGH Tx, and P53 | Bone | 1 | 16.8 |
| MM_21 | F | 68 | IgG λ | 7339 mg/dL | 41.6 | t(4;14): 79%; normal P53 | HyperCa, anemia, bone | 3 | 298 |
| MM_22 | M | 77 | IgG κ | 5669 mg/dL | 54.8 | Normal IGH Tx, and P53 | HyperCa, renal anemia, bone | 3 | 4 050 |
BJ, Bence-Jones; CRAB, hypercalcemia, renal insufficiency, anemia, and bone lesions; F, female; FISH, fluorescence in situ hybridization; FLC, free light chain; IgG, immunoglobulin G; HyperCa, hypercalcemia; ISS, International Staging System; M, male; PCBM, myelomatous plasma cell infiltration in bone marrow; Tx, chromosomal translocation.
Cell culture
Human BMSCs from 2 healthy donors (aged 68 and 72 years; normal-BMSCs) were purchased from Lonza Inc. Normal-BMSCs and MM-BMSCs were seeded in mesenchymal stem cell basal medium (MSCBM) supplemented with SingleQuots (Lonza) at 37°C in a humidified atmosphere containing 5% carbon dioxide. The adherent cells were then harvested by trypsinization and either passaged (passage 1-5) for expansion or analyzed for isolation of EVs.
Human MM cell lines (RPMI 8226, KMS-11, and U266) were purchased from the Health Science Research Resource Bank and cultured in RPMI 1640 (Thermo Fisher Scientific) supplemented with 10% heat-inactivated fetal bovine serum (HyClone) at 37°C in a humidified atmosphere containing 5% carbon dioxide.
Detection of cell viability and apoptosis
BMSCs (1 × 10⁴ cells/well) and MM cell lines (5 × 10³ cells/well) were seeded in 96-well plates and treated with FTY720 (0.1-10 µM; fingolimod, sphingosine 1-phosphate [S1P] receptor modulator; Cayman Chemical) or transfected with miR-10a mimic (0.5-50 nM) for 24 to 48 hours. Cell proliferation was assessed by using WST-8 according to the manufacturer’s recommendations (Cell Counting Kit-8; Dojindo Molecular Technologies, Inc.). Each experiment was repeated 3 times, and the data represent the mean ± standard error of 6 duplicate wells.
Two methods were used to analyze apoptosis induction. Caspase-Glo 3/7 reagent (Promega) was added to the cells after 48 hours, and the luminescence of each sample was determined by using a GloMax Multi microplate reader (Promega) according to the manufacturer’s instructions. Apoptosis was also detected by using the fluorescein isothiocyanate–Annexin V Apoptosis Detection Kit I (BD Bioscience). Details are provided in the supplemental Methods.
Isolation and characterization of EVs
BMSCs (4 × 10⁴ cells/cm2) were cultured in 5 mL of MSCBM (Lonza) in a T-25 flask. The culture supernatants were harvested after 48 hours of incubation, and the EV fraction was purified by using ExoQuick-TC reagent (System Biosciences) according to the manufacturer’s instructions. EVs were quantitated according to nanoparticle tracking analysis (NanoSight LM10; Malvern Panalytical) and observed with a transmission electron microscope (JEM-1200EX; JEOL) (supplemental Methods).
For inhibition of EV secretion, BMSCs (4 × 10⁴ cells/cm2) were cultured in 5 mL of MSCBM with 5 µM of GW4869 (nSMase2 inhibitor; MilliporeSigma), 1 µM of manumycin A (inhibitor of Ras farnesyltransferase; MilliporeSigma), 1 µM of JTE-013 (S1P2 antagonist; Cayman Chemical), or 1 µM of FTY720 (fingolimod, S1P receptor modulator; Cayman Chemical). The culture medium was collected for EV isolation.
miRNA expression profiles
Cellular and EV miRNAs were collected by using an miRNeasy kit (Qiagen), and miRNA profiling of cells and EVs was performed by using a TaqMan low-density miRNA array (Thermo Fisher Scientific) according to the manufacturer’s recommendations. The relative expression level of each miRNA was calculated by using the comparative threshold cycle (Ct) method, as described in the supplemental Methods.
Transfection of miRNA mimics
BMSCs (3 × 10⁴ cells/cm2) or MM cell lines (2 × 10⁵ cells/well) were transfected with 10 nM or 100 nM of individual miRNA mimic (has-miR-10a, has-miR-346, and has-miR-135b; Thermo Fisher Scientific) using HiPerFect (Qiagen). To visualize the transport of EV miRNA derived from MM-BMSCs into MM cells, miR-10a mimic was labeled by using a Label IT siRNA Tracker Cy3 kit (Mirus Bio) according to the manufacturer’s instructions. Details are provided in the supplemental Methods.
Western blotting
Cells were lysed in lysis buffer (Roche), and equal amounts of protein were separated on sodium dodecyl sulfate-polyacrylamide gels. The exosomal pellets isolated from equal volumes of culture medium (5 mL) were lysed in 200 µL of lysis buffer. Equal volumes of lysate (30 µL) were loaded in each lane of the gels. Details regarding antibodies are given in the supplemental Methods.
Fluorescence microscopy
Immunofluorescence analysis was performed by using antibodies against α-smooth muscle antibody (SMA; rabbit polyclonal anti-αSMA; 1:500; C-28; Santa Cruz Biotechnology), CD63 (mouse monoclonal anti-CD63; 1:100; sc-5275; Santa Cruz Biotechnology), and KDEL (mouse monoclonal anti-KDEL; 1:100; ab12223; Abcam). Alexa Fluor 488–conjugated anti-mouse immunoglobulin G goat serum (Molecular Probes, Thermo Fisher Scientific) was used as secondary antibody. Nuclear staining was conducted by using 4′,6-diamidino-2-phenylindole (Abbott Diagnostics). Samples were examined under a fluorescence microscope (Biozero BZ-8000; Keyence).
In vivo evaluation of a novel, porous 3-dimensional scaffold
Hydroxylapatite-based 3-dimensional porous scaffolds (GC Corporation) were immersed in 35 µL of culture medium with BMSCs labeled with NEO-STEM (rhodamine B isothiocyanate [RITC], 0.1 mg/mL; Biterials Co., Ltd.) (5 × 10⁵ cells/scaffold) and RPMI 8226–green fluorescent protein (GFP) (5 × 10⁵ cells per scaffold). Details are provided in the supplemental Methods.
The mice received weekly intraperitoneal injections of 1 mg/kg of FTY720. The specimens were harvested 8 weeks later, frozen in Tissue-Tek OCT (Sakura Finetechnical) compound and sectioned at 8 µm by using a cryostat (Leica). The total GFP+ area (RPMI 8226–GFP) and RITC+ area (NEO-STEM–labeled BMSCs) were quantified as the mean pixel density obtained from image analysis of 6 random microscopic fields by using ImageJ software.
Statistical analyses
Data are expressed as mean ± standard deviation. Differences between 2 treatment groups were analyzed by using Student t tests (2-tailed, unpaired), and differences among multiple groups were analyzed by analysis of variance. All statistical analyses were conducted by using GraphPad Prism version 5c for Macintosh (GraphPad Inc.). Results were considered statistically significant when P < .05.
Results
miR-10a expression levels were increased in EVs derived from MM-BMSCs compared with EVs from normal-BMSCs
MM-BMSCs were isolated from BM samples from 21 patients with MM (aged, 43-82 years) (Table 1); the phenotypic characterization of BMSCs from age-matched healthy donors (normal-BMSCs) and MM-BMSCs are shown in supplemental Figures 1 and 2. The EV fraction was isolated from culture supernatants of normal-BMSCs and MM-BMSCs. The size and number of EVs were similar between normal-BMSCs and MM-BMSCs (Figure 1A). Common markers of EVs (CD63, CD81, and TSG101) were detected in EVs from both normal-BMSCs and MM-BMSCs by using western blotting (Figure 1B).
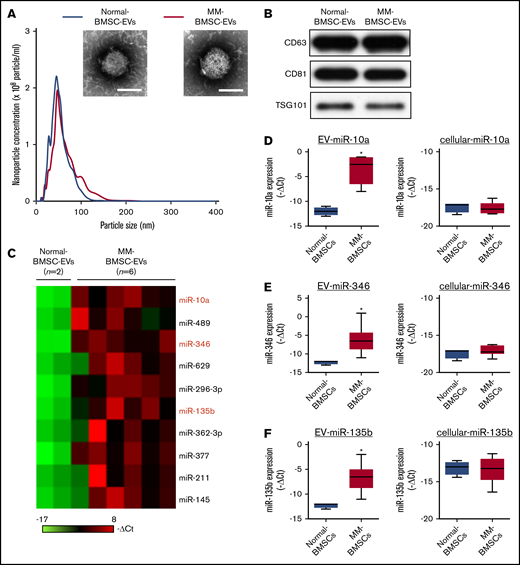
Identification of MM-BMSC–specific EV miRNAs. (A) Representative transmission electron micrographs of EVs derived from normal-BMSCs and MM-BMSCs. Scale bar, 50 nm. Nanoparticle concentrations and size distributions of EVs derived from normal-BMSCs (blue line) and MM-BMSCs (red line). An average of 2.1 × 10⁵ and 2.0 × 10⁵ EVs were recovered from 1 mL of culture supernatant of normal-BMSCs and MM-BMSCs, respectively. (B) Western blotting for CD63, CD81, and TSG101 in EVs derived from BMSCs. (C) Differential miRNA expression levels in normal-BMSC–EVs (n = 2) and MM-BMSC–EVs (n = 6) as a screening cohort. (D-F) EV and cellular miRNA (miR-10a, miR-346, and miR-135b) expression levels in normal-BMSCs (n = 2) and MM-BMSCs (n = 6) by quantitative polymerase chain reaction array. Box plot whiskers represent minimum and maximum values. P values were calculated by using independent-sample Student t tests. *P < .01.
Identification of MM-BMSC–specific EV miRNAs. (A) Representative transmission electron micrographs of EVs derived from normal-BMSCs and MM-BMSCs. Scale bar, 50 nm. Nanoparticle concentrations and size distributions of EVs derived from normal-BMSCs (blue line) and MM-BMSCs (red line). An average of 2.1 × 10⁵ and 2.0 × 10⁵ EVs were recovered from 1 mL of culture supernatant of normal-BMSCs and MM-BMSCs, respectively. (B) Western blotting for CD63, CD81, and TSG101 in EVs derived from BMSCs. (C) Differential miRNA expression levels in normal-BMSC–EVs (n = 2) and MM-BMSC–EVs (n = 6) as a screening cohort. (D-F) EV and cellular miRNA (miR-10a, miR-346, and miR-135b) expression levels in normal-BMSCs (n = 2) and MM-BMSCs (n = 6) by quantitative polymerase chain reaction array. Box plot whiskers represent minimum and maximum values. P values were calculated by using independent-sample Student t tests. *P < .01.
EV miRNA profiles were compared by using a screening cohort of 2 normal-BMSCs and 6 MM-BMSCs selected at random from 21 MM-BMSCs (National Center for Biotechnology Information [NCBI], Gene Expression Omnibus; GSE110271). The 2(-ΔCt) values of EV miRNAs with a fold change >2 between MM-BMSCs and normal-BMSCs were ranked; 10 miRNAs were more highly expressed in MM-BMSC EVs (n = 6) (Figure 1C). We also compared the expression patterns of extracellular (including EVs) and intracellular miRNAs between normal-BMSCs (n = 2) and MM-BMSCs (n = 6) based on the results of TaqMan miRNA arrays (NCBI, Gene Expression Omnibus; GSE110238). The 10 miRNAs upregulated in MM-BMSC EVs were subdivided into type 1 and type 2. Intracellular expression levels of type 1 miRNAs were well correlated for most EV miRNAs; for example, expression levels of both cellular and EV miR-296-3p were higher in MM-BMSCs than in normal-BMSCs (P < .01) (supplemental Figure 3). In contrast, the type 2 subset of miRNAs showed higher expression in EVs derived from MM-BMSCs compared with EVs from normal-BMSCs, but expression levels of intracellular miRNAs, such as miR-10a, miR-346, and miR-135b, were low or absent in both MM-BMSCs and normal-BMSCs (P < .01) (Figure 1D-F). We determined the expression levels of EV miR-10a, miR-346, and miR-135b in MM-BMSCs as a validation cohort (n = 21) by using quantitative reverse transcription-polymerase chain reaction and found showed that these EV miRNAs were expressed more highly in MM-BMSCs compared with normal-BMSCs (P < .001) (supplemental Figure 4A). In contrast, there was no significant difference in the expression levels of cellular miR-10a, miR-346, or miR-135b between normal-BMSCs and MM-BMSCs (supplemental Figure 4B).
EV release inhibitors induced the accumulation of intracellular miR-10a in MM-BMSCs
We determined if blocking the secretion of EVs affected the expression of cellular miR-10a in MM-BMSCs. EV release was determined by measuring levels of the EV-associated proteins CD63, CD81, and TSG101 (Figure 2A) and quantification of total protein (supplemental Table 1). EV markers decreased in both normal-BMSCs and MM-BMSCs 48 hours after treatment with 4 types of EV biogenesis/release inhibitors: GW4869 (neutral sphingomyelinase inhibitor), manumycin A (Ras farnesyltransferase inhibitor), FTY720 (S1P receptor agonist), and JTE-013 (S1P2 receptor antagonist).

EV release inhibitors GW4869, manumycin A, FTY720, and JTE-013 induced accumulation of intracellular miRNAs in MM-BMSCs. (A) Western blot analysis of EV markers CD63, CD81, and TSG101 verified that the inhibitors reduced EV release. (B) TaqMan low-density miRNA array analysis of cellular miRNA expression (miR-10a, miR-346, and miR-135b) in normal-BMSCs (n = 2) and MM-BMSCs (n = 6) treated with EV release inhibitors. *P < .01 vs control without EV release inhibitors. (C) Immunofluorescence staining of CD63 (green) in normal-BMSCs and MM-BMSCs to visualize the accumulation of EVs after treatment with FTY720. KDEL (red) and 4′,6-diamidino-2-phenylindole (DAPI; blue) were used as cytoplasmic and nuclear counterstains, respectively. Scale bars, 50 nm.
EV release inhibitors GW4869, manumycin A, FTY720, and JTE-013 induced accumulation of intracellular miRNAs in MM-BMSCs. (A) Western blot analysis of EV markers CD63, CD81, and TSG101 verified that the inhibitors reduced EV release. (B) TaqMan low-density miRNA array analysis of cellular miRNA expression (miR-10a, miR-346, and miR-135b) in normal-BMSCs (n = 2) and MM-BMSCs (n = 6) treated with EV release inhibitors. *P < .01 vs control without EV release inhibitors. (C) Immunofluorescence staining of CD63 (green) in normal-BMSCs and MM-BMSCs to visualize the accumulation of EVs after treatment with FTY720. KDEL (red) and 4′,6-diamidino-2-phenylindole (DAPI; blue) were used as cytoplasmic and nuclear counterstains, respectively. Scale bars, 50 nm.
EV release inhibitors also upregulated intracellular expression levels of miR-10a, miR-346, and miR-135b in MM-BMSCs, which exhibited little or no expression of these miRNAs without EV release inhibition (n = 6) (P < .01) (Figure 2B). Conversely, no such upregulation of intracellular miR-10a, miR-346, and miR-135b expression was detected in normal-BMSCs.
FTY720 resulted in greater intracellular accumulation of these miRNAs than other EV-release inhibitors, including manumycin A and JTE-013. To confirm the inhibition of EV release by FTY720, we treated normal-BMSCs and MM-BMSCs with 1 µM of FTY720 and observed the accumulation of CD63+ microvesicles in the cytoplasm of these BMSCs after 48 hours (Figure 2C). Cellular miR-10a, miR-346, and miR-135b in MM-BMSCs accumulated in a dose- and time-dependent manner after FYT720 exposure (supplemental Figure 5A-B). Subsequent EV inhibition experiments were therefore performed by using FTY720.
EV release inhibitor inhibited cell proliferation and induced apoptosis in MM-BMSCs
FTY720 reduced the viability of MM-BMSCs (n = 21) but not normal-BMSCs (P = .0008) (Figure 3A) in a dose- and time-dependent manner (supplemental Figure 5C-D). We examined the effect of FTY720 on apoptosis in MM-BMSCs by measuring effector caspase activity. Caspase-3/7 expression levels increased significantly in MM-BMSCs treated with 1 µM of FTY720 compared with untreated cells (P < .01) (Figure 3B), whereas no similar effect was observed in normal-BMSCs. No significant increase in apoptosis was detected at 24 hours after treatment with 1 µM of FTY720 (supplemental Figure 6), as shown by Annexin V–fluorescein isothiocyanate/propidium iodide flow cytometry; there was an increase, however, in early apoptosis (from 12.5% to 59.6%) after 48 hours in MM-BMSCs but not in normal-BMSCs (Figure 3C). Furthermore, we performed similar experiments using drugs that control exosome release by a different mechanism of action than FTY720. As a result, MM-BMSCs treated with GW4869 were able to confirm the induction of apoptosis, similar to FTY720 treatment (supplemental Figure 7).
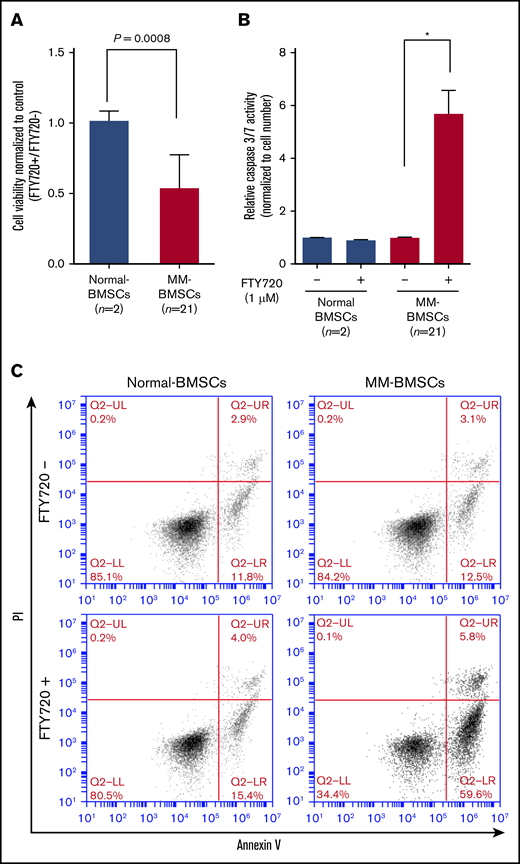
FTY720 inhibited proliferation and induced apoptosis in MM-BMSCs. Normal-BMSCs (n = 2) and MM-BMSCs (n = 21) were cultured with or without FTY720 (1 µM). (A) Cell viability after 48 hours. Values represent proliferation rate normalized by control (FTY720+/FTY720–) ± standard deviation. (B) Caspase-3/7 activity measured after 48 hours. Data represent fold increase compared with control (without FTY720) ± standard deviation. (C) Rates of apoptosis in normal-BMSCs and MM-BMSCs treated with 1 µM of FTY720 for 48 hours, determined by Annexin V and propidium iodide (PI) staining and flow cytometry. *P < .01 vs control (without FTY720).
FTY720 inhibited proliferation and induced apoptosis in MM-BMSCs. Normal-BMSCs (n = 2) and MM-BMSCs (n = 21) were cultured with or without FTY720 (1 µM). (A) Cell viability after 48 hours. Values represent proliferation rate normalized by control (FTY720+/FTY720–) ± standard deviation. (B) Caspase-3/7 activity measured after 48 hours. Data represent fold increase compared with control (without FTY720) ± standard deviation. (C) Rates of apoptosis in normal-BMSCs and MM-BMSCs treated with 1 µM of FTY720 for 48 hours, determined by Annexin V and propidium iodide (PI) staining and flow cytometry. *P < .01 vs control (without FTY720).
Overexpression of miR-10a inhibited cell proliferation and induced apoptosis in MM-BMSCs
To verify if EV miRNAs played a major role in inducing apoptosis in MM-BMSCs, we transfected normal-BMSCs (n = 2) and MM-BMSCs (n = 21) with 10 nM miR-10a, miR-346, and miR-135b mimics (Figure 4A-C). Similar to the results after inhibition of EVs using FTY720 (Figure 3A), overexpression of miR-10a mimic inhibited the viability of MM-BMSCs compared with normal-BMSCs (P = .0214) (Figure 4D); their viability was unaffected by miR-346 and miR-135b overexpression, however (Figure 4E-F).

Overexpression of miR-10a inhibited cell proliferation and induced apoptosis in MM-BMSCs. Expression levels of miR-10a (A), miR-346 (B), and miR-135b (C) in BMSCs after transfection with the respective mimics, measured by using quantitative reverse transcription-polymerase chain reaction. Data represent fold increase compared with control (Nega-miR) ± standard deviation. Cell viability 72 hours after transfection with miR-10a (D), miR-346 (E), and miR-135b (F) mimics. Values represent proliferation rates normalized by control (with Nega-miR) ± standard deviation. (G) Caspase-3/7 activity in normal-BMSCs and MM-BMSCs transfected with 10 nM of miR-10a mimic for 72 hours. Data represent fold increases compared with control (with Nega-miR) ± standard deviation. *P < .01 vs control (with Nega-miR). (H) Time course of apoptosis induced by miR-10a transfection in MM-BMSCs determined by Annexin V and PI staining and flow cytometry.
Overexpression of miR-10a inhibited cell proliferation and induced apoptosis in MM-BMSCs. Expression levels of miR-10a (A), miR-346 (B), and miR-135b (C) in BMSCs after transfection with the respective mimics, measured by using quantitative reverse transcription-polymerase chain reaction. Data represent fold increase compared with control (Nega-miR) ± standard deviation. Cell viability 72 hours after transfection with miR-10a (D), miR-346 (E), and miR-135b (F) mimics. Values represent proliferation rates normalized by control (with Nega-miR) ± standard deviation. (G) Caspase-3/7 activity in normal-BMSCs and MM-BMSCs transfected with 10 nM of miR-10a mimic for 72 hours. Data represent fold increases compared with control (with Nega-miR) ± standard deviation. *P < .01 vs control (with Nega-miR). (H) Time course of apoptosis induced by miR-10a transfection in MM-BMSCs determined by Annexin V and PI staining and flow cytometry.
Furthermore, caspase-3/7 expression was increased in MM-BMSCs overexpressing miR-10a (P < .01) but not in normal-BMSCs compared with the negative control (Figure 4G). Both early apoptosis (13.5% and 21.4%, respectively) and late apoptosis (21.2% and 34.6%) were increased at 48 and 72 hours in MM-BMSCs overexpressing miR-10a mimic compared with cells overexpressing a negative control miRNA (Nega-miR) (Figure 4H). Similar to the results for caspase-3/7, apoptosis of normal-BMSCs was unaffected by miR-10a overexpression at both 24 and 72 hours (supplemental Figure 8).
We performed additional experiments to obtain direct evidence of apoptosis induction by FTY720 inhibition of EV release and accumulation of miR-10a in the BMSCs. Induction of apoptosis in MM-BMSCs treated with FTY720 was blocked by transfection of anti–miR-10a inhibitor (supplemental Figure 9).
EV-mediated transfer of miR-10a promoted proliferation of MM cells
To clarify the role of EV-mediated miR-10a secreted from MM-BMSCs in the BMME, the EV fraction extracted from conditioned medium from MM-BMSCs (n = 21) was added to RPMI 8226 MM cells. The EV fraction enhanced the proliferation of RPMI 8226 cells compared with adding the EV fraction from normal-BMSCs (P < .05) (Figure 5A). The enhanced MM cell proliferation induced by the MM-BMSC EV fraction was canceled by FTY720 treatment of the MM-BMSCs (P < .01). We also visualized the uptake of Cy3-labeled miR-10a via EVs into MM cells, and noted dots indicating Cy3–miR-10a in the cytoplasm of RPMI 8226, KMS-11, and U266 cells (Figure 5B; supplemental Figure 10A).
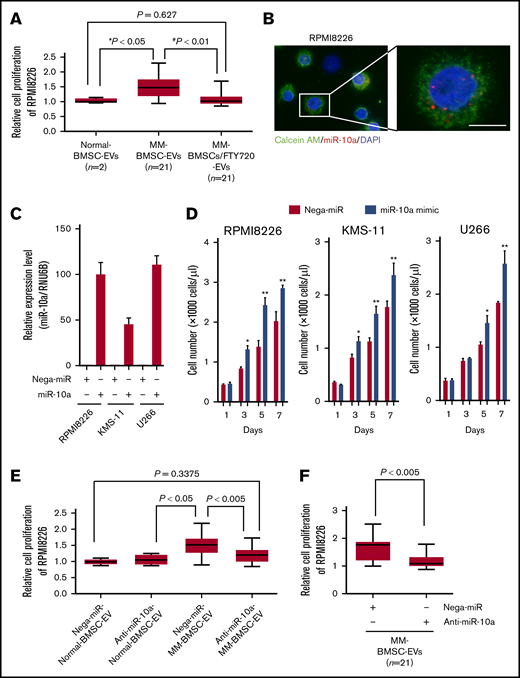
EV miR-10a derived from MM-BMSCs transferred to MM cells and enhanced MM cell proliferation. (A) Viabilities of RPMI 8226 cells cultured with EV fractions isolated from conditioned medium of normal-BMSCs (normal-BMSC–EVs, n = 2), MM-BMSCs (MM-BMSC–EVs, n = 21), or MM-BMSCs treated with 1 µM of FTY720 (MM-BMSC/FTY720–EVs, n = 21) for 48 hours. Data represent fold increases compared with normal-BMSC–EVs ± standard deviation. *Normal-BMSC–EVs vs MM-BMSC–EVs, P < .05. #MM-BMSC–EVs vs MM-BMSC/FTY720–EVs, P < .01. (B) RPMI 8226 cells treated with EVs directly transfected with Cy3–miR-10a mimic for 48 hours. Nuclear and cytoplasmic staining with DAPI (blue) and calcein AM (green), respectively. Scale bar, 20 µm. (C) Expression levels of miR-10a in RPMI 8226, KMS-11, and U266 MM cells transfected with negative control-miR or miR-10a mimic for 48 hours, measured by using quantitative reverse transcription-polymerase chain reaction. Data represent fold increases compared with control (Nega-miR) ± standard deviation. (D) Numbers of MM cells transfected with miR-10a mimic on days 1, 3, 5, and 7 according to flow cytometry. Data are mean concentrations of viable cells ± standard deviation determined in 3 separate experiments. *P < .01, **P < .001 vs control (with Nega-miR). (E) Viabilities of RPMI 8226 cells cultured with EV fractions isolated from conditioned medium of normal-BMSCs (normal-BMSC–EVs, n = 2) or MM-BMSCs (MM-BMSC–EVs, n = 21) transfected with 10 nM of negative control-miR (Nega-miR) or 10 nM anti–miR-10a inhibitor for 48 hours. Data represent fold increases compared with Nega-miR–transfected normal-BMSC–EVs ± standard deviation. (F) Viabilities of RPMI 8226 cells treated with EVs directly transfected with anti–miR-10a inhibitor for 48 hours. Data represent fold increases compared with anti–miR-10a inhibitor-transfected EVs of MM-BMSCs ± standard deviation.
EV miR-10a derived from MM-BMSCs transferred to MM cells and enhanced MM cell proliferation. (A) Viabilities of RPMI 8226 cells cultured with EV fractions isolated from conditioned medium of normal-BMSCs (normal-BMSC–EVs, n = 2), MM-BMSCs (MM-BMSC–EVs, n = 21), or MM-BMSCs treated with 1 µM of FTY720 (MM-BMSC/FTY720–EVs, n = 21) for 48 hours. Data represent fold increases compared with normal-BMSC–EVs ± standard deviation. *Normal-BMSC–EVs vs MM-BMSC–EVs, P < .05. #MM-BMSC–EVs vs MM-BMSC/FTY720–EVs, P < .01. (B) RPMI 8226 cells treated with EVs directly transfected with Cy3–miR-10a mimic for 48 hours. Nuclear and cytoplasmic staining with DAPI (blue) and calcein AM (green), respectively. Scale bar, 20 µm. (C) Expression levels of miR-10a in RPMI 8226, KMS-11, and U266 MM cells transfected with negative control-miR or miR-10a mimic for 48 hours, measured by using quantitative reverse transcription-polymerase chain reaction. Data represent fold increases compared with control (Nega-miR) ± standard deviation. (D) Numbers of MM cells transfected with miR-10a mimic on days 1, 3, 5, and 7 according to flow cytometry. Data are mean concentrations of viable cells ± standard deviation determined in 3 separate experiments. *P < .01, **P < .001 vs control (with Nega-miR). (E) Viabilities of RPMI 8226 cells cultured with EV fractions isolated from conditioned medium of normal-BMSCs (normal-BMSC–EVs, n = 2) or MM-BMSCs (MM-BMSC–EVs, n = 21) transfected with 10 nM of negative control-miR (Nega-miR) or 10 nM anti–miR-10a inhibitor for 48 hours. Data represent fold increases compared with Nega-miR–transfected normal-BMSC–EVs ± standard deviation. (F) Viabilities of RPMI 8226 cells treated with EVs directly transfected with anti–miR-10a inhibitor for 48 hours. Data represent fold increases compared with anti–miR-10a inhibitor-transfected EVs of MM-BMSCs ± standard deviation.
To identify the function of EV-transferred miR-10a in MM cells, 3 MM cell lines were transfected with miR-10a mimic (Figure 5C). We found that the proliferation rates of RPMI 8226, KMS-11, and U266 cells were significantly enhanced at 3 to 7 days after miR-10a overexpression compared with cells overexpressing Nega-miR (P < .01 and P < .001) (Figure 5D).
Additional experiments were conducted to clarify whether miR-10a contained in EVs has an important role in MM cell proliferation. First, EVs were collected from the conditioned medium of MM-BMSCs transfected with anti–miR-10a inhibitor. Addition of EVs to RPMI 8226 did not induce their proliferation (Figure 5E), suggesting that miR-10a derived from MM-BMSCs was involved in the regulation of MM cell proliferation via EVs. Second, we examined the involvement of FTY720 pro-apoptotic activity and miR-10a induction in MM cells. The increase in cellular miR-10a expression, as observed in MM-BMSCs, was not confirmed in MM cells treated with FTY720 because MM cells and their EVs originally had low miR-10a expression (supplemental Figure 10B). We further performed knockdown experiments for EV–miR-10a. EVs derived from MM-BMSCs were collected, and anti–miR-10a inhibitor was then directly transfected into MM-BMSC–EVs by using the Exo-fect Exosome Transfection Kit (System Biosciences). Knockdown of miR-10a in EVs derived from MM-BMSCs abolished the induction of MM cell proliferation (Figure 5F).
Target pathways of miR-10a differ between MM-BMSCs and MM cells
We explored the mechanism by which the accumulation of intracellular miR-10a induced apoptosis in MM-BMSCs (Figure 5D,G-H) and affected MM cell proliferation (Figure 6D) by examining the global gene expression profiles (NCBI, Gene Expression Omnibus; GSE108915 and GSE118282) of miR-10a–overexpressing MM-BMSCs and MM cell lines (RPMI 8226, KMS-11, and U266). A total of 228 genes were commonly downregulated by miR-10a overexpression in MM-BMSCs. These downregulated genes included predicted target genes and experimentally validated targets of miR-10a presented in miRTarBase (release 7.0: http://mirtarbase.mbc.nctu.edu.tw/php/index.php) and TargetScan (Release 7.2: http://www.targetscan.org), including phosphatase and tensin homolog (PTEN), annexin A7 (ANXA7), cyclin-dependent kinase 6 (CDK6), and transferrin receptor protein 1 (TFRC). The gene expression profiles for 3 MM cell lines revealed that 50 genes, including CCR3, XCL1, SMAD4, and PRKX, were downregulated by miR-10a overexpression. Functional annotation analysis using the Database for Annotation, Visualization and Integrated Discovery (DAVID) tool identified the most-affected biological pathways of the genes downregulated by overexpression of miR-10a, including cell proliferation and regulation of the apoptotic process (supplemental Tables 2 and 3). Overall, these results suggest that miR-10a has 2 functions involving growth inhibition of MM-BMSCs and tumor progression in MM cells, reflecting the different targeting mechanisms in MM-BMSCs and MM cells.
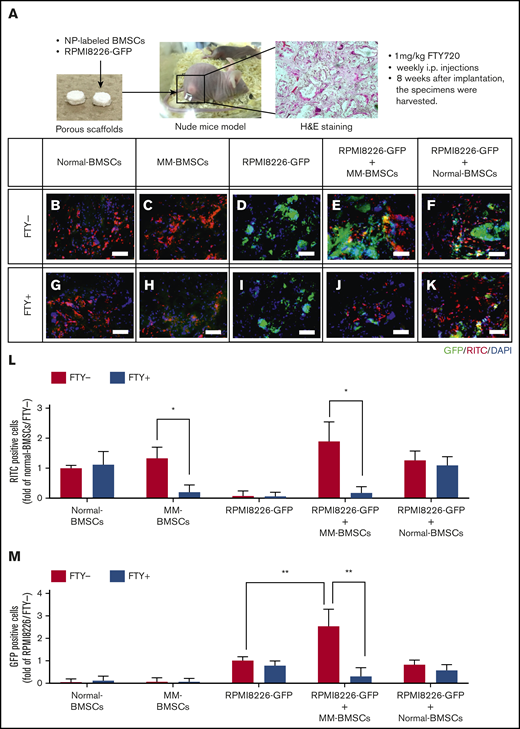
FTY720 indirectly and directly inhibited the proliferation of MM cells in vivo. (A) Schematic of in vivo 3-dimensional coculture model. Scale bars, 1 µm. (B-K) Fluorescence microscopic examination of RITC+ cells (nanoparticle-labeled BMSCs; red) and GFP+ cells (RPMI 8226-GFP; green) 8 weeks after implantation of scaffolds impregnated with normal-BMSCs (B,G), MM-BMSCs (C,H), RPMI 8226–GFP (D,I), RPMI 8226–GFP+ MM-BMSCs (E,J), and RPMI 8226–GFP+ normal-BMSCs (F,K). Nuclear counterstaining was performed by using DAPI (blue). Scale bars, 200 µm. (L) Quantitative data for RITC+ cells in the scaffold determined according to pixel density. *P < .01 (Student t test). Values are mean ± standard deviation. (M) Quantitative data for GFP+ cells in the scaffold determined according to pixel density. **P < .001 (Student t test). Values are mean ± standard deviation. FTY+, mice treated with 1 mg/kg of FTY720; FTY−, mice without FTY720; H&E, hematoxylin and eosin.
FTY720 indirectly and directly inhibited the proliferation of MM cells in vivo. (A) Schematic of in vivo 3-dimensional coculture model. Scale bars, 1 µm. (B-K) Fluorescence microscopic examination of RITC+ cells (nanoparticle-labeled BMSCs; red) and GFP+ cells (RPMI 8226-GFP; green) 8 weeks after implantation of scaffolds impregnated with normal-BMSCs (B,G), MM-BMSCs (C,H), RPMI 8226–GFP (D,I), RPMI 8226–GFP+ MM-BMSCs (E,J), and RPMI 8226–GFP+ normal-BMSCs (F,K). Nuclear counterstaining was performed by using DAPI (blue). Scale bars, 200 µm. (L) Quantitative data for RITC+ cells in the scaffold determined according to pixel density. *P < .01 (Student t test). Values are mean ± standard deviation. (M) Quantitative data for GFP+ cells in the scaffold determined according to pixel density. **P < .001 (Student t test). Values are mean ± standard deviation. FTY+, mice treated with 1 mg/kg of FTY720; FTY−, mice without FTY720; H&E, hematoxylin and eosin.
FTY720 indirectly and directly inhibited the proliferation of MM cells in vivo
To investigate the potential therapeutic targeting value of EV secretion by MM-BMSCs, we used an in vivo 3-dimensional coculture model to reproduce the BMME in patients with MM. Although this model could not exclude the effect of direct interactions between MM cells and BMSCs, it was nevertheless useful for evaluating the effects of FTY720 administration. We subcutaneously implanted a porous scaffold loaded with RPMI 8226–GFP MM cells with or without fluorescent silica nanoparticle-labeled BMSCs into nude mice (Figure 6A). The number of normal-BMSCs was unaffected by FTY720 administration at 3 weeks after implantation (Figure 6B,G-H,L), whereas FTY720 reduced the number of MM-BMSCs in the scaffolds (Figure 6C,H,L). Furthermore, the proliferation of RPMI 8226–GFP cells in the scaffolds was enhanced by coexistence with MM-BMSCs, and this enhanced proliferation was cancelled by FTY720 (Figure 6D-E,M). In contrast, there was no significant increase in RPMI 8226–GFP cells in scaffolds with normal-BMSCs (Figure 6F,K,M). Notably, FTY720 inhibited the MM-BMSC–induced proliferation of RPMI 8226–GFP tumor cells (Figure 6J,M) but had little effect on the proliferation of RPMI 8226 cells themselves (Figure 6I,M). We performed a further experiment using MM-derived cell lines other than RPMI 8226 (KMS-11 and U266) and primary CD138+ myeloma cells. Similar to the experiment using RPMI 8226 cells, we determined that FTY720 influences the antitumor effect by causing a decrease in the number of MM-BMSCs (supplemental Figure 11).
Discussion
Specific miRNAs are enriched in EVs in a cell type–dependent fashion.18,29 However, the mechanisms by which miRNAs are sorted into EVs and the significance of miRNA transfer to recipient cells remain largely unclear. miRNAs can be sorted into EVs by various process mechanisms. Previous reports showed that a subset of miRNAs is loaded into EVs by a selective mechanism involving RNA-binding proteins, including AGO2 and Y-box protein 1.29,30 Santangelo et al31 showed that RNA-binding proteins cooperate with each other during miRNA sorting into EVs via specific binding to a common extra-seed sequence, called the “EXO motif.” The current study identified a subset of miRNAs including miR-10a that was selectively increased in EVs derived from MM-BMSCs, and overexpression of miR-10a mimic inhibited the viability of MM-BMSCs. We have not yet fully elucidated the mechanism by which miR-10a is sorted into MM-BMSC–EVs, but our results suggest that low expression of cellular miR-10a might be important for survival of MM-BMSCs.
We showed that miR-10a, which negatively affects the survival of MM-BMSCs, is secreted by EVs and transported into MM cells, promoting their proliferation. miR-10a–enriched EVs might thus contribute to the function of MM-BMSCs to create a permissive microenvironment for MM cell proliferation and survival. Notably, EV–miR-10a released by MM-BMSCs regulated MM cell proliferation. A single miRNA can coordinate multiple pathways involving the regulation of multiple genes, and the status of miR-10a in tumor progression remains controversial. Upregulation of miR-10a has been found in several different tumor types, and it has been shown to enhance migration, invasion, and growth in solid tumors, including pancreatic cancer,32 lung cancer,33 and thyroid carcinoma,34 via suppression of HOXA132 and PTEN.33 Similarly, Ovcharenko et al35 and Bryant et al36 reported that aberrant miR-10a overexpression was associated with NPM1 mutation and MDM4 downregulation in intermediate-risk acute myeloid leukemia. In contrast to the pro-oncogenic function of miR-10a in acute myeloid leukemia, negative regulation of the proto-oncogene BCL6 by miR-10a suppressed proliferation and promoted apoptosis of diffuse large B-cell lymphoma cells.37 Together, these results show that miR-10a expression can fine-tune the control of cell proliferation and apoptosis depending on the type of cancer.
The role of miR-10a in MM growth has not yet been reported, however. The current study therefore examined the global messenger RNA expression profiles of miR-10a–transfected MM cell lines, raising the possibility that miR-10a can target various suppressors of MM progression. Our findings indicate that miR-10a might act as an “onco-miR” in MM. We also searched miRTarBase and TargetScan for direct target genes of miR-10a in MM cells. From the search results, we extracted 4 candidate genes, including TAK1. The expression of candidate miR-10a target factors in MM cells overexpressing miR-10a was analyzed by using western blotting. Of the 4 factors analyzed, SF2 and TRA2B expression was not significantly different, but interestingly, TAK1 and βTRC expression was elevated by miR-10a overexpression. Although not affected by the TAK1 inhibitor, treatment with the βTRC inhibitor canceled the promotion of cell proliferation by miR-10a overexpression in MM cells (supplemental Figure 12A).
In contrast, overexpression of miR-10a promoted apoptosis of MM-BMSCs. We therefore also analyzed the gene expression profiles of miR-10a–transfected BMSCs to explore miR-10a–related pathways in MM-BMSCs. The genes that were downregulated in miR-10a–overexpressing MM-BMSCs, including PTEN, ANXA7, and CDK6, are all known regulators of the cell cycle and apoptosis. In contrast, cell death was not induced by miR-10a overexpression in normal-BMSCs. We then searched for direct target genes of miR-10a in MM-BMSCs by using TargetScan. Among the genes whose expression was decreased in MM-BMSCs by miR-10a overexpression, we extracted candidate genes with conserved miR-10a–binding sites. Furthermore, we found that ST6GALNAC1 was specifically expressed in MM-BMSCs compared with normal-BMSCs among the candidate genes. ST6GALNAC1 is a critical regulator of cell–cell interactions with the extracellular matrix and the function of intracellular molecules. In addition, apoptosis induction by overexpression of miR-10a in MM-BMSCs was attenuated by knockdown of ST6GALNAC1 by small interfering RNA (supplemental Figure 12B).
MM-BMSCs were treated with 4 different EV secretion inhibitors in the current study. GW4869 is the most widely used pharmacological agent for blocking exosome generation,19,38 and it inhibits the ceramide-mediated inward budding of multivesicular bodies and release of mature exosomes from multivesicular bodies. FTY720 (fingolimod) is an S1P modulator, and FTY720 treatment inhibits S1P signaling on multivesicular endosomes, which in turn blocks exosomal multivesicular endosome maturation.39 The EV release inhibitory effect of FTY720 was higher than that of the other inhibitors in the current study, and the resulting EV release inhibition had the dual effect of inducing apoptosis in MM-BMSCs and inhibiting the support of tumor growth by MM-BMSCs.
Furthermore, FTY720 directly inhibited the proliferation of RPMI 8226 MM cells. FTY720 is currently approved by the US Food and Drug Administration and the European Medicines Agency for the treatment of multiple sclerosis and has also been shown to induce apoptosis in various neoplastic cells, including solid tumors,40 acute lymphoblastic leukemia,41 and chronic myelogenous leukemia.42 FTY720 was also shown to inhibit MM cell proliferation by inducing mitochondria-associated apoptosis.43 Overall, these results suggest that FTY720 might be a candidate anti-MM agent able to exert synergistic effects by targeting MM cells directly and via the BM milieu.
This study had some limitations per the small cohort of samples used. We were unable to determine why BMSCs derived from patients with MM differed from those from healthy donors. It also remains unknown if the transformation of MM-BMSCs observed in this study is unique to MM or is similar among other hematopoietic malignancies. However, our results indicated that inhibition of EV release from MM-BMSCs had potentially novel anti-MM activity. To the best of our knowledge, this study is the first to investigate direct BMSC-targeting strategies in “soil”-targeted therapy. Although the precise mechanisms underlying the loading of specific miRNAs, such as miR-10a, into EVs require further clarification, the current results provide a preclinical rationale for the therapeutic application of FTY720 in MM and shed light on a possible role for EV release inhibitors in targeting MM tumor load in the BMME.
Acknowledgments
The authors thank Susan Furness and H. Nikki March, from Edanz Group (www.edanzediting.com/ac), for editing a draft of the manuscript.
This study was supported in part by the Private University Strategic Research–Based Support Project (S1511011) and in part by a grant-in-aid (16K07183 and 18K07244) from the Ministry of Education, Culture, Sports, Science, and Technology and the Takeda Science Foundation.
Authorship
Contribution: T.U., K.O., and J.H.O. designed the research and wrote the article; T.U., S.I., and C.K. performed the research and analyzed data; and S.Y. provided patient samples.
Conflict-of-interest disclosure: K.O. received research support from Celgene KK, Chugai Pharmaceutical KK, and Janssen Pharma KK. The remaining authors declare no competing financial interests.
The current affiliation for T.U. is the Department of Molecular Pathology, Tokyo Medical University, Tokyo, Japan.
Correspondence: Tomohiro Umezu, Tokyo Medical University, 6-7-1 Nishi-shinjuku, Shinjuku, Tokyo 160-0023, Japan; e-mail: t_umezu@tokyo-med.ac.jp.

