

Key Points
MEK inhibition rescues T cells from activation-induced cell death in an AML model.
MEK inhibitor sensitivity is associated with inflammation pathways and PD-L1 expression.

Abstract
Acute myeloid leukemia (AML) remains difficult to treat due to mutational heterogeneity and the development of resistance to therapy. Targeted agents, such as MEK inhibitors, may be incorporated into treatment; however, the impact of MEK inhibitors on the immune microenvironment in AML is not well understood. A greater understanding of the implications of MEK inhibition on immune responses may lead to a greater understanding of immune evasion and more rational combinations with immunotherapies. This study describes the impact of trametinib on both T cells and AML blast cells by using an immunosuppressive mouse model of AML and primary patient samples. We also used a large AML database of functional drug screens to understand characteristics of trametinib-sensitive samples. In the mouse model, trametinib increased T-cell viability and restored T-cell proliferation. Importantly, we report greater proliferation in the CD8+CD44+ effector subpopulation and impaired activation of CD8+CD62L+ naive cells. Transcriptome analysis revealed that trametinib-sensitive samples have an inflammatory gene expression profile, and we also observed increased programmed cell death ligand 1 (PD-L1) expression on trametinib-sensitive samples. Finally, we found that trametinib consistently reduced PD-L1 and PD-L2 expression in a dose-dependent manner on the myeloid population. Altogether, our data present greater insight into the impact of trametinib on the immune microenvironment and characteristics of trametinib-sensitive patient samples.
Introduction
Significant heterogeneity in genetic mutations complicates the progression and treatment of acute myeloid leukemia (AML).1,2 Despite many advances in therapy, 5-year overall survival rates persist at just over 25%.3 An increasing number of targeted inhibitors are available for specific genetic mutations,4,5 but the success of such inhibitors is complicated by patients’ mutational heterogeneity and the development of resistance to treatment.6 The significant advances in immunotherapies in solid tumors have led to growing interest in using immunotherapies to improve outcomes in AML.7,-9 Few immunotherapies have been approved for AML, but several are in phases of development and clinical testing.7 Many of the ongoing trials are investigating the use of immune checkpoint inhibitors in combination with other therapies such as azacitidine and decitabine.7,10,11 As the use of targeted therapies and immunotherapies increases, rational combinations need to be designed to overcome the challenges of developing resistance and to generate more durable treatment responses. However, many targeted agents act on pathways that are crucial to the function of immune cells. Less is known about how these targeted agents may influence the beneficial effects of immunotherapies.
Trametinib, an MEK inhibitor, acts on a key signaling intermediate in the MAPK pathway. Trametinib is approved for melanoma bearing BRAF V600E or V600K mutations.12,13 The MAPK pathway is also known to be an important signaling pathway downstream of the T-cell receptor.14,15 Trametinib has been shown to have direct effects on T-cell function and seems to impair T-cell function at certain doses, but this impairment has been shown to be overcome by the addition of interleukin-15.16 In addition, MEK inhibition reportedly regulates the immune microenvironment in tumors by controlling suppressive myeloid populations, suggesting that MEK inhibitors target multiple cell types in the tumor microenvironment in addition to having direct effects on tumor cells. MEK inhibitors have also been used in combination with programmed cell death protein 1 (PD-1)/programmed cell death ligand 1 (PD-L1) blockade in preclinical studies of colon carcinoma, triple-negative breast cancer, and head and neck squamous cell carcinoma; these studies did not reveal a suppressed T cell–mediated cytotoxic response.17,,-20
MEK inhibitors have previously been shown to have activity in AML.21,,,-25 Although targeting MEK, which is downstream of activating RAS mutations seen in a population of patients with AML, may be beneficial as a treatment modality, there is concern about potential immune effects because the MAPK pathway is also downstream of the T-cell receptor. We therefore studied the impact of trametinib by using an immunosuppressive spontaneous murine model of AML and primary AML patient samples. We found that trametinib can overcome immune suppression of T-cell proliferation at low doses. As shown with previous murine studies in colon carcinoma, trametinib can support expansion of previously activated T cells yet inhibit naive T-cell activation.17 We observed that trametinib-sensitive patient samples have an inflammatory microenvironment at the level of transcriptional network analysis, and specifically, we found higher CD274 (PD-L1 protein) gene expression in trametinib-sensitive samples. Finally, trametinib was shown to affect AML blasts by reducing PD-L1 and PD-L2 expression in both mice and patient samples.
Methods
AML murine model
Animals used in this study spontaneously develop a myeloid leukemia. Mice expressing FLT3-ITD under the endogenous FLT3 promotor26 (strain B6.129-Flt3tm1Dgg/J, The Jackson Laboratory stock no. 011112) were crossed to mice with the Tet2 gene flanked by LoxP sites27 (strain B6;129S-Tet2tm1.1Iaai/J, The Jackson Laboratory stock no. 017573). The FLT3-ITD/Tet2 flox mice were crossed to mice expressing CRE recombinase under control of an LysM promotor (strain B6.129P2-Lyz2tm1(cre)Ifo/J, The Jackson Laboratory stock no. 004781). All breeding animals were purchased from The Jackson Laboratory. All mice used in these experiments were maintained as heterozygous for all 3 transgenes. These mice are similar to those previously reported by Shih et al28 with substitution of LysM CRE for Vav CRE targeting the loss of Tet2 to the myeloid linage, resulting in a Tet2-sufficient lymphoid component. All mouse experiments were performed in accordance with Institutional Animal Care and Use Committee protocol IP00000907.
In vitro murine proliferation assays
Splenocytes were treated with ammonium chloride potassium buffer to lyse red blood cells. Mononuclear cells were then washed and incubated for 15 minutes at 37°C with CellTrace carboxyfluorescein diacetate succinimidyl ester (CFSE; Thermo Fisher Scientific). Mononuclear cells were washed and suspended in RPMI 1640 medium with 10% fetal bovine serum, 1% penicillin streptomycin, and 0.1% beta-mercaptoethanol. Cells were plated at 0.5 × 10⁶ cells per well in a 96-well plate with plate-bound anti-CD3 at 2.5 μg/mL (BioLegend) to induce CD3+ cell proliferation. The mononuclear cells were plated with and without a combination of anti–PD-1 at 10 μg/mL (Bio X Cell) and trametinib 10 nM or 100 nM (Selleck Chemicals). Stimulation with or without both anti-CD3 at 2.5 μg/mL and anti-CD28 at 20 μg/mL (BioLegend) were included as positive and negative controls for T-cell activation. Plates were incubated at 37°C, 5% carbon dioxide for 3 days before analysis via flow cytometry.
Primary patient samples
Peripheral blood and bone marrow samples were collected from patients with AML at the time of initial diagnosis; peripheral blood samples were also collected from healthy donors. Mononuclear cells were isolated by centrifugation with Ficoll-Paque PREMIUM density gradient media (GE Healthcare). All participants provided informed consent to participate in the study, which was approved by the Institutional Review Board at Oregon Health & Science University (electronic Institutional Review Board no. 4422).
In vitro primary patient sample proliferation assays
Mononuclear cells were washed and incubated at 37°C for 20 minutes with CellTrace Violet (Thermo Fisher Scientific). Cells were suspended in RPMI medium supplemented with 20% fetal bovine serum, 1% penicillin streptomycin, and stem cell factor at 100 ng/mL (BioLegend). Cells were plated at 0.2 × 10⁶ cells per well in a 96-well plate with plate-bound anti-CD3 at 5 μg/mL (BioLegend) to induce CD3+ cell proliferation. Cells were treated with and without a combination of anti–PD-1 at 10 μg/mL (BioLegend) and trametinib 10 or 100 nM for 5 days. Stimulation with or without both anti-CD3 at 5 μg/mL and anti-CD28 at 10 μg/mL (BioLegend) were included as positive and negative controls for T-cell activation. Using the MojoSort Human CD3 T Cell Isolation Kit (BioLegend), negative CD3+ selection was performed to isolate T cells from healthy donors. The isolated T cells were plated by using the same conditions as described earlier for mixed mononuclear cells. Additional mixed mononuclear cells were plated at 0.2 × 10⁶ cells per well in a 96-well plate without anti-CD3 stimulation and treated with a combination of IFN-γ at 10 ng/mL (BioLegend) and trametinib 10 nM or 100 nM for 1 to 5 days. Plates were incubated at 37°C, 5% carbon dioxide before analysis via flow cytometry.
Flow cytometry of murine and patient samples
Zombie Aqua dye (BioLegend) was used to identify live vs dead populations. Cells were washed and incubated with anti-mouse or anti-human TruStain FcX (BioLegend) to block nonspecific binding of fluorochromes. The following mouse antibodies were used: anti–CD3-APC, anti–CD4-BV421, anti–CD8-PerCP, anti–CD11b-BV785, anti–CD19-PEDazzle, anti–CD25-Alexa700, anti–CD44-BV650, anti–CD62L-APCCy7, anti–CD69-PerCP-Cy5.5, anti–CD127-BV605, anti–PD-1-PE, anti–PD-L1-BV711 (BioLegend), and anti–FoxP3-PE-Cy7 (Thermo Fisher Scientific). The following human antibodies were used: anti–CD3-APCCy7, anti–CD4-BV605, anti–CD8-PerCPCy5.5, anti–CD25-FITC, anti–CD33-BV711, anti–CD34-PEDazzle, anti–CD38-Alexa700, anti–CD45-PerCP, anti–CD45RA-BV785, anti–CD127-Alexa700, anti–CCR7-Alexa647, anti–PD1-PECy7, anti–PD-L1-BV650, anti–PD-L2-PE, and anti–HLA-DR-PEDazzle (BioLegend). Cells were fixed by using fixation buffer (BioLegend) or intracellular fixation buffer (Thermo Fisher Scientific). Data were acquired by using BD LSRFortessa and BD FACSDiva software (BD Biosciences). FlowJo version 10.5 (TreeStar) was used for postacquisition analysis.
Western blot analysis of patient samples
Patient samples were plated in a 6-well dish at 5 × 10⁶ per well and subsequently treated with either dimethyl sulfoxide or trametinib 10 nM for 16 hours; at this point, whole cell lysates were then prepared via 1X Lysis Buffer (Cell Signaling Technology), 1 mM complete mini-protease inhibitor (Roche), 1 mM phosphatase inhibitor (MilliporeSigma), and 1 mM phenylmethylsulfonyl fluoride. Protein concentration was quantified with a Pierce BCA Protein Assay Kit (Thermo Fisher Scientific). Solutions consisting of 6% sodium dodecyl sulfate, 150 mM Tris (pH 6.8), 30% glycerol, 0.1% bromophenol blue, and beta-mercaptoethanol were added to the samples and boiled at 100°C for 4 minutes. A total of 20 μg protein or 10 μL SeeBlue Plus ladder was loaded into a 12-well 4% to 15% Criterion Tris-Glycine Pre-cast Gel (Bio-Rad), and proteins were separated at 150 V for 1.5 hours in TBS with Tween 20 (TBST) buffer (Abcam). Proteins were transferred to a polyvinylidene difluoride membrane (Bio-Rad) overnight at 20 V. The membrane was blocked in a 5% bovine serum albumin/TBST solution for 1 hour, at which point the membrane was washed and incubated with phosphorylated extracellular signal–regulated kinase 1/2 (ERK1/2; 1:2000 in 5% bovine serum albumin; Cell Signaling Technology, clone no. D14.13.4E) for 1 hour at room temperature. Membranes were then washed with TBST and incubated with anti-rabbit horseradish peroxidase–conjugated secondary antibody for 1 hour at room temperature. Horseradish peroxidase was activated by using a 1:1 mixture of Clarify Western ECL Substrate Peroxide Solution and Clarity Western Luminol/Enhancer Reagent (Bio-Rad) and imaged on a ChemiDoc MP Imaging System (Model Universal Hood III; Bio-Rad). The membrane was then stripped according to the manufacturer’s protocol (Restore Stripping Buffer; Thermo Fisher Scientific) and reblocked for 1 hour. The membrane was then incubated with total ERK (1:2000; Cell Signaling Technology, clone no. 137F5) overnight at 4°C and visualized as described earlier. Data were analyzed by using Image Laboratory software (Bio-Rad).
Gene expression and trametinib response correlation analysis
To uncover genes, pathways, and networks that were significantly correlated to trametinib response, Pearson correlations were calculated between gene expression and area under the curve (AUC) of the drug response curve that was used to measure patients’ response to drug screening, according to drug response file, interpreted_inhibitor_results_probit_10_04_2018.txt and RNA-sequencing (RNA-seq) file, BeatAML_RNASeq_log2_cpm_2018_09_17.csv, as released by the BeatAML project.2 RNA-seq data have been normalized and log2 transformed. A total of 231 samples, which have both trametinib AUC values and RNA-seq data, were used for these correlation calculations.
Construction of reactome functional interaction network
To investigate functional relationships among genes significantly related to trametinib response, we first adjusted P values for Pearson correlations using the Benjamini-Hochberg false discovery rate (FDR) approach29 to correct for multiple tests; we then collected genes having correlations >0.3 or <−0.3 with an FDR <0.01. Afterward, the collected genes were uploaded to ReactomeFIViz,30 a Cytoscape app,31 to construct a Reactome functional interaction network32 and perform pathway enrichment analysis as described in the ReactomeFIViz manual (https://reactome.org/tools/reactome-fiviz).
Gene set enrichment analysis
Gene set enrichment analysis (GSEA) was used to infer significantly upregulated or downregulated pathways based on gene-wise scores.33,-35 A GSEA analysis was conducted with ReactomeFIViz by using correlations between gene expression and trametinib response as gene scores. To do this, transcript correlations were mapped into gene correlations by averaging if multiple transcripts annotated for genes. GSEA analysis results were visualized in ReactomeFIViz and then exported to local text files.
Statistical analysis
Repeated measures analysis of variance (ANOVA) tests and post hoc Tukey pairwise comparisons were conducted to determine if there was a difference in T-cell proliferation or cell viability after treatment. Percent change in PD-L1 was calculated by solving for the difference in geometric mean fluorescent intensity (GMFI) between the anti-CD3 stimulated cells and anti-CD3 plus trametinib-treated cells divided by the GMFI for anti-CD3 stimulated cells. A 2-sample Student t test with unequal variances was used to test for a statistical difference between 2 groups or a 1-sample Student t test was used to test for a statistical difference in the percent change from 0% where indicated. Unless otherwise indicated, all hypothesis tests were 2-sided, and a significance level of <0.05 was used. Statistical analyses were performed by using Stata/IC 15.1 (StataCorp). Graphs were generated by using Prism 8 software (GraphPad Software). Visual abstract was created by using BioRender.
Results
MEK inhibition restores T-cell proliferation in vitro for an AML mouse model
Proliferation assays were performed by using anti-CD3 stimulated and CFSE-labeled splenocytes from wild-type mice (n = 3) to determine the impact of trametinib on T-cell proliferation in vitro (Figure 1A-B). The T cells proliferated vigorously with both anti-CD3 and anti-CD3 plus anti-CD28 stimulation. On average (SD), 80.0% (9.5) and 95.0% (1.3) of T cells proliferated, respectively, under these conditions. The addition of trametinib 10 nM and 100 nM exhibited increasing T-cell proliferation inhibition to 8.3% (4.5) and 5.9% (3.1). A repeated measures ANOVA determined that the treatment conditions had a statistically significant effect on T-cell proliferation in the wild-type mice (F[4,8] = 154.51; P < .001). Tukey post hoc pairwise comparisons indicated that, compared with unstimulated cells, there was a statistically significant difference in proliferation with anti-CD3 (P < .001) and anti-CD3 plus anti–PD-1 (P < .001) treatment, but proliferation in no other treatment groups differed from unstimulated cells.
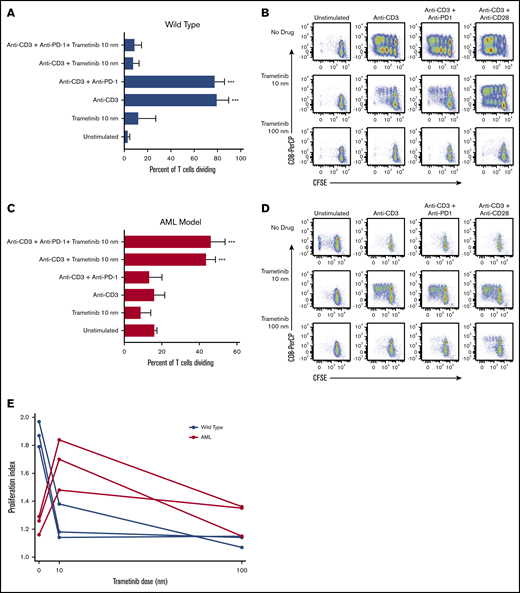
Differential murine T-cell proliferation response to treatment with trametinib in vitro. CFSE-stained splenocytes from wild-type and AML mice were treated in vitro with anti-CD3, trametinib, and/or anti–PD-1 and incubated for 3 days. (A,C) Mean ± standard deviation (SD) percentage of dividing T cells for wild-type and AML mice from 3 independent experiments. (B,D) Representative flow cytometry plots of T-cell division according to treatment condition gated on live CD3+ cells from 1 of 3 independent experiments for both wild-type and AML mice. (E) Proliferation index for T cells from wild-type and AML mice stimulated with anti-CD3 and treated with trametinib 0, 10, or 100 nM. (A,C) Displaying Tukey pairwise comparisons for unstimulated vs all other treatment conditions; statistically significant results displayed as: ***P < .001.
Differential murine T-cell proliferation response to treatment with trametinib in vitro. CFSE-stained splenocytes from wild-type and AML mice were treated in vitro with anti-CD3, trametinib, and/or anti–PD-1 and incubated for 3 days. (A,C) Mean ± standard deviation (SD) percentage of dividing T cells for wild-type and AML mice from 3 independent experiments. (B,D) Representative flow cytometry plots of T-cell division according to treatment condition gated on live CD3+ cells from 1 of 3 independent experiments for both wild-type and AML mice. (E) Proliferation index for T cells from wild-type and AML mice stimulated with anti-CD3 and treated with trametinib 0, 10, or 100 nM. (A,C) Displaying Tukey pairwise comparisons for unstimulated vs all other treatment conditions; statistically significant results displayed as: ***P < .001.
We performed the same 3-day proliferation assay using CFSE-labeled splenocytes from our AML murine model (n = 3) (Figure 1C-D). In contrast to the wild-type mice, T cells stimulated with anti-CD3 and anti-CD3 plus anti-CD28 stimulation exhibited minimal proliferation: 16.4% (5.1) and 15.6% (8.3), respectively. However, when cells were stimulated with anti-CD3 and treated with trametinib 10 nm, we were able to restore partial proliferation, particularly in CD8+ cells, to 44.0% (4.5). A repeated measures ANOVA showed that treatment resulted in a statistically significant difference in the percentage of dividing T cells (F[4,8] = 60.97; P < .001). Tukey post hoc pairwise comparisons identified that compared with unstimulated cells, there was a statistically significant difference in proliferation only with anti-CD3 plus trametinib 10 nM (P < .001) and anti-CD3, anti–PD-1 plus trametinib 10 nM (P < .001). We observed decreased mean proliferation of T cells to 9.3% (7.6) when the trametinib dose was increased to 100 nM. In the absence of T-cell stimulation, trametinib 10 nM had no effect on T-cell proliferation.
The FlowJo proliferation tool was used to calculate the proliferation index for T cells stimulated with anti-CD3 and treated with no drug, trametinib 10 nM, or trametinib 100 nM (Figure 1E). A repeated measures ANOVA revealed a difference in T-cell proliferation indexes among wild-type or AML mice after treatment with trametinib (F[2,4] = 60.44; P = .001 and F[2,4] = 11.86; P = .021, respectively). For wild-type mice, a statistically significant difference was noted in the proliferation index between T cells treated with no drug compared with treatment with trametinib 10 nM (P = .002) and between no drug and treatment with trametinib 100 nM (P = .001). For the AML mice, a statistically significant difference was observed in the proliferation index between T cells treated with no drug compared with treatment with trametinib 10 nM (P = .024) and between treatment with trametinib 10 nM and 100 nM (P = .036). In summary, decreasing T-cell proliferation was seen with increasing doses of trametinib for wild-type mice, which is in contrast with the AML mice that exhibited peak proliferation after treatment with trametinib 10 nM.
MEK inhibition effect on in vitro T-cell proliferation in primary AML patient and healthy donor samples differs
Using a 5-day proliferation assay, the effect of trametinib on T-cell proliferation was assessed in healthy donor samples (n = 4) compared with primary AML samples (n = 8) collected at the time of initial diagnosis. The healthy donor peripheral blood mononuclear cells were stimulated with anti-CD3 and treated with trametinib 10 nM or 100 nM. We observed high T-cell division with a mean (SD) of 76.8% (7.7) after anti-CD3 stimulation for the healthy donors (Figure 2A-B). Similar to what was observed with the wild-type mice, treatment with trametinib decreased mean (SD) healthy donor T-cell proliferation in a dose-dependent manner at trametinib 10 and 100 nM to 54.8% (14.7) and 2.6% (2.0), respectively.
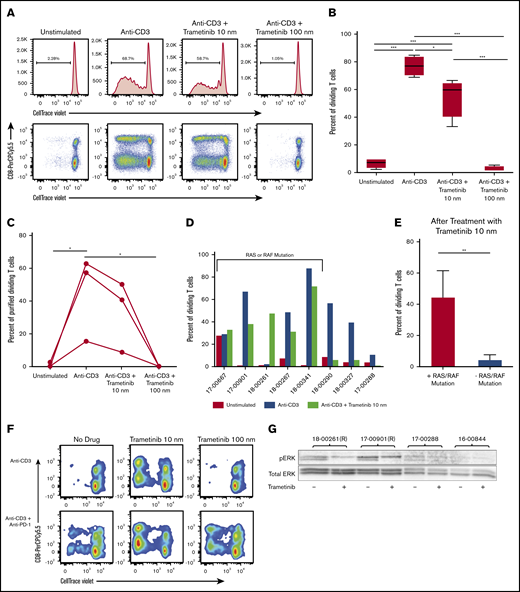
AML patient and healthy donor T-cell proliferation response to treatment with trametinib in vitro differs. Mononuclear cells isolated from peripheral blood or bone marrow samples from patients or healthy donors were stained with CellTrace Violet and treated in vitro with anti-CD3 and/or trametinib followed by a 5-day incubation period. (A) Representative flow cytometry plots of proliferation from a healthy donor gated on live CD3+ cells with and without treatment with trametinib. (B) Summary of the percentage of dividing T cells for healthy donors (n = 4) plated with mononuclear cells after treatment with trametinib. (C) Summary of the percentage of purified healthy donor (n = 3) T cells after treatment with trametinib. (D) Report of the percentage of dividing T cells from primary patient samples (n = 8) after stimulation and treatment with trametinib grouped according to presence or absence of an identified RAS or RAF mutation. (E) Mean ± SD percentage of dividing T cells after stimulation with anti-CD3 and treatment with trametinib 10 nM separated by the presence of either an RAS or RAF mutation or the absence of both. (F) T-cell proliferation of a patient sample after anti-CD3 stimulation and treatment with anti–PD-1 and/or trametinib 10 or 100 nM. (G) Western blot analysis of p-ERK and total ERK from viably frozen AML patient samples with and without an RAS (R) mutation. (B-C) Displaying Tukey pairwise comparisons between treatment conditions. (E) Two-sided Student t test with unequal variances. (B-C,E) Statistically significant results displayed as: *P < .05; **P < .01; ***P < .001.
AML patient and healthy donor T-cell proliferation response to treatment with trametinib in vitro differs. Mononuclear cells isolated from peripheral blood or bone marrow samples from patients or healthy donors were stained with CellTrace Violet and treated in vitro with anti-CD3 and/or trametinib followed by a 5-day incubation period. (A) Representative flow cytometry plots of proliferation from a healthy donor gated on live CD3+ cells with and without treatment with trametinib. (B) Summary of the percentage of dividing T cells for healthy donors (n = 4) plated with mononuclear cells after treatment with trametinib. (C) Summary of the percentage of purified healthy donor (n = 3) T cells after treatment with trametinib. (D) Report of the percentage of dividing T cells from primary patient samples (n = 8) after stimulation and treatment with trametinib grouped according to presence or absence of an identified RAS or RAF mutation. (E) Mean ± SD percentage of dividing T cells after stimulation with anti-CD3 and treatment with trametinib 10 nM separated by the presence of either an RAS or RAF mutation or the absence of both. (F) T-cell proliferation of a patient sample after anti-CD3 stimulation and treatment with anti–PD-1 and/or trametinib 10 or 100 nM. (G) Western blot analysis of p-ERK and total ERK from viably frozen AML patient samples with and without an RAS (R) mutation. (B-C) Displaying Tukey pairwise comparisons between treatment conditions. (E) Two-sided Student t test with unequal variances. (B-C,E) Statistically significant results displayed as: *P < .05; **P < .01; ***P < .001.
Our analysis and others have indicated that trametinib affects both tumor cells and T cells directly. In fact, it has been shown that there is a dose-dependent inhibition of purified T-cell proliferation from healthy donors and that the inhibition can be overcome by signaling through interleukin-15.16 We performed experiments to test the effect of trametinib on purified T cells in the doses and conditions used for the proliferation assays. T cells from the blood of 3 healthy subjects were purified and cultured with anti-CD3 in the presence of trametinib 0, 10, or 100 nM. Our results indicate that, as was found in the mixed cultures for healthy donors (Figure 2B), partial inhibition of the purified T-cell proliferation was observed in the presence of low-dose (10 nM) trametinib and complete inhibition of proliferation at the 100 nM dose (Figure 2C). These findings agree with the literature showing that doses as low as 8 nM still allow T-cell proliferation, whereas there is complete inhibition of all T-cell proliferation at 200 nM.36
With the primary AML patient samples, varying levels of proliferation with anti-CD3 stimulation were observed after 5 days (Figure 2D). The percentage of dividing T cells after stimulation ranged from 2.87% to 88.3%. Although the sample size is small, we observed differing effects in T-cell proliferation after treatment with trametinib for samples with an identified RAS or RAF mutation compared with samples without (Figure 2E). On average (SD), 44.8% (16.7) of T cells were dividing after treatment with trametinib 10 nM for samples with a RAS or RAF mutation compared with 4.8% (2.9) without (P = .005).
In one particular patient sample, <3% of the patient’s T cells divided with anti-CD3 stimulation alone, suggesting high T-cell suppression (Figure 2F). When treated with trametinib 10 nm, the number of proliferating T cells increased to 48%. We observed that treatment with trametinib 10 nM and anti–PD-1 had an even greater effect on T-cell proliferation, and with the combination therapy, 73% of T cells divided. This increased proliferation response is similar to findings previously reported about this combination therapy in other cancers.17
To better understand the effect of the 10 nM dose of trametinib, the levels of phosphorylation of ERK1/2 were measured in primary patient samples. We identified viably frozen patient samples in our bank with or without RAS mutations. After overnight culture with trametinib 10 nM or vehicle control, p-ERK was measured by using western blot analysis. The samples with RAS mutations had higher basal levels of p-ERK than the samples without RAS mutations. A partial reduction of phosphorylation of ERK was further detected in the presence of trametinib 10 nM, indicating that this dose is pharmacologically active in AML patient samples (Figure 2G).
Inhibition of MEK increases proliferation of previously activated T cells by rescue from activation-induced apoptosis
Previous studies on the immunomodulatory effects of MEK inhibitors have shown that inhibition of the MAPK pathway inhibits activation-induced apoptosis in previously activated T cells.17,37 We examined the effects of trametinib on T-cell viability in our proliferation assays. Repeated measures ANOVA tests reported a statistical difference in viability after stimulation and treatment of both the AML mice (F[3,6] = 14.29; P = .004) and wild-type mice (F[3,6] = 9.56; P = .012). A decrease in T-cell viability was observed in response to T-cell receptor ligation with anti-CD3 compared with unstimulated cells (mean difference, −59.0%; P = .003) in our AML model (Figure 3A). This finding is in contrast to the effect of T-cell activation in the cultures from healthy control subjects in which CD3 stimulation did not result in a drop in viability (Figure 3B). In the AML cultures, addition of trametinib to the cultures increased overall viability of T cells at both 10 nM and 100 nM concentrations (P = .023 and P = .028, respectively). Contrary to this finding, in the cultures derived from wild-type mice, trametinib 10 nM and 100 nM reduced the overall viability of T cells (P = .070 and P = .008).
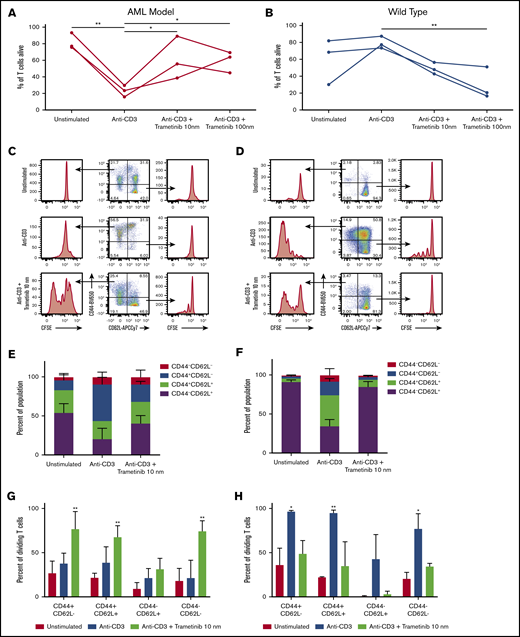
Trametinib impact on in vitro naive and effector T-cell viability and proliferation response. CFSE-labeled CD3+ cells from wild-type and AML mice after a 3-day in vitro proliferation assay. (A-B) Summary of the percentage of Zombie Aqua negative, or alive, CD3+ cells from AML (n = 3) and wild-type (n = 3) mice from 3 independent experiments. (C-D) Representative flow cytometry plots gated on CD3+CD8+ cells showing proliferation for subpopulations divided by CD44 or CD62L expression for cells from an AML mouse and a wild-type mouse treated in vitro with no stimulation, anti-CD3 stimulation, or anti-CD3 stimulation plus trametinib 10 nM. (E-F) Mean ± SD population percentages for expression of CD44 and/or CD62L for CD3+CD8+ cells from AML mice (n = 3) or wild-type mice (n = 3). (G-H) Mean ± SD percentage of dividing CD3+CD8+ T cells from AML (n = 3) and wild-type mice (n = 3) divided by expression of CD44 and/or CD62L and treatment condition. Displaying Tukey pairwise comparisons between treatment conditions (A-B), Tukey pairwise comparison for unstimulated vs all other treatment conditions (G-H). (A-B,G-H) Statistically significant results displayed as: *P < .05; **P < .01.
Trametinib impact on in vitro naive and effector T-cell viability and proliferation response. CFSE-labeled CD3+ cells from wild-type and AML mice after a 3-day in vitro proliferation assay. (A-B) Summary of the percentage of Zombie Aqua negative, or alive, CD3+ cells from AML (n = 3) and wild-type (n = 3) mice from 3 independent experiments. (C-D) Representative flow cytometry plots gated on CD3+CD8+ cells showing proliferation for subpopulations divided by CD44 or CD62L expression for cells from an AML mouse and a wild-type mouse treated in vitro with no stimulation, anti-CD3 stimulation, or anti-CD3 stimulation plus trametinib 10 nM. (E-F) Mean ± SD population percentages for expression of CD44 and/or CD62L for CD3+CD8+ cells from AML mice (n = 3) or wild-type mice (n = 3). (G-H) Mean ± SD percentage of dividing CD3+CD8+ T cells from AML (n = 3) and wild-type mice (n = 3) divided by expression of CD44 and/or CD62L and treatment condition. Displaying Tukey pairwise comparisons between treatment conditions (A-B), Tukey pairwise comparison for unstimulated vs all other treatment conditions (G-H). (A-B,G-H) Statistically significant results displayed as: *P < .05; **P < .01.
In addition to inhibiting activation-induced apoptosis in activated T cells, MAPK pathway inhibition has been shown to inhibit activation of naive T cells.17,37 For this reason, we examined the effect of trametinib on activated vs naive T cells in AML and compared it vs cultures from wild-type mice. The CD3+CD8+ T cells were subdivided to evaluate proliferation of subpopulations by using CD62L and CD44 (Figure 3C-D). CD62L, a lymph node homing receptor, is expressed on naive T cells, although it is also seen on memory T cells. CD44, a cell adhesion molecule, is highly expressed on effector and memory T-cell populations. We observed that the majority of T cells from the AML mice have a previously activated phenotype as indicated by CD44 expression, whereas T cells from wild-type mice are >90% naive (Figure 3E-F). In the AML cultures, after activation with anti-CD3, the naive (CD44–CD62L+) population decreased in size, whereas the effector (CD44+CD62L–) population grew. This scenario is in contrast to the cells treated with anti-CD3 plus trametinib 10 nM, which exhibited minimal changes in CD3+CD8+ subpopulations compared with the unstimulated condition.
We then compared differences in proliferation between the subpopulations. Significantly increased proliferation was observed in CD44+CD62L– (P = .009), CD44+CD62L+ (P = .007), and CD44–CD62L– (P = .001) subpopulations but not the CD44–CD62L+ naive population following treatment with trametinib compared with unstimulated cells in the AML mice (Figure 3E). When we assessed the effects in wild-type cultures, both the naive and activated populations expanded in response to CD3 stimulation (Figure 3F). When trametinib was added to the cultures, the activated (CD44+CD62L–) population still proliferated, whereas the naive population was inhibited from proliferation by trametinib (Figure 3G-H).
In summary, in AML mice, the majority of CD8+ T cells were previously activated as measured according to CD44 expression. Trametinib allowed increased proliferation and decreased apoptosis in this population. In wild-type mice, the majority of CD8+ T cells isolated from the spleen are naive. Trametinib inhibits activation and proliferation of naive cells, whereas activated cells still proliferate in the presence of trametinib.
Trametinib-sensitive samples express RAS mutations and have upregulated inflammatory pathways
The association between PD-L1 expression and trametinib sensitivity was investigated to further characterize the potential tumor intrinsic immunomodulatory effects. Using data available from the BeatAML Vizome site,2 samples with an NRAS mutation or KRAS mutation were the most sensitive to trametinib in a drug sensitivity screen assay (Figure 4A). We then identified the samples with the 25% highest (“resistant”) and 25% lowest (“sensitive”) AUC values from the drug-testing results. According to the RNA-seq data, the more resistant samples had lower CD274 (PD-L1) expression compared with the sensitive samples (P = .002) (Figure 4B).
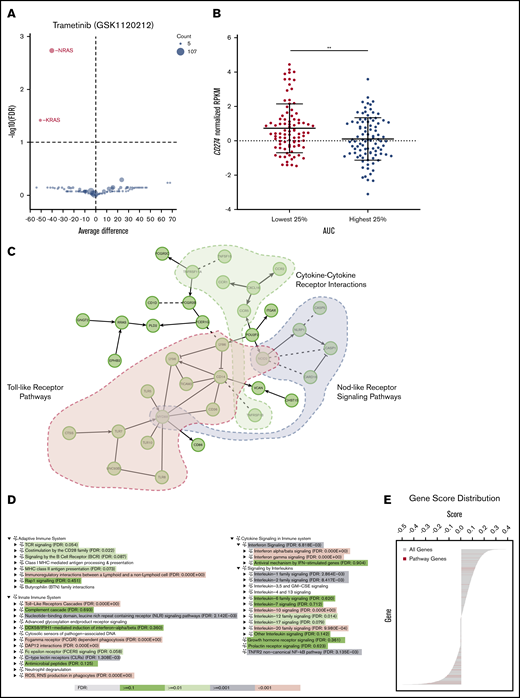
Upregulated immune response pathways are present in trametinib-sensitive samples. (A) Volcano plot displaying trametinib sensitivity according to gene from the BeatAML database with sensitive samples highlighted in red. (B) Differential CD274 expression for samples from the BeatAML database with 25% highest and 25% lowest AUC values. (C) A functional interaction (FI) network constructed for genes with correlations between transcript expression and trametinib response (AUC) >0.3 or <−0.3 and an FDR <0.01. Genes are displayed as nodes and FIs between genes as edges: solid lines are for annotated FIs, dashed lines for predicted FIs, -> for activation or catalysis, and -| for inhibition. This FI network significantly enriches many pathways, 3 of which are highlighted: Toll-like receptor pathways (FDR = 1.4E-13), cytokine-cytokine receptor interaction (FDR = 4.4E-4), and NOD-like receptor signaling pathway (FDR = 4.4E-4). (D) GSEA analysis uncovers pathways in immune systems that are significantly upregulated in trametinib-sensitive AML samples. Immune system pathways are organized into 3 categories in Reactome (https://reactome.org/PathwayBrowser/#/R-HSA-168256): Adaptive Immune Systems, Innate Immune System, and Cytokine Signaling in Immune System. (E) Distribution of correlations of gene expression and trametinib response for genes annotated in Toll-like receptor cascades (red lines) in the background for all genes, indicating the significantly skewed distribution of pathway genes on the negative correlation side. (B) Displaying 2-sided, 2-sample Student t test with unequal variances; statistically significant results displayed as: **P < .01.
Upregulated immune response pathways are present in trametinib-sensitive samples. (A) Volcano plot displaying trametinib sensitivity according to gene from the BeatAML database with sensitive samples highlighted in red. (B) Differential CD274 expression for samples from the BeatAML database with 25% highest and 25% lowest AUC values. (C) A functional interaction (FI) network constructed for genes with correlations between transcript expression and trametinib response (AUC) >0.3 or <−0.3 and an FDR <0.01. Genes are displayed as nodes and FIs between genes as edges: solid lines are for annotated FIs, dashed lines for predicted FIs, -> for activation or catalysis, and -| for inhibition. This FI network significantly enriches many pathways, 3 of which are highlighted: Toll-like receptor pathways (FDR = 1.4E-13), cytokine-cytokine receptor interaction (FDR = 4.4E-4), and NOD-like receptor signaling pathway (FDR = 4.4E-4). (D) GSEA analysis uncovers pathways in immune systems that are significantly upregulated in trametinib-sensitive AML samples. Immune system pathways are organized into 3 categories in Reactome (https://reactome.org/PathwayBrowser/#/R-HSA-168256): Adaptive Immune Systems, Innate Immune System, and Cytokine Signaling in Immune System. (E) Distribution of correlations of gene expression and trametinib response for genes annotated in Toll-like receptor cascades (red lines) in the background for all genes, indicating the significantly skewed distribution of pathway genes on the negative correlation side. (B) Displaying 2-sided, 2-sample Student t test with unequal variances; statistically significant results displayed as: **P < .01.
To better understand the inflammatory profile associated with trametinib sensitivity, we performed an analysis of the transcriptome associated with trametinib sensitivity by using pathway- and network-based approaches. We constructed a Reactome functional interaction network for genes having significantly strong positive or negative correlations between gene expression and drug response. Pathway enrichment analysis for this functional interaction network suggests a significant association between trametinib response and several immune activation pathways, including NOD-like receptor, Toll-like receptor, and cytokine/cytokine receptor networks (Figure 4C). To investigate the regulation direction (eg, up or down) of pathways and trametinib response, a GSEA analysis was conducted by using correlations of gene expression and trametinib response as gene scores, and observed that pathways annotated for innate, adaptive immunity, and cytokine signaling were significantly enriched in trametinib-sensitive patient samples (Figure 4D). Genes in the “Toll-Like Receptors Cascades” pathway have a significantly negatively skewed distribution of correlations than expected by chance, implying that this pathway was significantly upregulated in trametinib-sensitive samples (Figure 4E).
MEK inhibition decreases PD-L1 expression on myeloid cells in an AML murine model and primary patient samples in vitro
Using the 3-day proliferation assay, we assessed PD-L1 expression on CD11b+ myeloid cells in the AML model after harvest via flow cytometry. PD-L1 expression on myeloid cells decreased in a dose-dependent manner after treatment with trametinib 10 nM and 100 nM (Figure 5A-C). The mean (standard error [SE]) percent change in PD-L1 expression on cells treated with trametinib 10 nM was −52.8% (16.5) (P = .085), and at 100 nM it was −86.2% (3.5) (P = .002).
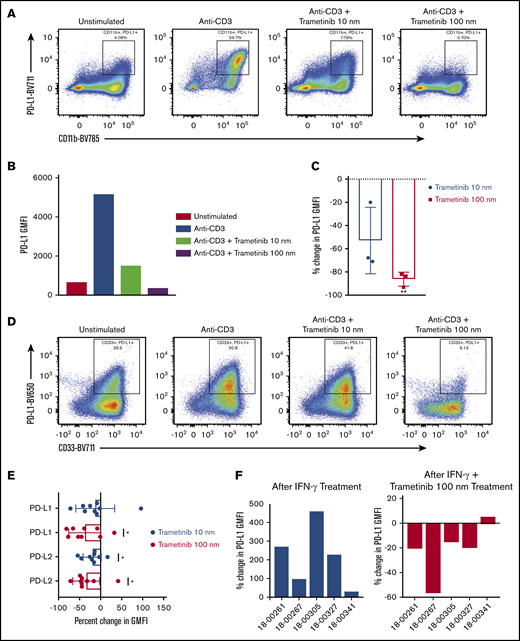
Treatment with trametinib decreases PD-L1 and PD-L2 expression. After proliferation assays were performed by using murine or human samples, PD-L1 expression was assessed via flow cytometry on CD11b+ or CD33+ cells, respectively. (A-B) Representative plots of the treatment effect of trametinib on PD-L1 expression on CD11b+ cells from an AML mouse. (C) Mean ± SD percent change in PD-L1 GMFI on CD11b+ cells from AML mice (n = 3) after treatment with trametinib 10 nM and 100 nM. (D) Flow cytometry plot of PD-L1 expression on CD33+ cells after treatment with trametinib from 1 of 9 independent experiments using patient samples. (E) Mean ± SD percent change in PD-L1 and PD-L2 GMFI on CD33+ cells from patient samples after treatment with trametinib 10 or 100 nM. (F) Percent change in PD-L1 GMFI between no treatment and after treatment with IFN-γ, and percent change in PD-L1 GMFI between treatment with IFN-γ and treatment with IFN-γ plus trametinib 100 nM. (C,E-F) Two-sided, 1-sample Student t tests. (C,E) Statistically significant results displayed as: *P < .05; **P < .01.
Treatment with trametinib decreases PD-L1 and PD-L2 expression. After proliferation assays were performed by using murine or human samples, PD-L1 expression was assessed via flow cytometry on CD11b+ or CD33+ cells, respectively. (A-B) Representative plots of the treatment effect of trametinib on PD-L1 expression on CD11b+ cells from an AML mouse. (C) Mean ± SD percent change in PD-L1 GMFI on CD11b+ cells from AML mice (n = 3) after treatment with trametinib 10 nM and 100 nM. (D) Flow cytometry plot of PD-L1 expression on CD33+ cells after treatment with trametinib from 1 of 9 independent experiments using patient samples. (E) Mean ± SD percent change in PD-L1 and PD-L2 GMFI on CD33+ cells from patient samples after treatment with trametinib 10 or 100 nM. (F) Percent change in PD-L1 GMFI between no treatment and after treatment with IFN-γ, and percent change in PD-L1 GMFI between treatment with IFN-γ and treatment with IFN-γ plus trametinib 100 nM. (C,E-F) Two-sided, 1-sample Student t tests. (C,E) Statistically significant results displayed as: *P < .05; **P < .01.
We next investigated AML patient samples. PD-L1 and PD-L2 expression on CD33+ cells was assessed after the 5-day proliferation assay (Figure 5D-E). Dose-dependent decreases were observed in PD-L1 and PD-L2 expression. On average (SE), a −12.8% (15.4) change in PD-L1 after treatment with trametinib 10 nM was observed, although this finding was not statistically significant (P = .430). There was an increase in PD-L1 expression in 1 patient sample that altered the overall observed effect. A mean (SE) percent change in PD-L1 expression of −37.8% (12.8) (P = .018) was observed after treatment with trametinib 100 nM and a mean change in PD-L2 expression of −19.9% (7.1) (P = .023) after trametinib 10 nM and −34.4% (10.6) (P = .012) after trametinib 100 nM.
Using patient samples, we next showed that PD-L1 on CD33+ cells could be upregulated when cultured with IFN-γ (Figure 5F). The mean (SE) percent change in PD-L1 expression was 214% (74.8) (P = .046). We then showed that PD-L1 upregulation by IFN-γ could be attenuated by the addition of trametinib. On average (SE), the percent change in PD-L1 expression after treatment with IFN-γ plus trametinib compared with IFN-γ alone was −20.5% (9.9) (P = .107).
Discussion
Previous studies in other cancer models have reported unanticipated immune effects of MEK inhibition leading to improved antitumor immune responses, including increased T-cell tumor infiltration, inhibition of apoptosis driven by T-cell receptor activation, and reduced expansion of myeloid-derived suppressor cell populations.16,,,-20 The impact of MEK inhibition on the immune microenvironment in AML remains poorly studied. The current study investigated the importance of the MAPK pathway for both T cells and AML blasts.
First, in the AML mouse, we found that the majority of T cells in the spleen exhibited a previously activated phenotype and rapidly underwent apoptosis in response to T-cell activation, limiting the ability of T cells to proliferate (Figures 1 and 3). Inhibition of MEK with trametinib reestablished T-cell proliferation with increased T-cell viability, while also impairing naive T-cell activation. Thus, the role of the MAPK pathway for effector T cells and naive T cells is likely distinct. These results are similar to results previously reported in colon carcinoma mouse models, in which it was shown that activation-induced cell death in T cells requires the MAPK pathway and can be inhibited by drugs blocking MEK activation.17 Other studies have shown that at higher doses (200 nM), which may be important for other tumor types (eg, ovarian cancer), T-cell proliferation is completely inhibited. Significantly, this trametinib-mediated effect on T cells could be reversed by exposure to interleukin-15,16 indicating that the cytokine environment can be manipulated to still allow for effective targeted agent and immune therapy combinations.
Second, we looked at characteristics of trametinib-sensitive AML samples by examining a large dataset of functional drug screens on primary samples. An association was observed between RAS mutation status and sensitivity of AML samples to trametinib (Figure 4). We also found that trametinib-sensitive samples have increased messenger RNA levels for the CD274 (PD-L1) gene and an inflamed immune gene expression profile (Figure 4). Although we observed an association with trametinib sensitivity and PD-L1 expression, we did not detect a statistically significant association between NRAS and/or KRAS mutations and PD-L1 RNA levels when the expression pattern of 91 samples with RAS mutations were compared with 423 samples without RAS mutations (www.vizome.org2 ). Because the effect of trametinib on samples with wild-type RAS was detected in both our mouse model and the primary patient samples, it is clear that the impact on PD-L1 levels is not limited to samples with RAS mutations. AML is a disease with diverse driving mutations, many of which will result in activation of the MAPK pathway, and samples with both wild-type and mutated RAS25,38 have been shown to respond to an MEK inhibitor. FLT3-ITD is the most common mutation in AML, present in approximately one-third of AML cases, and this mutation also results in MEK activation.39 We also observed an association between Toll-like receptor, NLR, and cytokine-signaling pathways and trametinib sensitivity, indicating that trametinib-sensitive samples are “immunologically active” and have an inflammatory phenotype compared with all other AML samples in this dataset. In summary, we believe that because a diverse array of mutations often co-occurring in complex combinations in AML results in activation of the MAPK pathway and immune genes (Figure 4C-E), trametinib sensitivity is not limited to samples with RAS mutations, making it more challenging to predict which patients will benefit from trametinib therapy.41
Finally, we found that in addition to trametinib acting on T cells intrinsically, effects were observed on the blast population. We find that MEK inhibition results in potential reduction of the immunosuppression in the tumor microenvironment via impacts on PD-L1 and PD-L2 expression on blast cells (Figure 5). PD-L1 and PD-L2 can be expressed on tumor cells and bind PD-1, resulting in T-cell dysfunction and tumor cell immune evasion.40,,,-44 Upregulation of PD-L1 and PD-L2 can be a result of both type 1 and type 2 interferon signaling, as well as oncogenic signaling.45,-47 Tumors with activating RAS mutations have increased PD-L1 levels, implicating higher T-cell evasion in cancers with mutant RAS.47 We found that trametinib exposure results in reduced PD-L1 and PD-L2 levels on AML cells in both mice and patient samples with and without RAS mutations. Our results confirm, in both mouse and human, findings previously reported in 2 separate AML cell lines (THP-1 and U937).48 These data show that, in addition to potentially targeting tumor survival with trametinib, MEK inhibition can reduce immunosuppression in AML.
There are many clinical trials studying immunotherapies in AML.7,9,49 However, immunotherapies may fail as monotherapies in clinical trials if there is strong persisting immunosuppression in the tumor microenvironment or because of a relatively lower mutational burden.42,44,50,-52 Previous research in other cancer models have reported benefits of using MEK inhibition in combination with immunotherapies, including checkpoint inhibitors, adoptive T-cell therapy, and viral therapy.17,,-20,53,54 Subpopulations of patients with AML may have improved response to immunotherapies when used in combination with targeted agents (Figure 2). For this reason, we believe our data are useful in beginning to determine immune evasion pathways (eg, MEK signaling) in AML to target these pathways with the combination of targeted inhibitors and immune-based therapies (eg, checkpoint inhibitors, bi-specifics, vaccines, CAR T-cell therapies).
Acknowledgments
This work was supported by grant U54CA224019 (E.F.L. and S.K.M.) from the National Institutes of Health (NIH), National Cancer Institute, grant U41HG003751 (G.W.) from the NIH, National Human Genome Research Institute, and by the Oregon Clinical and Translational Research Institute grant TL1TR002371 (K.B.M.) from the NIH, National Center for Advancing Translational Sciences.
The content is solely the responsibility of the authors and does not necessarily represent the official views of the National Institutes of Health.
Authorship
Contribution: E.F.L. and K.B.M. conceptualized and designed the experiments; H.J.C. and M.T.N. performed the mouse experiments; K.B.M. performed the patient sample experiments; K.A.R. performed the western blot experiments; K.B.M, G.W., Y.K., and S.K.M. performed data analysis and created the figures; and E.F.L., K.B.M., and G.W. wrote the manuscript.
Conflict-of-interest disclosure: E.F.L. receives research support from Janssen Pharmaceuticals, Celgene, and Amgen. The remaining authors declare no competing financial interests.
Correspondence: Evan F. Lind, Oregon Health & Science University, 3181 SW Sam Jackson Park Rd, KR-HEM, Portland, OR 97239; e-mail: linde@ohsu.edu.

