

Key Points
We assessed treatment and outcomes disparities among white, African American, and Hispanic patients with MM.
Significant variations in therapy and ASCT use were observed among different racial/ethnic groups with MM despite similar overall survival.

Abstract
The objective of the study was to assess racial disparities in the treatment and outcomes among white, African American, and Hispanic patients with multiple myeloma (MM). Patients with an MM diagnosis from the Surveillance Epidemiology and End Results (SEER)–Medicare (2007-2013) database were included. Continuous Medicare enrollment for 6 months before (baseline) and after MM diagnosis was required unless death occurred. Time from MM diagnosis to novel therapy initiation and autologous stem cell transplant (ASCT), overall survival (OS), and MM-specific survival (MSS) was evaluated. Unadjusted and multivariable regressions compared African Americans and Hispanics vs whites. Trends of novel therapy and ASCT use across MM diagnosis years were assessed using linear regression models. The study included 3504 whites, 858 African Americans, and 468 Hispanics. African Americans and Hispanics had a longer time from MM diagnosis to novel therapy initiation vs whites (median: 5.2 and 4.6 vs 2.7 months, respectively). All cohorts had an increasing trend of novel therapy initiation within 6 months of MM diagnosis, particularly whites (all P < .05). Median MSS was significantly longer for African Americans (5.4 years) than whites (4.5 years; P < .05), and was comparable for Hispanics and whites. Median OS was similar overall (2.6-2.8 years). ASCT rate within 1 year of MM diagnosis rose among whites and African Americans (P < .05), but not Hispanics, who were less likely to receive ASCT vs whites. Significant variations in novel therapy and ASCT use were observed among different racial/ethnic groups with MM. Although OS was similar, both African Americans and Hispanics may not be fully benefitting from the introduction of novel therapies, as they receive them later than whites.
Introduction
Multiple myeloma (MM) is a cancer formed by the proliferation of malignant plasma cells in the bone marrow and can result in skeletal lesions and fractures as well as anemia, infections, or hypercalcemia.1 MM accounts for approximately 10% of hematological malignancies.2 In 2018, there were an estimated 30 770 new MM cases and 12 770 deaths attributable to MM in the United States, and as of 2015, an estimated 124 733 Americans were living with MM.3 MM is relatively rare, but it is more common in men compared with women, and among African Americans compared with whites.3,4
Conventional treatments for MM include chemotherapy, radiation therapy, and autologous stem cell transplant (ASCT).5 Novel therapies, such as the immunomodulatory drugs lenalidomide and pomalidomide and the proteasome inhibitors bortezomib and carfilzomib, have increased treatment options for MM.6 In addition, earlier exposure and increased use of these novel drugs have improved outcomes among patients with MM, nearly doubling the overall survival (OS) of patients with MM within the past decade.7,8 As a result, several MM treatment guidelines, including those from the National Comprehensive Cancer Network (NCCN) and the Mayo Stratification for Myeloma and Risk-adapted Therapy (mSMART), recommend bortezomib- and/or lenalidomide-based regimens as first-line therapy for newly diagnosed MM, with pomalidomide- and carfilzomib-based regimens recommended for relapsed/refractory MM.9,10 In addition, ASCT remains the standard of care for transplant-eligible patients, providing a larger benefit when used earlier in the treatment paradigm of MM.9,11,12
Previous studies have suggested that disease biology and characteristics may be different among patients with MM from different racial and ethnic groups.4,13,-15 Furthermore, racial disparities may exist in regard to patient access to ASCT and novel therapies for MM,16,17 and differences have been reported in OS among patients with MM in different racial/ethnic groups.18,-20 For example, age of onset has been reported to be younger for African Americans vs whites, and African Americans have a lower frequency of high-risk disease but higher rates of anemia.4,15 At this time, the survival rate is higher among African Americans vs among whites with MM (1973-2005).20 However, improvement in OS has been more dramatic among whites over time.20 In addition, a Surveillance Epidemiology and End Results (SEER)–based analysis reported differences in the median age at MM diagnosis (ie, Hispanics had a younger median age [65 years] vs African Americans [66 years] and whites [71 years]), as well as in OS (Hispanics had lower OS than other races/ethnicities).18 A study published in 2017 by Ailawadhi et al assessed trends in the use of lenalidomide, thalidomide, bortezomib, and ASCT among racial-ethnic cohorts between 2007 and 2009 and noted a rising trend in ASCT use for all groups but African Americans.16 Thus, these real-world studies have used relatively dated data that largely precedes the introduction of the majority of the currently used newer therapies (eg, carfilzomib, daratumumab, panobinostat, and ixazomib) for MM. It is yet unknown whether racial disparities exist in the trends of the use of these newer agents, ASCT use, and survival outcomes in more recent years. Moreover, racial disparities in economic outcomes have not been well studied.
To address this gap in the literature, the present study used recent SEER registry data (2007-2013) linked to Medicare data (2007-2014) to assess racial disparities in novel therapy use, ASCT use, and their trends over time. This study focuses on comparing African Americans and Hispanics vs whites with MM, as previous studies demonstrated significant disparities in treatment access in these racial/ethnic groups.16,,,-20 The current study also distinctly aimed at assessing the disparities in OS and MM-specific survival, as well as time to first urgent care utilization and health care costs, among these racial/ethnic groups during the aforementioned period.
Methods
Data source
This study was conducted using data from the SEER-Medicare database, which links 2 large, population-based databases at the patient level. The Medicare database includes claims related to hospital care (Part A), outpatient medical services (Part B), and outpatient drug prescriptions (Part D) available from 2007 through 2014 among Americans aged 65 years or older and certain disabled patients. The National Cancer Institute’s SEER database contains clinical, demographic, and survival data on new cancer cases diagnosed from 1973 to 2013 from 20 US geographic areas covering approximately 30% of the US population. Approximately 97% of SEER patients who are aged 65 years or older are Medicare-linkable; almost all patients are covered under parts A and B, with roughly 50% of patients covered through Part D.21 Medicare claims data from 2007 to 2014 and SEER data from 2007 to 2013 were used in the analysis. This study received an exemption from review from the New England Institutional Review Board on 17 April 2017.
Study population
The patient selection process is illustrated in Figure 1. White, African American, and Hispanic patients with a confirmed MM diagnosis (International Classification of Diseases for Oncology, 3rd Edition, histology code 9732) from the SEER-Medicare (2007-2013) database were included. The initial MM diagnosis date was defined as the index date. Patients were also required to be continuously enrolled in Medicare parts A, B, and D from 6 months before the index date (the baseline period) to at least 6 months after the index date or death, whichever occurred first. Patients were excluded if they were participating in a clinical trial during the study period or had other lymphatic or hematopoietic cancers recorded in the database at any time. The study population was classified into mutually exclusive white (non-Hispanic), African American (non-Hispanic), and Hispanic racial/ethnic cohorts on the basis of the patients’ recorded race/ethnicity in the database. Patients not falling in these 3 racial/ethnic categories were not included.
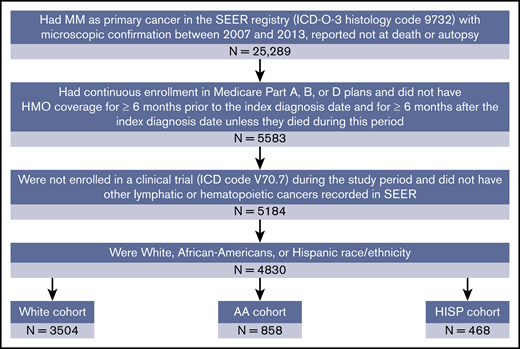
Sample selection. AA, African American; HISP, Hispanic; HMO, health maintenance organization; ICD, International Classification of Disease; ICD-O-3, International Classification of Diseases for Oncology, 3rd Edition.
Sample selection. AA, African American; HISP, Hispanic; HMO, health maintenance organization; ICD, International Classification of Disease; ICD-O-3, International Classification of Diseases for Oncology, 3rd Edition.
Study measures
Baseline characteristics
Patient demographics (age, sex, marital status, region of residence, and poverty indicator of the region of residence) and comorbidities were measured during the baseline period. The overall comorbidity burden during the baseline period was measured using the Charlson Comorbidity Index.22 Baseline health resource utilization was measured by the average number of visits per patient with all-cause inpatient, emergency department (ED), outpatient, and skilled nursing facility visits. Baseline health care costs, including medical and pharmacy costs, were also recorded.
Study outcomes
The use of novel therapy and ASCT and the frequency of all-cause ED visits and inpatient hospitalizations were evaluated. Novel therapies included lenalidomide, pomalidomide, bortezomib, and carfilzomib, all of which were approved by the US Food and Drug Administration before the end of 2014. These outcomes were measured from the index date until the end of continuous eligibility, end of data availability, or death, whichever occurred first. The periods from the index date to the initiation of novel therapy or ASCT, as well as from the index date to the first inpatient hospitalization or the first ED visit, were recorded.
OS and myeloma-specific survival (MSS; defined as the time to death caused by MM) were evaluated for each cohort from the index date to time of death or death caused by MM, respectively.
All-cause and MM-related health care costs were measured up to 1 year after the first MM diagnosis. The cost components included medical costs (inpatient, ED, outpatient, skilled nursing facility, and other medical services costs), pharmacy costs, and total health care costs. MM-related medical costs were defined as costs associated with a diagnosis code of MM. Costs were inflated to 2016 US dollars, using the annual medical care component of the Consumer Price Index.23
Statistical analyses
Baseline characteristics were compared between African American and white patients and between Hispanic and white patients, using Wilcoxon rank-sum tests for continuous variables and χ2 tests for categorical variables. Kaplan-Meier analyses were used to analyze time to event outcomes, including the time from the index date to novel therapy initiation, ASCT use, the first hospitalization, the first ED visit, death, and myeloma-specific death. In the analyses of time to novel therapy initiation, ASCT use, first hospitalization, and first ED visit, patients without an event were censored at the end of continuous eligibility, end of data availability, or death, whichever occurred first. In the OS analysis, patients without an event were censored on 31 December 2015 (when the death information was last updated). In the MSS analysis, patients without an event were censored on 31 December 2013 (when the myeloma-specific death information was last updated).
These time-to-event outcomes were compared between African American and white patients and between Hispanic and white patients, using log-rank tests. In addition, multivariable analyses were conducted for time-to-event outcomes, using Cox proportional hazard models.
Health care costs were compared between African American and white patients and between Hispanic and white patients, using Wilcoxon rank-sum tests and multivariable generalized linear models. All the multivariable models controlled for age, sex, marital status, geographic region, poverty indicator, index year, and comorbidities that were significantly different between groups at baseline.
Linear regression models were used to assess and compare the trend in novel treatment use within 6 months of the index MM diagnosis, ASCT use within 1 year of the index MM diagnosis, and OS across years 2007 to 2013 between African American and white patients and between Hispanic and white patients. The covariates in the models were race/ethnicity, year of MM diagnosis, and race/ethnicity by year interaction terms.
Results
Study population and baseline characteristics
The study included 4830 patients, comprising 3504 whites, 858 African Americans, and 468 Hispanics (Figure 1). The African American cohort was younger than the white cohort (mean age: 71.8 vs 75.8 years, respectively), consisted of fewer men (40.6% vs 52.3%) and married patients (25.8% vs 52.7%), and had a lower socioeconomic status (proportion in the top 10% income bracket: 15.2% vs 50.5%; all P < .001; Table 1). Similarly, the Hispanic cohort was also younger than the white cohort (mean age: 72.7 vs 75.8, respectively; P < .001), consisted of fewer married patients (46.6% vs 52.7%; P < .05), and had a lower socioeconomic status (proportion in the top 10% income bracket: 23.1% vs 50.5%; P < .001); however, the proportions of men in the 2 cohorts were comparable (Table 1). The mean Charlson Comorbidity Index was lower for whites (mean [standard deviation]: 2.2 [2.3]) compared with African Americans (3.2 [2.7]) and Hispanics (2.7 [2.4]; both P < .001; Table 1).
Patient characteristics at multiple myeloma diagnosis
| Characteristic | White (n = 3504) | AA (n = 858) | HISP (n = 468) | White vs AA, P | White vs HISP, P |
|---|---|---|---|---|---|
| Age, mean ± SD, y | 75.8 ± 8.4 | 71.8 ± 9.9 | 72.7 ± 8.7 | <.001* | <.001* |
| Sex, n (%) | |||||
| Male | 1834 (52.3) | 348 (40.6) | 245 (52.4) | <.001* | 1.00 |
| Marital status, n (%) | |||||
| Married | 1847 (52.7) | 221 (25.8) | 218 (46.6) | <.001* | <.05* |
| Region, n (%) | |||||
| Urban | 3405 (97.2) | 845 (98.5) | 467 (99.8) | <.05* | <.01* |
| Rural | 96 (2.7) | 12 (1.4) | 1 (0.2) | <.05* | <.01* |
| Unknown | 3 (0.1) | 1 (0.1) | 0 | 1.00 | 1.00 |
| Poverty indicator, n (%) | |||||
| 0% to <5% | 875 (25.0) | 51 (5.9) | 36 (7.7) | <.001* | <.001* |
| 5% to <10% | 893 (25.5) | 80 (9.3) | 72 (15.4) | <.001* | <.001* |
| 10% to <20% | 861 (24.6) | 200 (23.3) | 118 (25.2) | 0.47 | .81 |
| 20% to 100% | 496 (14.2) | 466 (54.3) | 150 (32.1) | <.001* | <.001* |
| Unknown | 379 (10.8) | 61 (7.1) | 92 (19.7) | <.01* | <.001* |
| Charlson Comorbidity Index, mean ± SD | 2.2 ± 2.3 | 3.2 ± 2.7 | 2.7 ± 2.4 | <.001* | <.001* |
| Comorbidities, n (%) | |||||
| Hypertension | 2526 (72.1) | 744 (86.7) | 367 (78.4) | <.001* | <.01* |
| Deficiency anemias | 1670 (47.7) | 503 (58.6) | 257 (54.9) | <.001* | <.01* |
| Infections | 1225 (35.0) | 302 (35.2) | 181 (38.7) | .93 | .13 |
| Diabetes, uncomplicated | 976 (27.9) | 379 (44.2) | 201 (42.9) | <.001* | <.001* |
| Chronic pulmonary disease | 790 (22.5) | 250 (29.1) | 107 (22.9) | <.001* | .92 |
| Renal failure | 716 (20.4) | 264 (30.8) | 125 (26.7) | <.001* | <.01* |
| Hypothyroidism | 748 (21.3) | 107 (12.5) | 95 (20.3) | <.001* | 0.65 |
| Fluid and electrolyte disorders | 612 (17.5) | 187 (21.8) | 94 (20.1) | <.01* | 0.18 |
| Congestive heart failure | 547 (15.6) | 212 (24.7) | 91 (19.4) | <.001* | <.05* |
| Peripheral vascular disorders | 554 (15.8) | 184 (21.4) | 79 (16.9) | <.001* | .60 |
| Valvular disease | 509 (14.5) | 116 (13.5) | 62 (13.2) | .48 | .50 |
| Solid tumor without metastasis | 491 (14.0) | 120 (14.0) | 62 (13.2) | 1.00 | .71 |
| Diabetes, complicated | 323 (9.2) | 168 (19.6) | 94 (20.1) | <.001* | <.001 |
| Other neurological disorders | 359 (10.2) | 99 (11.5) | 44 (9.4) | .30 | .63 |
Comorbidities listed have ≥10% prevalence in the sample.
SD, standard deviation.
P < .05.
Novel therapy and ASCT use
The median time from the index MM diagnosis date to novel therapy initiation was longer for the African American (5.2 months) and Hispanic (4.6 months) cohorts compared with the white cohort (2.7 months; both log-rank P < .05; Figure 2A). After adjusting for baseline characteristics including age, sex, marital status, geographic region, poverty indicator, index year, and comorbidities that were significantly different between groups at baseline, the rate of initiating novel therapy was still significantly higher among the white cohort vs the African American and Hispanic cohorts (adjusted hazard ratios [HRs]: African American vs white, 0.8; Hispanic vs white, 0.9; both P < .05). In addition, an increasing trend of novel therapy use within 6 months of MM diagnosis was observed for all 3 cohorts over time (P < .05). During the years 2007-2009, 44.2%, 44.7%, and 40.1% of white, African American, and Hispanic patients received novel MM therapy within 6 months of diagnosis (Figure 3A). By 2012 to 2013, these proportions had risen to 72.8%, 65.4%, and 62.7% (Figure 3A). This increasing trend was significantly more pronounced (ie, increased at a faster rate) in the white cohort compared with the African American cohort (P < .05), whereas the trend was similar for the Hispanic and white cohorts (P = .11; Figure 3A).
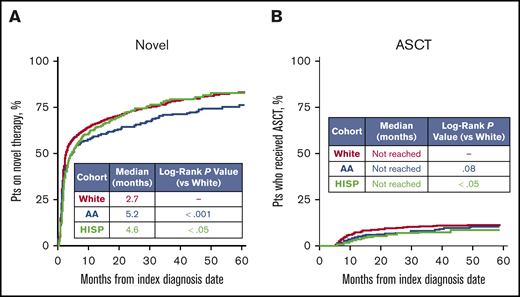
Comparison of time to novel therapy and ASCT initiation, using Kaplan-Meier analyses. (A) Time to novel therapy, where novel therapies included lenalidomide, pomalidomide, bortezomib, and carfilzomib. (B) Time to ASCT. Patients (pts) were censored if they reached the end of Medicare parts A, B, or D eligibility or data availability or death without event occurrence.
Comparison of time to novel therapy and ASCT initiation, using Kaplan-Meier analyses. (A) Time to novel therapy, where novel therapies included lenalidomide, pomalidomide, bortezomib, and carfilzomib. (B) Time to ASCT. Patients (pts) were censored if they reached the end of Medicare parts A, B, or D eligibility or data availability or death without event occurrence.

Trends in novel therapy use and ASCT among individual racial/ethnic cohorts across MM diagnosis years. (A) An increasing trend of novel therapy use was observed for all 3 cohorts over time (P < .05). A significant difference existed between whites vs AA (P < .05), but not whites vs HISP (P = .11). (B) There was an increasing trend in ASCT use among whites and African Americans (both P < .05), but not Hispanics (P = .42). No significant differences in ASCT use existed between whites vs AA (P = .82) or whites vs HISP (P = .13). The error bars represent standard errors.
Trends in novel therapy use and ASCT among individual racial/ethnic cohorts across MM diagnosis years. (A) An increasing trend of novel therapy use was observed for all 3 cohorts over time (P < .05). A significant difference existed between whites vs AA (P < .05), but not whites vs HISP (P = .11). (B) There was an increasing trend in ASCT use among whites and African Americans (both P < .05), but not Hispanics (P = .42). No significant differences in ASCT use existed between whites vs AA (P = .82) or whites vs HISP (P = .13). The error bars represent standard errors.
A total of 6.2% of all patients received an ASCT within 1 year of the index MM diagnosis (Figure 2B). The Hispanic cohort was less likely to receive an ASCT than the white cohort (1-year ASCT rate: 3.2% vs 6.9%, respectively; adjusted HR, 0.6; P < .05), whereas there was no significant difference in the likelihood for the African American and white cohorts (4.9% vs 6.9%), although the absolute proportion was smaller for the African American cohort. An increasing trend in the rate of ASCT use within 1 year of index diagnosis date was observed among whites (2007-2009: 3.6%; 2010-2011: 7.2%; 2012-2013: 9.7%; P < .05) and African Americans (2007-2009: 2.5%; 2010-2011: 2.2%; 2012-2013: 9.3%; P < .05), but not among Hispanics (2007-2009: 1.6%; 2010-2011: 6.1%; 2012-2013: 1.9%; P = .42; Figure 3B). No significant differences in the trend were observed between racial/ethnic groups.
Survival (OS and MSS)
The median OS was similar between the 3 cohorts, at 2.6 years among whites, 2.5 years among African Americans, and 2.8 years for Hispanics (log-rank P values: whites vs African Americans, 0.64; whites vs Hispanics, 0.27; Figure 4A). The median MSS was significantly longer for African Americans (5.4 years) than for whites (4.5 years; log-rank P < .05), and was comparable for Hispanics and whites (4.9 vs 4.5 years, respectively; log-rank P = .41; Figure 4B). After adjustment, the risk for death resulting from MM remained significantly lower for African Americans compared with whites (adjusted HR, 0.8; P < .05).

OS and MSS by racial/ethnic cohort using Kaplan-Meier analyses. For OS (A), patients were censored on 31 December 2015, when death information was last updated, and for MMS (B), patients were censored on 31 December 2013, when myeloma-specific death information was last updated.
OS and MSS by racial/ethnic cohort using Kaplan-Meier analyses. For OS (A), patients were censored on 31 December 2015, when death information was last updated, and for MMS (B), patients were censored on 31 December 2013, when myeloma-specific death information was last updated.
All-cause ED visits and inpatient hospitalizations
African American patients were observed to have a significantly higher risk for ED visits compared with white patients (3-month ED visit rate, 31.2% vs 23.8%, respectively; adjusted HR, 1.2; P < .01). In addition, although the risk for inpatient hospitalization was high in all 3 cohorts (3-month inpatient hospitalization rate: 60.0% for African Americans, 57.1% for Hispanics, and 56.0% for whites), no significant difference was observed across cohorts, despite some absolute differences noted.
All-cause and MM-related healthcare costs
The mean unadjusted all-cause total monthly costs were $12 462 among whites, $13 611 among African Americans, and $15 149 among Hispanics (Figure 5). The mean unadjusted all-cause medical monthly costs were $10 143, $11 546, and $12 657 among whites, African Americans, and Hispanics, respectively, and the mean unadjusted all-cause pharmacy monthly costs were $2318, $2066, and $2493, respectively (Figure 5). The mean unadjusted MM-related medical monthly costs were $4620 among whites, $4384 among African Americans, and $5568 among Hispanics (Figure 5).
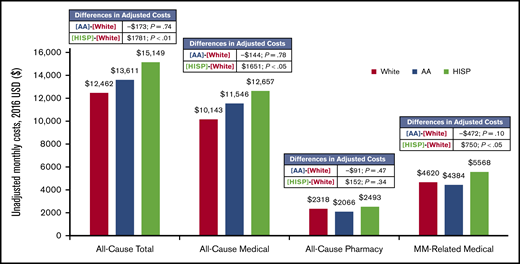
The mean adjusted all-cause inpatient, medical, and total monthly costs were significantly higher among Hispanic patients compared with white patients (adjusted differences per month: $1771 [P < .01], $1651 [P < .05], and $1781 [P < .01], respectively) and were comparable between African Americans and whites (adjusted differences per month: $73 [P = .88], −$144 [P = .78], and −$173 [P = .74], respectively; Figure 5).
Discussion
In the treatment of patients with MM, access to and rapid initiation of effective therapy is of paramount concern, and some racial disparities in treatment access or clinical outcomes have been previously reported, using older datasets with lesser representation of novel therapeutic agents.16,18,24 An assessment of the existence of such disparities using more recent data is therefore needed to identify any persistent unmet needs in this patient population, and also to observe whether there are any changes in trends of use and racial/ethnic disparities over time. To address this gap in the literature, the present study used more updated real-world data from the SEER-Medicare database (2007-2013 from SEER, 2007-2014 from Medicare) to examine treatment and outcome disparities among white, African American, and Hispanic patients with MM, and found several differences despite similar OS among the cohorts. On average, as compared with white patients, African Americans and Hispanics received novel therapies later after MM diagnosis, and Hispanic patients had the lowest rates of ASCT. Although the use of novel therapies was observed to have increased among all 3 cohorts over time, this increase was more pronounced among white patients compared with African American patients. The rate of ASCT within 1 year of MM diagnosis rose over time among white and African American patients, but not Hispanic patients. Finally, the all-cause and MM-related medical costs were higher among Hispanic patients because of higher hospitalization costs, and were similar among white and African American patients.
The overall increase in novel MM therapy use has also been reported in a SEER-Medicare data (2007-2009) analysis that previously examined lenalidomide, thalidomide, bortezomib, and ASCT use by racial/ethnic group.16 That study reported increasing use of novel therapy among all cohorts similar to the current analysis, as well as considerable variation in therapy use over time among the cohorts.16 However, the current study included carfilzomib and pomalidomide, which the previously reported analysis had not, and included a wider and more current SEER-Medicare data set (2007-2013). The present study also observed lower rates of ASCT use among Hispanics, similar to the prior analysis.16 Thus, we note persistence of some of the disparate trends despite the availability of a larger number of novel therapeutics for MM and updated guidelines recommending the use of these agents and ASCT.10,25
The median OS for whites (2.6 years), African Americans (2.5 years), and Hispanics (2.8 years) with MM observed in the present study were comparable, and no trends of OS over time were observed. These results are similar to those reported in a 2012 analysis of SEER data by Ailawadhi et al (OS, 2.6, 2.5, and 2.4 years for whites, African Americans, and Hispanics, respectively).18 That study also reported that MSS was longer among African Americans (3.8 years) vs whites (3.6 years) with MM,18 consistent with the present analysis (5.4 vs 4.5 years, respectively), although the magnitude of difference was greater in the current study. The present study used more recent SEER data than the previous study, encompassing years with novel therapies, which could explain why the presently observed median MSS is longer among these racial/ethnic cohorts. Another prior study in 2016 that used SEER-Medicare linked data (1991-2012) reported that there was no significant correlation between race/ethnicity and OS in more recent years (2006-2010), similar to the present analysis.24 A recent study by Costa et al analyzed OS among different racial/ethnic groups with MM using SEER data, and also noted that trends in the improvement of OS were universal for these groups overall, but differed when the age or sex of the patient was considered.26
Although all these analyses have shown improving OS and MSS trends for all the racial/ethnic groups, with the current analysis being the most updated one, the increase in disparity for MSS noted in this study points to multifactorial causes, potentially including health care access, utilization, and economic disparities, and possibly differences in disease severity and risk stratification, among others. Unfortunately, the SEER-Medicare database does not provide information to explore most of these causes that could have contributed to such disparities.
The current study delineated persistent racial disparities in novel therapy access and outcomes in real-world practice, some of which have even become more pronounced, as compared with prior analyses. As African American and Hispanic patients were observed to initiate novel therapy later after MM diagnosis than whites, attempts to introduce therapy earlier could potentially result in better clinical outcomes for these patients. In addition, earlier therapy may reduce health care costs for this group. Ailawadhi et al (2016) report that Hispanic patients with MM had the highest total health care costs within 6 months of MM diagnosis of any racial/ethnic group analyzed, similar to the current findings.24 In the present study, we included costs until 1 year after MM diagnosis and noted similar disparities. We also noted the specific cost drivers of these disparities, including inpatient hospitalizations, which may point toward other factors including comorbidities, differential adverse events to therapeutics, and even social support or lack thereof, which may necessitate care at a health care facility. However, there may be other reasons for the delayed initiation of therapy as well, such as biologic differences including disease aggressiveness. Future research is also warranted to further understand the cause of these disparities, as it is important to offer the best therapies and equal treatment access to all patients regardless of race. A recent study by Ailawadhi et al (2018) used clinical trial data to compare OS and progression-free survival among African American and white patients with MM treated with lenalidomide or pomalidomide.27 That study found that clinical outcomes for the groups were similar in 3 of the 4 trials (in 1 trial, African Americans had longer progression-free survival), further underscoring the need for equitable access to the best therapies for all patients with MM to maximize the clinical benefit across racial/ethnic subgroups. Similar findings were observed in a 2019 study comparing outcomes among white or African American patients diagnosed with MM in the US Veteran Administration’s Corporate Data Warehouse, where patients had equal access to health care at Veteran Affairs hospitals. The study noted that African American and white patients at least 65 years old at diagnosis, the same population as in the present study, had comparable median OS (3.69 vs 4.04 years, respectively; log-rank P = .63) and age-adjusted risk for death (HR, 1.05; P = .18).28 However, the study also found that when given equal access to treatment, African American patients younger than 5 years had superior median OS (7.07 vs 5.83 years, respectively; log-rank P < .001) and age-adjusted risk for death (HR, 0.86; P < .001). Furthermore, the representation of nonwhite and minority participants in trials of MM have been reported to be low (∼18%) and decreasing during the last decade.15 This presents a challenge for understanding the effect that race/ethnicity has on the disease, as well as treatment response in MM; thus, promoting more widespread representation may improve patient outcomes and access to appropriate therapies to help understand their true effect on current US population demographics.
The results of this study should be considered in light of several limitations. The SEER-Medicare database did not contain a clinical measure of disease severity or stage. MM has several subtypes that range in severity, which may introduce unmeasured bias; for example, a higher proportion of African Americans may have less severe clinical and genomic forms of MM.4,15 This may partially explain why, despite having unequal access to new therapies, the MSS of African Americans is still significantly longer than that of whites and the health care costs are comparable between the 2 cohorts. In addition, this study only included patients in the Medicare population (ie, aged ≥65 years), and use of ASCT may be lower in this population in comparison with the general population (∼9%),29 as fewer elderly patients are eligible for ASCT, despite increasingly older patients receiving ASCT for MM treatment.30 Thus, the results may not be generalizable to younger populations or those not covered by Medicare. This study did not capture more recently approved MM therapies (ie, those approved after the data cutoff of 2014 such as daratumumab, panobinostat, and ixazomib) because of the limitations of data availability. Lastly, there is a possibility of miscoding for some of the important variables, including race/ethnicity and diagnosis of comorbidities, given the nature of the observational databases.
In conclusion, this study observed significant variations in terms of the treatment patterns and economic outcomes among different racial/ethnic groups with MM, and some of these differences had magnified in comparison with prior analyses of such disparities. Although OS was similar across cohorts, African American and Hispanic patients received novel MM therapies later than white patients, and thus may not be reaping the full benefits from the introduction of these treatments. The use of novel therapies has increased over time, but the increase was more pronounced in whites than in African Americans. Although health care costs were similar between African Americans and whites with MM, Hispanic patients had higher total costs than whites, mainly driven by higher hospitalization costs. Addressing these disparities could lead to more equitable health care utilization and clinical benefit for all patients with MM, regardless of race/ethnicity, and address the trend of increasing differences in treatment access, health care costs, and outcomes between these groups.
The database (linked SEER-Medicare data) is proprietary, provided by the National Cancer Institute, but restrictions apply to the availability of these data, which were used under license for the current study, and so are not publicly available. Access to these data are available to other interested parties by contacting the National Cancer Institute (https://healthcaredelivery.cancer.gov/seermedicare/obtain/requests.html).
Acknowledgments
The manuscript was prepared by Shelley Batts, an employee of Analysis Group, Inc.
This study was supported by research funding from Celgene Corporation. The sponsors were involved in gathering, analyzing, and interpreting the data, and in the development of the manuscript.
Authorship
Contribution: All authors contributed to the writing and revision of the manuscript and collectively agreed to submit the study for publication.
Conflict-of-interest disclosure: S. Ailawadhi is a consultant for Celgene Corporation and has received honoraria from Takeda, Janssen, and Amgen and research funding from Pharmacyclics. K.P., S. Abouzaid, and Z.C. report employment with and stock ownership in Celgene Corporation. Z.Z., W.T., C.C., Z.-Y.Z., and J.X. are employees of Analysis Group, Inc., which has received consulting fees from Celgene Corporation.
Correspondence: Sikander Ailawadhi, Mayo Clinic Florida, 4500 San Pablo Rd, Jacksonville, FL 32224; e-mail: ailawadhi.sikander@mayo.edu.

