

Key Points
The immunosuppressive footprint of CLL on nonmalignant lymphocytes is more pronounced in the lymph node microenvironment.
Venetoclax combination treatment reduces immunosuppressive features of CLL, suggesting immune recovery after elimination of tumor cells.

Abstract
Morbidity and mortality due to immunosuppression remain among the foremost clinical challenges in chronic lymphocytic leukemia (CLL). Although immunosuppression is considered to originate within the lymph node (LN) microenvironment, alterations in T and natural killer (NK) cells have almost exclusively been studied in peripheral blood (PB). Whereas chemoimmunotherapy further deteriorates immune function, novel targeted agents like the B-cell lymphoma 2 inhibitor venetoclax potentially spare nonmalignant lymphocytes; however, the effects of venetoclax on nonleukemic cells have not been explored. We address these unresolved issues using a comprehensive analysis of nonmalignant lymphocytes in paired LN and PB samples from untreated CLL patients, and by analyzing the effects of venetoclax-based treatment regimens on the immune system in PB samples from previously untreated and relapsed/refractory patients. CLL-derived LNs contained twice the amount of suppressive regulatory T cells (Tregs) and CLL supportive follicular T helper (Tfh) cells compared with PB. This was accompanied by a low frequency of cytotoxic lymphocytes. The expression of PD-1 by CD8+ T cells was significantly higher in LN compared with PB. Venetoclax-based treatment led to deep responses in the majority of patients, but also to decreased absolute numbers of B, T, and NK cells. Tfh cell, Treg, and PD-1+ CD8+ T cell numbers were reduced more than fivefold after venetoclax-based therapy, and overproduction of inflammatory cytokines was reduced. Furthermore, we observed restoration of NK cell function. These data support the notion that the immunosuppressive state in CLL is more prominent within the LN. Venetoclax-based regimens reduced the immunosuppressive footprint of CLL, suggesting immune recovery after the elimination of leukemic cells.
Introduction
Chronic lymphocytic leukemia (CLL) is accompanied by considerable immunosuppression, which results in an increased risk for infections and secondary malignancies.1,2 Immune disruptions are thought to arise from interactions between CLL cells and the immune system. These interactions provide a supportive microenvironment for CLL cells and allow escape from immunosurveillance.1-3 CLL cells actively shape a supportive immune environment that results in progressive abnormalities in the myeloid, T, and natural killer (NK) cell compartment of CLL patients.3,4 One result of such T-cell alterations is the elevation of CD4+ and CD8+ T-cell numbers, resulting in a decreased CD4/CD8 ratio.5 CD4+ T cells are skewed toward a T helper 2 (TH2) cell profile and are considered to support CLL cells via cytokines, chemokines, and membrane-bound factors.6-8 Regulatory CD4+ T cells (Tregs) suppress cellular immune responses and experimental evidence,9,10 as well as the observation that Treg expansion is more prominent in patients with higher CLL loads,11,12 indicates that CLL cells actively recruit Tregs. Although CD8+ T cells of CLL patients produce high levels of interferon-γ (IFN-γ) and tumor necrosis factor-α, the overexpression of inhibitory molecules, such as PD-1, is associated with reduced proliferative capacity and cytotoxicity.13-16 NK cell functionality is also impaired in CLL, particularly with regard to degranulation and cytotoxicity.17,18
Similar to other B-cell lymphomas, such as follicular lymphoma, the lymph node (LN) microenvironment in CLL is thought to be the predominant site of interaction between the malignant cells and tumor-associated and tumor-specific immune cells.19 However, data on immune abnormalities in CLL patients are primarily obtained from peripheral blood (PB) studies, and little is known about the composition of nonmalignant lymphocytes in LN tissue or how this relates to PB.
Chemoimmunotherapy (especially bendamustine and fludarabine) has detrimental effects on the number and function of T cells, further compromising immune function in CLL patients.20,21 Although experience so far indicates that most novel targeted therapeutic strategies do not have such unfavorable effects on T cells, targeted agents may also influence the immune system of CLL patients.22 The Bruton tyrosine kinase (BTK) inhibitor ibrutinib alters T, NK, and myeloid cell function, which may result, in part, from off-target inhibition of other kinases, such as interleukin-2 (IL-2)–inducible T-cell kinase.23-26 However, some of these T-cell alterations have also been observed in patients treated with the more selective BTK inhibitor acalabrutinib, which does not inhibit inducible T-cell kinase, implying that on-target effects via the eradication of CLL cells also eventually affect the nonmalignant immune system.27
Venetoclax, an inhibitor of the antiapoptotic protein B-cell lymphoma 2 (Bcl-2), is highly effective in CLL, even as monotherapy.28 High rates of minimal residual disease (MRD) negativity and low rates of progression are observed with venetoclax treatment in combination with anti-CD20 monoclonal antibodies, such as obinutuzumab.29-32 The effects of venetoclax on nonmalignant lymphocytes have not been investigated in patient samples. Although CLL cells rely heavily on Bcl-2 for their survival, other leukocytes also depend on Bcl-2 to varying degrees and, thus, may be affected by venetoclax-based treatment.33,34
Understanding the effects of novel treatment regimens on the immune system is particularly important considering the fact that infections remain a leading cause of morbidity and mortality in CLL.35,36 In addition, knowledge about how venetoclax impacts lymphocytes may be valuable in designing future combination strategies and shed light on possible risks associated with long-term treatment. Eradication of the malignant clone potentially allows recovery of immune responses and, thus, immunosurveillance.
To characterize the immunosuppressive footprint of CLL, we first studied the immune composition of the PB and LN compartments in untreated progressive CLL patients. We found increased numbers of tumor-supporting lymphocyte subsets and decreased numbers of cytotoxic lymphocyte subsets in the LN compared with PB, indicating an immunosuppressive environment within the LN tissue. Second, we analyzed the effect of venetoclax-based treatment on the phenotype and function of nonmalignant lymphocytes in 2 trial cohorts. Venetoclax-based treatment led to significant reductions in characteristic immunosuppressive features of CLL but did not affect the functionality of T and NK cells, suggestive of immune recovery after venetoclax-based treatment.
Methods
Patient material
PB and fine-needle LN biopsies were collected from CLL patients in 2 phase 2 clinical trials performed by the Dutch-Belgian Cooperative Trial Group for Hematology Oncology (HOVON): the HOVON139 trial (Netherlands Trial Registry ID: NTR6043) and the HOVON141 trial (Netherlands Trial Registry ID: NTR6249). Healthy control (HC) PB and LN samples were collected from patients undergoing renal transplantation, as described previously.37 During sample collection, HCs had received no immunosuppressive medication other than 1 administration of anti-CD25 monoclonal antibody. For an overview of donor charactersitics see Table 1. The studies were approved by the medical ethics committee at the Amsterdam UMC. Written informed consent from all subjects was obtained in accordance with the Declaration of Helsinki.
Patient characteristics
| HCs | HOVON139 baseline PB | HOVON139 baseline LN | HOVON139 1-y PB | HOVON141 baseline PB | HOVON141 1-y PB | |
|---|---|---|---|---|---|---|
| N | 10 | 41 | 28 | 11 | 10 | 10 |
| Males, % | 50 | 75.7 | 80.8 | 81.8 | 30.0 | 30.0 |
| Age, y | 63 (45-78) | 71 (57-80) | 71 (57-79) | 71.5 (60-78) | 68 (52-76) | 68 (52-76) |
| CMV positive, % | 83 | 41 | 48 | 64 | Not known | Not known |
| ALC, ×109/L | Not known | 98.6 (3.5-420.7) | 97.3 (18.0-399.0) | 4.8 (2.8-9.9) | 129.8 (20.0-248.9) | 4.8 (3.9-7.6) |
| TTFT, mo | N/A | 28.2 (0.7-244.6) | 28.1 (0.7-244.6) | 18.9 (1.7-244.6) | Not known | Not known |
| Prior treatment, n | N/A | N/A | N/A | N/A | 1 (1-3) | 1 (1-3) |
| Prior chemotherapy, % | N/A | N/A | N/A | N/A | 100 | 100 |
| TTT, mo | N/A | N/A | N/A | N/A | 42.8 (13.8-141.8) | 42.8 (13.8-141.8) |
| Rai stage III-IV, % | N/A | 57.1 | 44.0 | 36.4 | 80 | 80 |
| IgVH status U-CLL, % | N/A | 55.9 | 55.6 | 27.3 | 40 | 40 |
Unless otherwise noted, data are median (range).
ALC, absolute leukocyte count; CMV, cytomegalovirus; N/A, not applicable; TTFT, time to first treatment; TTT, time from last treatment to current treatment; U-CLL, CLL with unmutated immunoglobulin heavy chains.
Study design
Previously untreated CLL patients were enrolled in the HOVON139 GIVE trial (NTR6043).30 The treatment regimen consisted of preinduction with obinutuzumab (3000 mg in cycle 1 and 1000 mg in cycle 2), induction with combined venetoclax (ramp up to 400 mg) and obinutuzumab (1000 mg; cycles 3-8), and venetoclax monotherapy (400 mg; cycles 9-14 or longer).
PB mononuclear cells (PBMCs) were collected before the start of the trial, as well as after cycle 2 and after cycle 14 (or ∼1 year) of treatment, and were used directly or cryopreserved as described earlier.38 Core LN biopsies were collected at baseline and used directly.
Patients with relapsed or refractory CLL were enrolled in the HOVON141 Vision trial (NTR6249). The treatment regimen consisted of ibrutinib monotherapy (420 mg days 1-28; cycle 1 and 2), followed by combined venetoclax (ramp up to 400 mg) and ibrutinib (420 mg; cycles 3-15).
PBMCs were collected before the start of the trial, as well as after cycle 2 and after cycle 14 (or ∼1 year) of treatment, and cryopreserved. The second time point was chosen to match the number of venetoclax cycles received in the HOVON139 trial.
Lymphocyte phenotyping
Cells were incubated with monoclonal antibodies for surface staining for 20 minutes at 4°C. Monoclonal antibodies used are listed in supplemental Table 1. Cells were then washed, fixed, and stained intracellularly for 30 minutes at 4°C using a Foxp3/Transcription Factor Staining Buffer Set (Thermo Fisher Scientific, Waltham, MA). Reference values are derived from the Netherlands Society for Clinical Chemistry and Laboratory Medicine.
Lymphocyte activation
Cells were stimulated with phorbol myristate acetate (PMA; 10 ng/mL) and ionomycin (1 µg/mL) for 4 hours in the presence of Brefeldin A (10 µg/mL; all from Sigma-Aldrich, St. Louis, MO), GolgiStop (BD Biosciences, Franklin Lakes, NJ), and CD107a FITC (Thermo Fisher Scientific). Cells were washed, and surface staining was performed as described above. Fixation and intracellular staining were performed using a BD Cytofix/Cytoperm Fixation/Permeabilization Solution kit (BD Biosciences).
Flow cytometry
Samples were measured on a BD FACSCanto II or a BD LSRFortessa cytometer (both from BD Biosciences). Samples were analyzed with FlowJo v10.
Statistical analyses
Data were checked for normality with the D’Agostino-Pearson normality test and analyzed using a Wilcoxon matched-pairs signed-rank test, 1-way analysis of variance (ANOVA), or Pearson correlation analysis. Statistical analyses were performed with GraphPad Prism v7.
Results
Fewer cytotoxic T and NK cells in the LN than in the PB
We compared lymphocyte composition between the LN and PB from previously untreated CLL patients and from HCs (gating strategy is shown in supplemental Figure 1).
The percentage of CLL cells was lower in the LN than in the PB (92.3% of lymphocytes in PB vs 82.8% in LN), because relative T-cell numbers were increased in the LN of CLL patients (5.1% in PB vs 13.2% in LN; Figure 1A-B). On the other hand, T cells were less frequent in the LN than in the PB (52.7% vs 75.12%, respectively) in HCs.
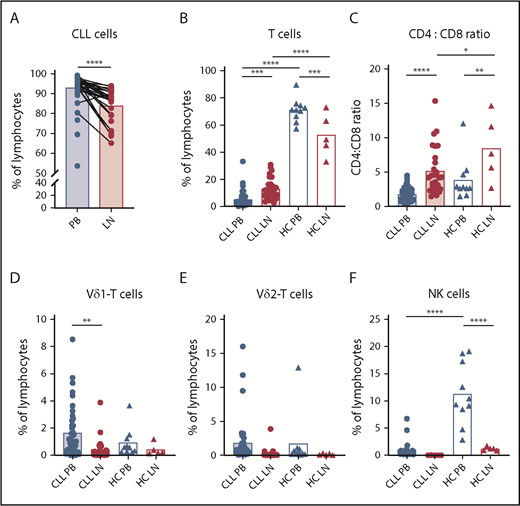
Few cytotoxic lymphocytes in the LN of CLL patients. Lymphocyte analysis in PB and LN samples from untreated CLL patients (PB, n = 42; LN, n = 28) and HCs (PB, n = 10; LN, n = 5) by flow cytometry. Percentage of CLL (CD5+CD19+) cells (A) and T (CD3+) cells (B) within lymphocytes. (C) Ratio of CD4+/CD8+ T cells. Percentage of Vδ1+ cells (D) and Vδ2+ cells (E) within T cells. (F) Percentage of NK (CD56bright and CD16+) cells within lymphocytes (CLL PB, n = 21; CLL LN, n = 5). Data are presented as mean (bar) and individual patients (circles and triangles). *P < .05, **P < .01, ***P < .001, ****P <. 0001, Wilcoxon matched-pairs signed-rank test (A), 1-way ANOVA followed by Sidak’s multiple-comparisons test (B-F).
Few cytotoxic lymphocytes in the LN of CLL patients. Lymphocyte analysis in PB and LN samples from untreated CLL patients (PB, n = 42; LN, n = 28) and HCs (PB, n = 10; LN, n = 5) by flow cytometry. Percentage of CLL (CD5+CD19+) cells (A) and T (CD3+) cells (B) within lymphocytes. (C) Ratio of CD4+/CD8+ T cells. Percentage of Vδ1+ cells (D) and Vδ2+ cells (E) within T cells. (F) Percentage of NK (CD56bright and CD16+) cells within lymphocytes (CLL PB, n = 21; CLL LN, n = 5). Data are presented as mean (bar) and individual patients (circles and triangles). *P < .05, **P < .01, ***P < .001, ****P <. 0001, Wilcoxon matched-pairs signed-rank test (A), 1-way ANOVA followed by Sidak’s multiple-comparisons test (B-F).
In CLL patients and HCs, the T-cell population in the LN is dominated by CD4+ T cells at the expense of CD8+ T cells (Figure 1C). In addition to (αβ) CD8+ T cells, Vδ1 and Vδ2 T cells are the most common T-cell populations with antitumor properties.39 In contrast to αβ T cells, Vδ1 and Vδ2 T-cell frequencies were more than fourfold lower in the LN than in the PB in CLL patients (Figure 1D-E).
The proportion of NK cells in the LN was significantly lower compared with the PB in CLL patients and HCs (Figure 1F). Within the NK cell compartment, CD56dim cells with a cytotoxic potential are distinguished from CD56bright cells that have a higher proliferative and cytokine-producing capacity.40 In patients with CLL and HCs, the majority (>90%) of PB NK cells were CD56dim NK cells (supplemental Figure 2A-C). CD56bright NK cells made up a minority of the NK cells in the PB but a considerable fraction (∼83%) of the LN NK cells, although this was less pronounced (∼56%) in CLL patients than in HCs.
Thus, within the LN, CLL cells are accompanied primarily by CD4+ T cells and relatively few (cytotoxic) T and NK cells.
Immunosuppressive T-cell composition in CLL LN
Next, we investigated the subset distribution of T cells in the LN. CD4+ T cells can differentiate into follicular T helper (Tfh) cells that provide support to healthy B cells, and are similarly instrumental for CLL cell support.7,41 LNs of CLL patients and HCs contained 3 times more Tfh cells compared with the PB (Figure 2A). We could not replicate previous reports of elevated Tfh cell numbers in the PB of CLL patients with advanced disease.42

CLL cells reside in an immunosuppressive context in the LN. Lymphocyte analysis in PB and LN samples from untreated CLL patients (PB, n = 42; LN, n = 28) and HCs (PB, n = 10; LN, n = 5) by flow cytometry. Percentage of Tfh (CXCR5+PD-1+) cells (A) and Tregs (CD25+FoxP3+) (B) within CD4+ T cells. (C) Correlation between the percentage of Tregs of CD4+ T cells in the CLL LN and the absolute leukocyte count (ALC). (D) Percentage of PD-1+ cells within CD8+ T cells. ***P < .001, ****P < .0001, 1-way ANOVA followed by Sidak’s multiple-comparisons test (A-B,D), Pearson correlation analysis (C).
CLL cells reside in an immunosuppressive context in the LN. Lymphocyte analysis in PB and LN samples from untreated CLL patients (PB, n = 42; LN, n = 28) and HCs (PB, n = 10; LN, n = 5) by flow cytometry. Percentage of Tfh (CXCR5+PD-1+) cells (A) and Tregs (CD25+FoxP3+) (B) within CD4+ T cells. (C) Correlation between the percentage of Tregs of CD4+ T cells in the CLL LN and the absolute leukocyte count (ALC). (D) Percentage of PD-1+ cells within CD8+ T cells. ***P < .001, ****P < .0001, 1-way ANOVA followed by Sidak’s multiple-comparisons test (A-B,D), Pearson correlation analysis (C).
CLL cells have been reported to promote Treg differentiation.9,10,12 Tregs were more frequent in the LN than in the PB of CLL patients (6.8% of CD4+ T cells in PB vs 11.5% in LN), whereas in HCs, Tregs were more prevalent in PB than in the LN (5.9% in PB vs 1.8% in LN; Figure 2B). The percentage of Tregs in the LN correlated positively with the absolute leukocyte count in the PB of CLL patients (Figure 2C).
CD4+ and CD8+ T cells can be subdivided into naive T cells, central memory T cells, effector memory T cells, and RA-expressing effector memory T cells based on CD27 and CD45RA expression.43 Although the differentiation status of CD4+ T cells did not differ between LN and PB in CLL patients and HCs, the CD8+ compartment in CLL patients consisted of a larger proportion of central memory T cells in the LN in comparison with the PB (37.2% of CD8+ T cells in PB vs 60% in LN; supplemental Figure 2D-E). RA-expressing effector memory T cells were less prevalent in the LN than in the PB in CLL patients (fivefold difference) and HCs (threefold difference; supplemental Figure 2F-G). An important mechanism for negatively regulating the function of CLL CD8+ T cells is through inhibitory molecules, such as PD-1.15 Significantly more CD8+ T cells expressed PD-1 in the LN (30.4%) than in the PB (12.4%) of CLL patients (Figure 2D).
In conclusion, the CLL LN shows increased frequencies of tumor-supportive Tfh cells and Tregs compared with the PB. Furthermore, there is a lower frequency of effector CD8+ T cells and a higher PD-1 expression on remaining CD8+ T cells in the CLL LN.
Reduced numbers of nonmalignant lymphocyte subsets after venetoclax and obinutuzumab treatment
To determine the effects of venetoclax treatment on nonmalignant lymphocytes, we studied paired PB samples obtained at baseline, after 2 months of preinduction with obinutuzumab, and at 1 year of treatment with venetoclax-obinutuzumab.
CLL cells were largely eliminated after 1 year of treatment (mean percentage within lymphocytes decreased from 93.0% ± 4.5% to 0.1% ± 0.2%; supplemental Figure 3A). The frequency of CLL cells presented is not derived from the simultaneously performed flow cytometry-based MRD analysis and likely overestimates the amount of CLL cells present as a result of less stringent criteria. MRD analysis during the trial demonstrated that, at this time point, 10 of these 11 patients had undetectable MRD (<10E−4), and the remaining patient was MRD intermediate-positive (>10E−4 and <10E−2), in line with our published interim analysis (MRD-intermediate-positive, 7.1%; MRD undetectable, 92.9%; n = 28).30
We evaluated the absolute numbers of normal B, T, and NK cells after venetoclax-obinutuzumab treatment. The relative and absolute numbers of healthy B cells decreased after preinduction with obinutuzumab (Figure 3A; supplemental Figure 3A). Absolute T-cell numbers were elevated in the majority of patients at baseline and after 2 months of treatment (mean T-cell number at baseline, 3.4 × 10⁹/L ± 2.6 × 10⁹/L; reference values, 0.7 × 10⁹/L to 2.1 × 10⁹/L). After 1 year of venetoclax-based treatment, the absolute number of CD4+ T cells (0.5 × 10⁹/L ± 0.2 × 10⁹/L; reference values, 0.3 × 10⁹/L to 1.4 × 10⁹/L) and CD8+ T cells (0.2 × 10⁹/L ± 0.1 × 10⁹/L; reference values, 0.2 × 10⁹/L to 0.9 × 10⁹/L) decreased (Figure 3B). The CD4/CD8 ratio and differentiation status of T cells did not change during therapy, indicating that T-cell reduction occurred across all subsets in CD4+ and CD8+ T cells (supplemental Figure 3B-D), as well as that not all immune disturbances in CLL, like skewing of T-cell subsets, are restored after 1 year of venetoclax-based therapy. Unlike αβ T cells, the absolute number of Vδ1 and Vδ2 T cells remained stable during treatment (supplemental Figure 3E-H).
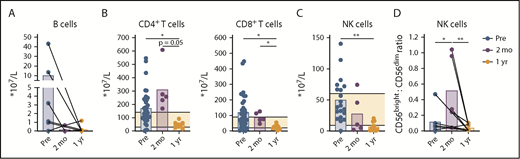
Depletion of nonmalignant lymphocytes during venetoclax-obinutuzumab treatment. Lymphocyte analysis in PB of patients at baseline (n = 36), after preinduction with obinutuzumab (n = 5), and after 1 year of treatment with venetoclax-obinutuzumab (n = 11) by flow cytometry. Absolute number of B cells (A) and CD4+ and CD8+ T cells (B) in PB. (C) Absolute number of NK (CD56bright and CD16+) cells in PB (baseline, n = 20). (D) Ratio of CD56bright (CD56brightCD16−)/CD56dim (CD56dimCD16+) cells (baseline, n = 6). Horizontal lines indicate reference values. *P < .05, **P < .01, 1-way ANOVA followed by Sidak’s multiple-comparisons test.
Depletion of nonmalignant lymphocytes during venetoclax-obinutuzumab treatment. Lymphocyte analysis in PB of patients at baseline (n = 36), after preinduction with obinutuzumab (n = 5), and after 1 year of treatment with venetoclax-obinutuzumab (n = 11) by flow cytometry. Absolute number of B cells (A) and CD4+ and CD8+ T cells (B) in PB. (C) Absolute number of NK (CD56bright and CD16+) cells in PB (baseline, n = 20). (D) Ratio of CD56bright (CD56brightCD16−)/CD56dim (CD56dimCD16+) cells (baseline, n = 6). Horizontal lines indicate reference values. *P < .05, **P < .01, 1-way ANOVA followed by Sidak’s multiple-comparisons test.
The relative number of NK cells increased (from 0.7% to 8.0%; supplemental Figure 3A), but the absolute number of NK cells decreased, during treatment (from 0.5 × 10⁹/L ± 0.3 × 10⁹/L to 0.07 × 10⁹/L ± 0.07 × 10⁹/L; reference values, 0.09 × 10⁹/L to 0.6 × 10⁹/L; Figure 3C). The CD56bright/CD56dim ratio increased after preinduction with obinutuzumab, perhaps as a result of the loss of CD56dim cells via activation-induced cell death, which is associated with obinutuzumab treatment (Figure 3D; supplemental Figure 3I).44 After 1 year of venetoclax-based treatment, the CD56bright/CD56dim ratio recovered to the same range as baseline.
Taken together, combined treatment with venetoclax and obinutuzumab led to depletion of CLL cells and to a greater than threefold reductions in healthy B cells, T cells, and NK cells.
Tumor-supportive T-cell subsets decline during venetoclax-obinutuzumab treatment
We next investigated the phenotypical and functional differences of nonmalignant lymphocytes after venetoclax-obinutuzumab treatment. The frequencies of Tfh cells, Tregs, and PD-1+ CD8+ T cells significantly decreased approximately sevenfold after venetoclax-based therapy, which is indicative of a reversal in the CLL immune signature (Figure 4A-C). None of these changes were apparent after obinutuzumab preinduction. Lymphocyte function before and after venetoclax-obinutuzumab was investigated by measuring immunoglobulin G (IgG) levels in plasma and by stimulating PBMCs with PMA/ionomycin.
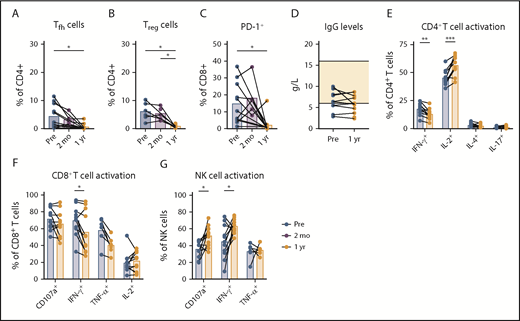
Tumor-submissive T-cell subsets decrease during venetoclax-obinutuzumab treatment. Lymphocyte analysis in PB of patients at baseline (n = 11), after preinduction with obinutuzumab (n = 5), and after 1 year of treatment with venetoclax-obinutuzumab (n = 11) by flow cytometry. Percentage of Tfh (CXCR5+PD-1+) cells (A) and Tregs (CD25+FoxP3+) (B) within CD4+ T cells. (C) Percentage of PD-1+ cells within CD8+ T cells. (D) IgG levels in plasma at baseline and after 1 year of venetoclax-obinutuzumab treatment. (E) Cytokine production by CD4+ T cells after stimulation of PBMCs with PMA/ionomycin for 4 hours. Cytokine production and CD107a expression by CD8+ T cells (F) and NK cells (G) after stimulation of PBMCs with PMA/ionomycin for 4 hours. *P < .05, **P < .01, ***P < .001, 1-way ANOVA followed by Sidak’s multiple-comparisons test.
Tumor-submissive T-cell subsets decrease during venetoclax-obinutuzumab treatment. Lymphocyte analysis in PB of patients at baseline (n = 11), after preinduction with obinutuzumab (n = 5), and after 1 year of treatment with venetoclax-obinutuzumab (n = 11) by flow cytometry. Percentage of Tfh (CXCR5+PD-1+) cells (A) and Tregs (CD25+FoxP3+) (B) within CD4+ T cells. (C) Percentage of PD-1+ cells within CD8+ T cells. (D) IgG levels in plasma at baseline and after 1 year of venetoclax-obinutuzumab treatment. (E) Cytokine production by CD4+ T cells after stimulation of PBMCs with PMA/ionomycin for 4 hours. Cytokine production and CD107a expression by CD8+ T cells (F) and NK cells (G) after stimulation of PBMCs with PMA/ionomycin for 4 hours. *P < .05, **P < .01, ***P < .001, 1-way ANOVA followed by Sidak’s multiple-comparisons test.
Plasma IgG levels were low at baseline and did not increase after 1 year of treatment, in line with the low numbers of healthy B cells (mean IgG concentration after treatment, 5.8 g/L; reference values, 6-16 g/L; Figure 4D). Changes in TH1 cell cytokine production were ambiguous, because CD4+ T cells produced significantly less IFN-γ, but IL-2 production increased, after PMA/ionomycin stimulation (Figure 4E). CD4+ T cells produced only low levels of the TH2 cell cytokine IL-4, which did not change after therapy (Figure 4E). CD8+ T cells from untreated CLL patients show increased production of effector-type cytokines.16 Venetoclax-obinutuzumab treatment resulted in a significantly decreased production of IFN-γ and a trend toward lower tumor necrosis factor-α production by CD8+ T cells (Figure 4F). In contrast to CD8+ T cells, NK cell cytokine production and degranulation are impaired in untreated CLL patients.17,18 Following venetoclax-obinutuzumab treatment, degranulation, as well as IFN-γ production, of NK cells improved significantly (Figure 4G).
Together, these data demonstrate a decrease in immunosuppressive T-cell subsets, as well as restoration of T-cell and NK cell function, but not IgG production, after venetoclax-obinutuzumab treatment.
Reduction in nonmalignant lymphocytes when venetoclax is combined with ibrutinib
Current clinical studies investigate the combination of venetoclax with anti-CD20 antibodies, as well as with the BTK inhibitor ibrutinib.45 We studied nonmalignant lymphocyte populations in paired samples from patients at baseline, after ibrutinib preinduction, and after ∼1 year of venetoclax-ibrutinib treatment. Of note, all samples were obtained from patients who had received prior (chemotherapy-based) treatment.
Although the CLL load decreased significantly after venetoclax-ibrutinib treatment, CLL cells were still present in the PBMC fraction of most patients (mean percentage of lymphocytes, 95.2 ± 2.4 vs 8.2 ± 12.9; supplemental Figure 5A), and 45% of patients remained MRD positive at this time point in the trial cohort.
Low healthy B-cell numbers persist during ibrutinib monotherapy, especially in patients with relapsed or refractory disease.46 Also in our cohort, the percentage and absolute numbers of healthy B cells were low at baseline and decreased after 1 year of venetoclax-ibrutinib treatment (from 8.8 × 10⁷/L ± 6.2 × 10⁷/L to 0.1 × 10⁶/L ± 0.03 × 10⁶/L; Figure 5A; supplemental Figure 5A).

Depletion of nonmalignant lymphocytes when venetoclax is combined with ibrutinib. Lymphocyte analysis in PB of patients at baseline, after preinduction with ibrutinib, and after 1 year of treatment with venetoclax-ibrutinib (n = 10) by flow cytometry. Absolute number of B cells (A) and CD4+ and CD8+ T cells (B) in PB. (C) Absolute number of NK (CD56bright and CD16+) cells in PB. (D) Ratio of CD56bright (CD56brightCD16−) cells vs CD56dim (CD56dimCD16+) cells. Horizontal lines indicate reference values. *P < .05, **P < .01, 1-way ANOVA followed by Sidak’s multiple-comparisons test.
Depletion of nonmalignant lymphocytes when venetoclax is combined with ibrutinib. Lymphocyte analysis in PB of patients at baseline, after preinduction with ibrutinib, and after 1 year of treatment with venetoclax-ibrutinib (n = 10) by flow cytometry. Absolute number of B cells (A) and CD4+ and CD8+ T cells (B) in PB. (C) Absolute number of NK (CD56bright and CD16+) cells in PB. (D) Ratio of CD56bright (CD56brightCD16−) cells vs CD56dim (CD56dimCD16+) cells. Horizontal lines indicate reference values. *P < .05, **P < .01, 1-way ANOVA followed by Sidak’s multiple-comparisons test.
The majority (∼80%) of remaining lymphocytes in the PB following venetoclax-ibrutinib treatment were T cells and NK cells (supplemental Figure 5A). The baseline T-cell count in these previously treated patients was above the reference range in 5 of 10 patients (2.5 × 10⁹/L ± 1.3 × 10⁹/L). The absolute numbers of CD4+ and CD8+ T cells decreased significantly (approximately twofold) during venetoclax-ibrutinib treatment, but they stayed within reference values in most patients (Figure 5B). The decline was equal across T-cell subsets, because the CD4/CD8 ratio and the differentiation status of T cells did not change after treatment (supplemental Figure 5B-D). Only Vδ2 T-cell numbers remained stable after venetoclax-ibrutinib treatment (supplemental Figure 5E-H). The decrease in T-cell numbers was not observed after ibrutinib preinduction.
Similar to the T-cell compartment, the absolute number of NK cells was reduced upon 1 year of venetoclax-ibrutinib treatment (from 37.6 × 10⁷/L ± 25.7 × 10⁹/L to 15.7 × 10⁷/L ± 10.1 × 10⁷/L; Figure 5C). The CD56bright/CD56dim ratio decreased almost 10-fold, indicating that CD56bright cells were more susceptible to treatment-induced cellular loss (Figure 5D; supplemental Figure 5I-J). Other than in 1 patient, the CD56bright/CD56dim ratio remained stable after preinduction with ibrutinib, indicating that the treatment-induced cell loss was caused by prolonged venetoclax-ibrutinib therapy.
In conclusion, the loss of healthy B, T, and NK cells is observed when venetoclax is used in combination with obinutuzumab or with ibrutinib.
Fewer Tfh cells, Tregs, and PD-1+ CD8+ T cells after treatment with venetoclax and ibrutinib
The frequencies of Tfh cells, Tregs, and PD-1+ CD8+ T cells were reduced significantly after venetoclax-ibrutinib treatment, similar to our observations in the venetoclax-obinutuzumab cohort (Figure 6A-C). The frequency of Tregs and PD-1+ CD8+ T cells trended downward during ibrutinib preinduction, but Tfh cell numbers were significantly affected by ibrutinib monotherapy, in line with recent reports on the effects of ibrutinib on Tfh cells.47,48
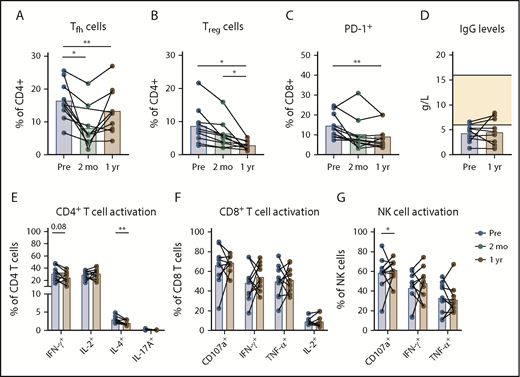
Fewer Tregsand PD-1+CD8+T cells after treatment with venetoclax-ibrutinib. Lymphocyte analysis in PB of patients at baseline, after preinduction with ibrutinib, and after 1 year of treatment with venetoclax-ibrutinib (n = 10) by flow cytometry. Percentage of Tfh (CXCR5+PD-1+) cells (A) and Tregs (CD25+FoxP3+) (B) within CD4+ T cells. (C) Percentage of PD-1+ cells within CD8+ T cells. (D) IgG levels in plasma at baseline and after 1 year of venetoclax-ibrutinib. (E) Cytokine production by CD4+ T cells after stimulation of PBMCs with PMA/ionomycin for 4 hours. Cytokine production and CD107a expression by CD8+ T cells (F) and NK cells (G) after stimulation of PBMCs with PMA/ionomycin for 4 hours. *P < .05, **P < .01, 1-way ANOVA followed by Sidak’s multiple-comparisons test.
Fewer Tregsand PD-1+CD8+T cells after treatment with venetoclax-ibrutinib. Lymphocyte analysis in PB of patients at baseline, after preinduction with ibrutinib, and after 1 year of treatment with venetoclax-ibrutinib (n = 10) by flow cytometry. Percentage of Tfh (CXCR5+PD-1+) cells (A) and Tregs (CD25+FoxP3+) (B) within CD4+ T cells. (C) Percentage of PD-1+ cells within CD8+ T cells. (D) IgG levels in plasma at baseline and after 1 year of venetoclax-ibrutinib. (E) Cytokine production by CD4+ T cells after stimulation of PBMCs with PMA/ionomycin for 4 hours. Cytokine production and CD107a expression by CD8+ T cells (F) and NK cells (G) after stimulation of PBMCs with PMA/ionomycin for 4 hours. *P < .05, **P < .01, 1-way ANOVA followed by Sidak’s multiple-comparisons test.
In accordance with low healthy B-cell numbers, plasma IgG levels did not increase after 1 year of venetoclax-ibrutinib treatment (Figure 6D). Treatment with venetoclax-ibrutinib led to significantly reduced IL-4 production by CD4+ T cells, in line with previous reports on abrogated TH2 cell responses after ibrutinib in vitro (Figure 6E).26 We did not observe any clear changes in the cytokine-production profiles of CD8+ T cells or Vδ2 T cells after treatment (Figure 6F; supplemental Figure 6). The functionality of NK cells did not improve after venetoclax-ibrutinib treatment (Figure 6G).
In summary, a reduction in several immunosuppressive features of CLL is also seen in a patient cohort treated with venetoclax in combination with ibrutinib.
Discussion
The interplay of malignant cells with the immune system has a pivotal role in the pathobiology of CLL; it profoundly modifies nonmalignant lymphocyte subsets, resulting in suppressed tumor surveillance and a higher risk for infections and secondary malignancies. In this paired analysis, we demonstrate that nonleukemic lymphocyte alterations are even more pronounced in the LN compared with the PB of CLL patients. Venetoclax has emerged as a powerful therapeutic agent in the CLL treatment landscape, and our study shows that the immune system is reshaped during venetoclax-containing regimens, leading to a reduction in the immunosuppressive footprint of CLL.
Ex vivo studies have identified the essential role of the LN microenvironment in the induction of proliferation and suppression of apoptosis in CLL cells. Within the LN, CLL cells obtain a distinctly activated gene signature in comparison with the PB.49-51 Presumably, T cells are an important source of the stimuli that CLL cells receive within the LN. CD4+ T cells secrete cytokines and express costimulatory molecules that support CLL cells,1,3 and Tfh cells provide a source for CD40L and IL-21 that, together, induce CLL proliferation.7 We observed that CD4+ T cells are abundant in the LN of CLL patients and that Tfh cells make up a large proportion of the CD4+ T cells surrounding the CLL cells in the LN.
In addition to strengthening the concept that the LN provides a CLL stimulatory environment, our data indicate it to be a protective niche from immunosurveillance. The numbers of NK and CD8+ T cells are relatively low, as well as Vδ1 and Vδ2 T-cell numbers, both of which have cytotoxic properties against CLL cells.52,53 Moreover, high PD-1 expression on CD8+ T cells fits with an immunosuppressed profile in the LN. The increased numbers of Tregs in the LN that we and other investigators describe likely suppress cellular immune responses within the LN.54 Therefore, the disappointing efficacy of cellular-based therapies may improve when such treatment modalities are combined with agents that displace CLL cells from the LN, as is seen in early clinical studies with ibrutinib and chimeric antigen receptor T cells.55
The numbers of nonmalignant lymphocytes decreased during venetoclax-based treatment, although they generally remained within the normal range. Direct and indirect effects of venetoclax treatment may explain the decrease in nonmalignant lymphocytes, although caution is required when determining the effect of venetoclax itself because of the combination treatments administered in both cohorts. Within the venetoclax-obinutuzumab cohort, the depletion of B cells and NK cells may attributed, at least in part, to obinutuzumab, and we indeed observe depletion of B cells and NK cells after preinduction with obinutuzumab. Normally, NK cell counts have largely recovered 3 months after obinutuzumab monotherapy, suggesting an additional role for venetoclax.44 Because a similar pattern is seen in the ibrutinib-venetoclax cohort, there is a possibility that venetoclax affects healthy lymphocyte counts. During ibrutinib monotherapy, elevated and reduced T-cell numbers have been described,23,27,56 whereas we have not seen alterations in NK cell numbers in previous analyses in a mixed cohort (I.d.W. and A.P.K., unpublished data). In both cohorts, preinduction with obinutuzumab or ibrutinib had no significant effect on T-cell counts, indicating that venetoclax has the largest effect on T-cell numbers.
The fact that lymphocyte counts decline across all subtypes in both cohorts might indicate that healthy lymphocyte survival depends on Bcl-2 to a greater extent than previously assumed. Whereas CD4+ T-cell numbers decreased across all subsets, this was particularly true for Tregs. High levels of Noxa make Tregs more prone to apoptosis, which in CLL Tregs is counterbalanced by elevated Bcl-2 levels, perhaps contributing to their venetoclax sensitivity.57
The depletion of CLL cells by venetoclax-containing regimens can also diminish the microenvironmental stimuli that recruit and support T cells and NK cells. Although there is no definitive proof for CLL-specific T-cell clones, the consistent elevation of T-cell numbers and skewed T-cell receptor repertoire suggest their existence, and such clones may disappear when no longer receiving CLL-derived antigenic stimulation.5,58 Considering the active recruitment of a supportive immune environment by CLL, the loss of CLL cells could directly and indirectly deprive T cells and NK cells of cytokines and costimulation.
Similarly, the elimination of CLL cells may contribute to the decline of the tumor-submissive T-cell state. The decrease in exhaustion markers and Treg numbers is also seen following treatment with ibrutinib, supporting the hypothesis that this is CLL dependent rather than treatment drug dependent.23,27
Fludarabine has profound detrimental effects on T-cell numbers, and immune recovery of T cells takes >6 months, leading to an extended period of increased infection risk.20,21 Now that discontinuation of venetoclax-based treatments upon reaching deep remissions appears to be feasible,29-31 it is of clinical relevance to assess whether lymphocyte counts recover after cessation, especially if the decrease in nonmalignant lymphocytes is a direct effect of venetoclax. Despite the commonly observed neutropenia, venetoclax treatment is not associated with an increased infection risk so far,59 which may be explained by our data that venetoclax treatment does not lead to reduced functionality of T cells and NK cells.
Cellular-based immunotherapy has disappointing responses in CLL, which may be related to the acquired T-cell dysfunction.60-63 The disruption of the immunosuppressive state and the improved lymphocyte functionality that we observe after venetoclax-based therapy may improve the efficacy of cellular-based therapies for CLL. Future studies should investigate the effect of venetoclax combination treatment on nonmalignant lymphocytes in relation to sequential or combinatorial cellular-based therapy.
Taken together, our data show that changes in nonleukemic lymphocytes are more pronounced in the LN of CLL patients compared with in the PB. In addition to effectively depleting CLL cells, venetoclax-based therapy is accompanied by extensive changes in the immune system. Treatment regimens with venetoclax in combination with obinutuzumab or ibrutinib result in reduced numbers of healthy lymphocytes, but the immunological footprint and suppressive features of the CLL immune system decline during venetoclax-based treatment.
The full-text version of this article contains a data supplement.
Acknowledgments
The authors thank the patients and HCs for their blood and LN samples, as well as Antoinet Schoonderwoerd for assistance.
This work was supported by the HOVON study group on behalf of the HOVON CLL working group. The HOVON139 GIVE trial was sponsored by Roche, and the HOVON141 Vision trial was sponsored by AbbVie and Janssen.
Authorship
Contribution: S.H.T. and A.P.K. designed the study and wrote the manuscript; I.d.W. and T.H. designed and performed experiments, analyzed data, and wrote the manuscript; R.d.B., J.A.D., and D.v.N. performed experiments; J.D. analyzed data; E.E. and M.M. contributed to the design of experiments; F.d.B., M.H., G.A.V., M.v.d.K., E.B.M.R., F.J.B., M.-D.L., S.K., and C.U.N. provided patient samples; and all authors reviewed the manuscript.
Conflict-of-interest disclosure: M.M. is an employee of Genentech. A.P.K. has received research funding and honoraria from Roche/Genentech, AbbVie, and Janssen. C.U.N. has received research funding from AbbVie, Janssen, and Acerta, as well as travel support/consultancy fees from Roche, Gilead, Janssen, AbbVie, Novartis, CSL Behring, AstraZeneca, Acerta, and Sunesis. The remaining authors declare no competing financial interests.
Correspondence: Arnon P. Kater, Department of Hematology, Cancer Center Amsterdam, Amsterdam UMC, University of Amsterdam, Meibergdreef 9, 1105 AZ Amsterdam, The Netherlands; e-mail: a.p.kater@amc.nl.

