

Key Points
Kdm2b insufficiency promotes the initiation of T-ALL.
KDM2B in PRC1.1 antagonizes NOTCH1 and functions as a tumor suppressor.

Abstract
KDM2B together with RING1B, PCGF1, and BCOR or BCORL1 comprise polycomb repressive complex 1.1 (PRC1.1), a noncanonical PRC1 that catalyzes H2AK119ub1. It binds to nonmethylated CpG islands through its zinc finger-CxxC DNA binding domain and recruits the complex to target gene loci. Recent studies identified the loss of function mutations in the PRC1.1 gene, BCOR and BCORL1 in human T-cell acute lymphoblastic leukemia (T-ALL). We previously reported that Bcor insufficiency induces T-ALL in mice, supporting a tumor suppressor role for BCOR. However, the function of BCOR responsible for tumor suppression, either its corepressor function for BCL6 or that as a component of PRC1.1, remains unclear. We herein examined mice specifically lacking the zinc finger-CxxC domain of KDM2B in hematopoietic cells. Similar to Bcor-deficient mice, Kdm2b-deficient mice developed lethal T-ALL mostly in a NOTCH1-dependent manner. A chromatin immunoprecipitation sequence analysis of thymocytes revealed the binding of KDM2B at promoter regions, at which BCOR and EZH2 colocalized. KDM2B target genes markedly overlapped with those of NOTCH1 in human T-ALL cells, suggesting that noncanonical PRC1.1 antagonizes NOTCH1-mediated gene activation. KDM2B target genes were expressed at higher levels than the others and were marked with high levels of H2AK119ub1 and H3K4me3, but low levels of H3K27me3, suggesting that KDM2B target genes are transcriptionally active or primed for activation. These results indicate that PRC1.1 plays a key role in restricting excessive transcriptional activation by active NOTCH1, thereby acting as a tumor suppressor in the initiation of T-cell leukemogenesis.
Introduction
Polycomb group proteins compose multiprotein complexes named polycomb repressive complexes (PRCs), which play an important role in the transcriptional repression of target genes through histone modifications. Two major PRCs have been characterized: PRC1 (or canonical PRC1), which catalyzes monoubiquitination at lysine 119 of histone H2A (H2AK119ub1), and PRC2, which catalyzes mono-, di-, and trimethylation at lysine 27 of histone H3 (H3K27me3). These 2 complexes function cooperatively through the recognition of PRC2-induced H3K27me3 by CBX, a core subunit of canonical PRC1.1,2 In contrast, recent studies revealed that variant or noncanonical PRC1 complexes catalyze H2AK119ub1 without prior H3K27me3 induced by PRC2 and recruit PRC2 to monoubiquitinated loci.3
KDM2B (also known as FBXL10, NYD1, and JHDM1B) is a JmjC domain containing H3K36me2 demethylase, and functions as a component of PRC1.1, which is categorized as noncanonical PRC1.4 KDM2B binds to nonmethylated CpG islands (CGIs) through its zinc finger-CxxC (ZF-CxxC) DNA-binding domain as most mammalian polycomb target sites are associated with CGIs.5,6 The ZF-CxxC domain-mediated recognition of unmethylated CGIs leads to the recruitment of other components of PRC1.1 through the cooperation of PCGF1 and BCOR/BCORL1.7-9 Because CGIs are frequently located around transcription start sites (TSS), including most housekeeping genes and developmental regulator genes,10,11 PRC1.1 is considered to play an important role in the regulation of these genes. The deletion of the KDM2B ZF-CxxC domain induced the complete loss of KDM2B occupancy and removal of PCGF1 from CGIs, and mice lacking the KDM2B ZF-CxxC domain showed embryonic lethality because of developmental cessation.12 In the development of the hematopoietic system, KDM2B also plays a critical role in the maintenance of hematopoietic stem and progenitor cells (HSPCs) and lymphopoiesis through the regulation of hematopoietic and lymphoid development-associated genes.13 We also demonstrated that the forced expression of Kdm2b prevented the exhaustion of the long-term repopulating potential of hematopoietic stem cells (HSCs) following serial transplantation by negatively regulating the expression of cyclin-dependent kinase inhibitor genes, such as Ink4a.14
Somatic mutations in polycomb group and associated genes are frequently detected in patients with T-cell malignancies. Loss-of-function mutations in PRC2 component genes, such as EZH2, EED, and SUZ12, have frequently been found in pediatric and adult T-cell acute lymphoblastic leukemia (T-ALL) patients.15-19 Previous studies also demonstrated that an Ezh2 deficiency induced T-ALL in mouse models.20-23 A previous study based on human and mouse T-ALL cells revealed that the activation of NOTCH1 specifically induced the loss of H3K27me3 by antagonizing the activity of PRC2.16 These findings indicated that PRC2 plays a tumor suppressive role in T-cell leukemogenesis. Loss-of-function mutations in BCOR and its homolog BCORL1, components of PRC1.1, have also been detected in several T-cell malignancies, such as extranodal natural killer/T-cell lymphoma,24 T-cell prolymphocytic leukemia,25 and T-ALL.19,26 We previously generated mice deficient for Bcor exon 4 (BcorΔE4/y) lacking a region of the Bcl6-binding domain and found that these mice developed T-ALL mostly in a NOTCH1-dependent manner.27 Mice deficient for Bcor exons 9 and 10 (BcorΔ9-10/y) lacking the PCGF1-binding domain also developed T-ALL.28 These findings suggest that BCOR also plays a tumor-suppressive role in T-cell leukemogenesis. However, the expression of Bcor without exons 9 and 10 was significantly reduced at both the messenger RNA and protein levels, similar to BCOR mutants in MDS patients,29 suggesting that the corepressor function of BCOR for BCL6 was also attenuated.28 Therefore, the function of BCOR responsible for tumor suppression, either the corepressor function for BCL6 or that as a component of PRC1.1, remains unclear.
In the present study, we analyzed mice lacking the ZF-CxxC domain of KDM2B, a core component of PRC1.1, and found that they developed T-ALL in a similar manner to Bcor insufficient mice, suggesting a critical tumor suppressor role for PRC1.1 in the pathogenesis of T-cell leukemogenesis.
Materials and methods
Mice and generation of hematopoietic chimeras
The conditional Kdm2b allele (Kdm2bfl), which contains LoxP sites flanking Kdm2b exon 13 encoding the ZF-CxxC domain,12 was used. Kdm2bfl mice were backcrossed at least 6 times with C57BL/6 (CD45.2) mice. Mice were crossed with Rosa26::Cre-ERT mice (TaconicArtemis) to generate conditional Kdm2b knockout mice. To generate hematopoietic cell-specific Kdm2b knockout mice, we transplanted Kdm2bwt/wt;Cre-ERT or Kdm2bfl/fl;Cre-ERT total bone marrow (BM) cells into lethally irradiated CD45.1 recipient mice and deleted Kdm2b 4 weeks after transplantation by intraperitoneally injecting 100 μL of tamoxifen dissolved in corn oil at a concentration of 10 mg/mL for 5 sequential days. Littermates were used as controls. C57BL/6 mice congenic for the Ly5 locus (CD45.1) were purchased from Sankyo-Laboratory Service. All animal experiments were performed in accordance with our institutional guidelines for the use of laboratory animals and approved by the Review Board for Animal Experiments of Chiba University (approval ID: 30-56) and Tokyo University (approval ID: PA18-01).
Statistical analysis
Statistical analyses were performed using GraphPad Prism version 7. The significance of differences in continuous variables was measured by the Student t test. Survival curves were calculated by the Kaplan-Meier method and compared using the log-rank test. Data are shown as the mean ± standard error of the mean (SEM). Significance was taken at values of *P < .05; **P < .01; and ***P < .001.
Results
Hematopoietic cell-specific deletion of Kdm2b in mice
We used Kdm2b floxed mice that harbored LoxP sites flanking Kdm2b exon 13 encoding the ZF-CxxC domain (Kdm2bfl)12 in the present study. We crossed them with Rosa26::Cre-ERT (Cre-ERT) mice. To assess the effects of Kdm2b insufficiency specifically in hematopoietic cells, we transplanted total BM cells from Kdm2bwt/wt;Cre-ERT (WT) and Kdm2bfl/fl;Cre-ERT CD45.2 female mice into lethally irradiated CD45.1 recipient female mice without competitor cells. Tamoxifen was injected intraperitoneally 4 weeks after transplantation to activate Cre. We hereafter refer to recipient mice reconstituted with WT and Kdm2bΔCxxC/ΔCxxC cells as WT and ΔCxxC mice, respectively (supplemental Figure 1A). We confirmed the complete deletion of Kdm2b exon 13 in hematopoietic cells from ΔCxxC mice by genomic polymerase chain reaction (PCR; supplemental Figure 1B). An RNA-sequencing (RNA-seq) analysis of lineage marker (Lin)−Sca-1+c-Kit+ (LSK) HSPCs revealed the specific deletion of Kdm2b exon 13 (supplemental Figure 1C). The removal of the ZF-CxxC exon generates a product that still associates with the PCGF1/PRC1.1 complex, but lacks its capacity to bind non-methylated DNA.12 We detected a truncated form of the KDM2B (KDM2BΔCxxC) protein at a lower level in ΔCxxC thymocytes than in WT in a western blot analysis (supplemental Figure 1D). The deletion of the ZF-CxxC domain did not affect the global levels of H2AK119ub1 or H3K27me3 (supplemental Figure 1E).
Deletion of Kdm2b ZF-CxxC impaired the repopulating capacity of HSPCs and lymphopoiesis
We examined hematopoiesis in ΔCxxC mice (Figure 1A). ΔCxxC mice exhibited leukocytopenia, mild anemia, and mild thrombocytosis in peripheral blood (PB) (Figure 1B). Leukocytopenia was mainly attributed to reductions in B and T lymphocytes (Figure 1C). A BM analysis 1 month after the tamoxifen treatment revealed significant decreases in the numbers of LSK HSPCs and lymphoid-primed multipotent progenitors (LMPPs) in ΔCxxC mice, whereas those of common myeloid progenitors and granulocyte-macrophage progenitors increased (Figure 1D). Spleen and thymus weights were not significantly different between WT and ΔCxxC mice (Figure 1E).
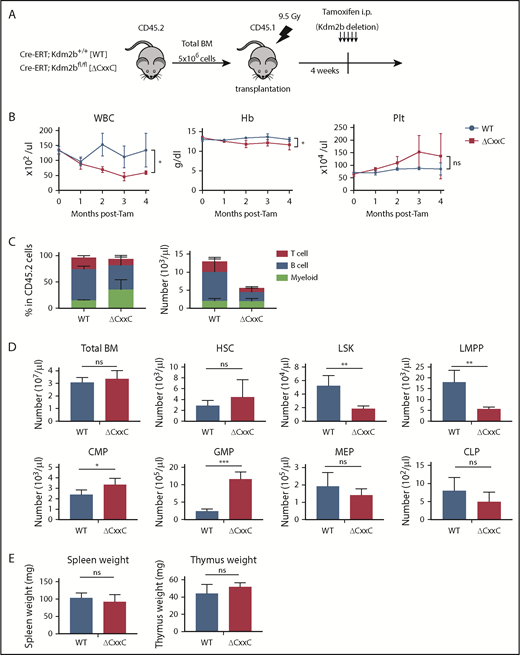
ΔCxxC mice showed myeloid-biased hematopoiesis and impaired lymphopoiesis. (A) Experimental design of the hematopoietic-specific deletion of Kdm2b exon 13. (B) PB cell counts in WT and ΔCxxC mice in noncompetitive BM transplantation settings as in panel A . PB cell counts in WT (n = 5) and ΔCxxC (n = 5) mice after the injection of tamoxifen (Tam) are shown as means ± standard deviation (SD). (C) Proportions of myeloid cells (Mac-1+ and/or Gr-1+), B cells (B220+), and T cells (CD4+ or CD8+) among CD45.2 donor-derived hematopoietic cells and their absolute numbers in PB from WT (n = 5) and ΔCxxC (n = 4) mice 4 weeks after the injection of tamoxifen. Data are shown as means ± SD. (D) BM analysis 4 weeks after the injection of tamoxifen. Absolute numbers of CD45.2 HSCs, LSK cells, LMPPs, myeloid progenitors, and CLPs from a unilateral femur and tibia pair in WT and ΔCxxC (n = 5). Data are shown as means ± SD. (E) Spleen and thymus weights 4 weeks after the injection of tamoxifen. Data are shown as means ± SD. *P < .05; **P < .01; ***P < .001 by Student t test. CMP, common myeloid progenitor; GMP, granulocyte/macrophage progenitor; Hb, hemoglobin; i.p., intraperitoneal; MEP, megakaryocyte/erythroid progenitor; ns, not significant; Plt, platelet; WBC, white blood cell.
ΔCxxC mice showed myeloid-biased hematopoiesis and impaired lymphopoiesis. (A) Experimental design of the hematopoietic-specific deletion of Kdm2b exon 13. (B) PB cell counts in WT and ΔCxxC mice in noncompetitive BM transplantation settings as in panel A . PB cell counts in WT (n = 5) and ΔCxxC (n = 5) mice after the injection of tamoxifen (Tam) are shown as means ± standard deviation (SD). (C) Proportions of myeloid cells (Mac-1+ and/or Gr-1+), B cells (B220+), and T cells (CD4+ or CD8+) among CD45.2 donor-derived hematopoietic cells and their absolute numbers in PB from WT (n = 5) and ΔCxxC (n = 4) mice 4 weeks after the injection of tamoxifen. Data are shown as means ± SD. (D) BM analysis 4 weeks after the injection of tamoxifen. Absolute numbers of CD45.2 HSCs, LSK cells, LMPPs, myeloid progenitors, and CLPs from a unilateral femur and tibia pair in WT and ΔCxxC (n = 5). Data are shown as means ± SD. (E) Spleen and thymus weights 4 weeks after the injection of tamoxifen. Data are shown as means ± SD. *P < .05; **P < .01; ***P < .001 by Student t test. CMP, common myeloid progenitor; GMP, granulocyte/macrophage progenitor; Hb, hemoglobin; i.p., intraperitoneal; MEP, megakaryocyte/erythroid progenitor; ns, not significant; Plt, platelet; WBC, white blood cell.
We then performed competitive BM transplantation assays. BM cells from WT or ΔCxxC CD45.2 female mice were transplanted into lethally irradiated CD45.1 recipient mice with the same number of CD45.1 competitor BM cells (supplemental Figure 2A). The chimerism levels of ΔCxxC cells in PB gradually declined, and ΔCxxC B and T cells were eventually outcompeted by competitor cells (supplemental Figure 2B). In contrast, ΔCxxC cells contributed to myeloid cells in the long term, albeit at a profoundly lower level than WT cells (supplemental Figure 2B). In a BM analysis 6 months after the tamoxifen treatment, ΔCxxC cells showed significantly lower chimerism levels in all lineages (particularly in B and T cells), LSK cells, LMPPs, and common lymphoid progenitors (CLPs) in BM and in thymocytes than WT cells, whereas chimerism levels in HSCs and myeloid progenitors were maintained in BM (supplemental Figure 2C). These results indicated that KDM2B plays an important role in the repopulation of hematopoiesis by HSCs, particularly repopulating lymphoid lineage cells.
Deletion of KDM2B ZF-CxxC–induced T-ALL
We next analyzed the pathophysiological impact of the deletion of KDM2B ZF-CxxC using WT and ΔCxxC mice in a noncompetitive BM transplantation setting (Figure 2A). Most ΔCxxC mice developed lethal T-ALL during the observation period of 300 days after the tamoxifen treatment in a similar manner to BcorΔE4 and BcorΔE9-10 mice27,28 (Figure 2B; supplemental Table 1). T-ALL mice showed the expansion of lymphoblasts, which were mostly CD4 and CD8 double positive (DP) (Figure 2B-C). The majority of mice exhibited thymomegaly and splenomegaly (Figure 2D) and had high chimerism levels of donor-derived T-ALL cells in their BM, spleen, thymus, and PB (Figure 2E). Because the majority of mice had an enlarged thymus and the expansion of T-ALL cells in the thymus, the origin of the disease was considered to be the thymus. We then examined whether the active NOTCH1 pathway was associated with the pathogenesis of T-ALL because Notch1 active mutations were frequently detected in T-ALL cells in BcorΔE4/y and BcorΔ9-10/y mice.27,28 Seven of 14 mice had frameshift or nonsense mutations in exon 34, which resulted in PEST domain truncations and the acquisition of resistance from FBXW7-mediated polyubiquitination.30 The remaining mouse had a missense mutation in exon 27, which was also associated with NOTCH1 activation through the destabilization of the connection between extracellular and intracellular domains30 (Figure 2F). Notch1 gene deletions (types 1 and 2), the other common mechanisms of NOTCH1 activation in murine T-ALL,31 were not detected in T-ALL mice (data not shown). We then performed a western blot analysis to evaluate the activation status of NOTCH1. Of interest, even the spleen cells from ΔCxxC T-ALL mice without Notch1 mutations listed in Figure 2F had a cleaved form of active NOTCH1 (Figure 2G), suggesting the presence of other Notch1-related active mutations. These results suggest that Kdm2b insufficiency collaborates with NOTCH1 activation to induce T-ALL.
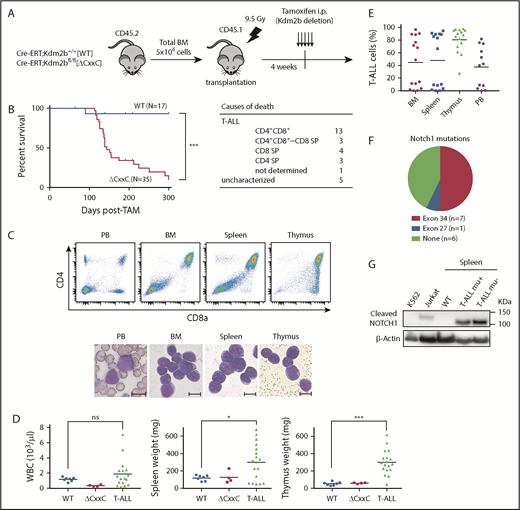
ΔCxxC mice developed T-ALL. (A) Experimental design of the hematopoietic-specific deletion of Kdm2b exon 13. (B) Kaplan-Meier survival curves of WT (n = 17) and ΔCxxC (n = 35) mice after the injection of tamoxifen. Data from 4 independent experiments were combined. P values were calculated by the log-rank test. The causes of death in ΔCxxC mice are summarized in the table. (C) Representative flow cytometric profiles and smear preparation of PB and cytospin preparations of BM and the thymus after May-Giemsa staining. Hematopoietic cells were obtained from the PB, BM, spleen, and thymus of a DP-type T-ALL mouse. Scale bars, 10 μm. (D) PB WBC counts and spleen and thymus weights in moribund ΔCxxC T-ALL mice (n = 18) and WT (n = 7) and ΔCxxC (n = 4) mice 300 days after the injection of tamoxifen. Bars in scatter diagrams indicate median values. (E) Proportions of T-ALL cells in BM, the spleen, thymus, and PB. Bars in scatter diagrams indicate median values. (F) Frequencies of Notch1 active mutations in exons 27 and 34 detected in T-ALL cells sorted from thymus. (G) Cleaved NOTCH1 protein in T-ALL cells detected by a western blot analysis. Cleaved NOTCH1 proteins in human K562 cells (negative control), Jurkat T-ALL cells (positive control), and spleen cells from WT and ΔCxxC T-ALL mice with and without Notch1 mutations (mu+/−) are shown. Actin served as a loading control. *P < .05; ***P < .001 by Student t test.
ΔCxxC mice developed T-ALL. (A) Experimental design of the hematopoietic-specific deletion of Kdm2b exon 13. (B) Kaplan-Meier survival curves of WT (n = 17) and ΔCxxC (n = 35) mice after the injection of tamoxifen. Data from 4 independent experiments were combined. P values were calculated by the log-rank test. The causes of death in ΔCxxC mice are summarized in the table. (C) Representative flow cytometric profiles and smear preparation of PB and cytospin preparations of BM and the thymus after May-Giemsa staining. Hematopoietic cells were obtained from the PB, BM, spleen, and thymus of a DP-type T-ALL mouse. Scale bars, 10 μm. (D) PB WBC counts and spleen and thymus weights in moribund ΔCxxC T-ALL mice (n = 18) and WT (n = 7) and ΔCxxC (n = 4) mice 300 days after the injection of tamoxifen. Bars in scatter diagrams indicate median values. (E) Proportions of T-ALL cells in BM, the spleen, thymus, and PB. Bars in scatter diagrams indicate median values. (F) Frequencies of Notch1 active mutations in exons 27 and 34 detected in T-ALL cells sorted from thymus. (G) Cleaved NOTCH1 protein in T-ALL cells detected by a western blot analysis. Cleaved NOTCH1 proteins in human K562 cells (negative control), Jurkat T-ALL cells (positive control), and spleen cells from WT and ΔCxxC T-ALL mice with and without Notch1 mutations (mu+/−) are shown. Actin served as a loading control. *P < .05; ***P < .001 by Student t test.
KDM2B in PRC1.1 suppresses T-ALL development by antagonizing NOTCH1 activation
To clarify the molecular mechanisms underlying the development of T-ALL in ΔCxxC mice, we performed an RNA sequence analysis of DP leukemic cells from T-ALL mice and DP thymocytes from WT and ΔCxxC mice. RNA-seq analysis revealed that 324 and 1399 genes were upregulated (more than twofold) and 648 and 1632 genes were downregulated (more than twofold) in ΔCxxC DP thymocytes and DP leukemic cells, respectively, compared with WT DP thymocytes (supplemental Table 2A). A gene set enrichment analysis (GSEA) revealed the stronger enrichment of MYC target gene sets in ΔCxxC DP leukemic cells than in WT DP thymocytes (Figure 3A). Myc, a representative NOTCH1 target, was mildly upregulated in ΔCxxC DP thymocytes and strongly upregulated in ΔCxxC DP leukemic cells (Figure 3B-C). Although the expression of the direct target genes of NOTCH1 was not significantly altered in ΔCxxC DP thymocytes, they were upregulated in ΔCxxC DP leukemic cells, including Myc (Figure 3D; supplemental Table 2A), suggesting that NOTCH1 signaling is augmented in ΔCxxC T-ALL.
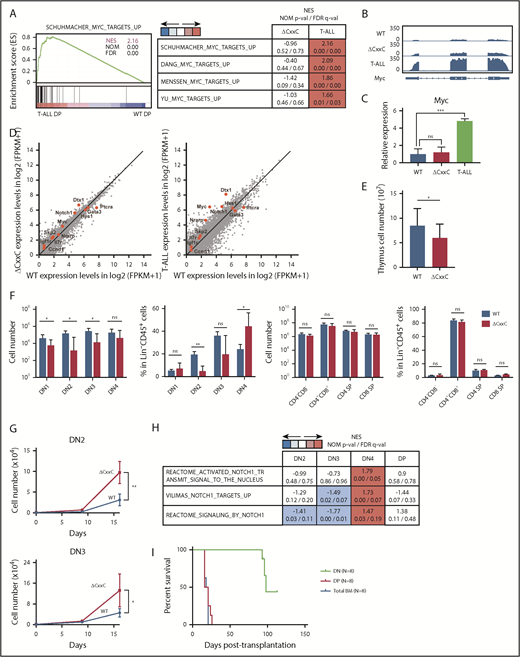
KDM2B loss confers a growth advantage on DN thymocytes. (A) GSEA plot and GSEA summary of the MYC target gene sets demonstrating significant positive enrichment in ΔCxxC DP T-ALL cells relative to WT DP thymocytes (n = 2, each). Normalized enrichment scores (NES), nominal P values (NOM-p), and false discovery rates (FDR-q) are indicated. (B) A snapshot of RNA-seq signals at the Myc gene locus in WT and ΔCxxC DP thymocytes and ΔCxxC DP T-ALL cells. The structure of the Myc gene is indicated at the bottom. (C) Quantitative reverse transcription-PCR analysis of Myc in WT and ΔCxxC DP thymocytes and ΔCxxC DP T-ALL cells. Gapdh was used to normalize the amount of input RNA. Data are shown as the mean ± SEM (n = 3). (D) Scatter diagram showing RNA-seq data. Signal levels of RefSeq genes (FPKM+1 in log2) in WT and ΔCxxC DP thymocytes and ΔCxxC DP T-ALL cells are plotted. Representative direct target genes of NOTCH1 are shown as red dots. (E) Absolute cell numbers of thymus in WT and ΔCxxC mice (n = 4, each) 8 weeks after the injection of tamoxifen. (F) Absolute numbers and proportions of DN1 (CD25−CD44+), DN2 (CD25+CD44+), DN3 (CD25−CD44+), DN4 (CD25+CD44−), DN (CD4−CD8−), DP (CD4+CD8+), and CD4 or CD8 single positive (SP) cells among CD45.2 donor-derived cells in the thymus from WT and ΔCxxC mice (n = 4, each) 8 weeks after the injection of tamoxifen. Data are shown as means ± SD. (G) In vitro proliferation of WT and ΔCxxC thymocytes. DN2 or DN3 thymocytes from WT and ΔCxxC mice were cultured on TSt-4/DLL stromal cells in the presence of 10 ng/mL of SCF, Flt3L, and interleukin-7. Data are shown as the mean ± SEM of triplicate cultures. (H) GSEA summary of RNA-seq data of DN2, DN3, DN4, and DP cells in the thymus from WT and ΔCxxC mice. NES, NOM, and FDR are indicated. (I) Kaplan-Meier survival curves after serial transplantation assays. DN and DP T-ALL cells in thymus and total BM cells were collected from ΔCxxC T-ALL mice and were transplanted into sublethally irradiated recipient mice. Same numbers of the cells were transplanted (cohort 1: 2.5 × 10⁵/head, cohort 2: 4.0 × 10⁴/head). Data from 2 independent experiments were combined.
KDM2B loss confers a growth advantage on DN thymocytes. (A) GSEA plot and GSEA summary of the MYC target gene sets demonstrating significant positive enrichment in ΔCxxC DP T-ALL cells relative to WT DP thymocytes (n = 2, each). Normalized enrichment scores (NES), nominal P values (NOM-p), and false discovery rates (FDR-q) are indicated. (B) A snapshot of RNA-seq signals at the Myc gene locus in WT and ΔCxxC DP thymocytes and ΔCxxC DP T-ALL cells. The structure of the Myc gene is indicated at the bottom. (C) Quantitative reverse transcription-PCR analysis of Myc in WT and ΔCxxC DP thymocytes and ΔCxxC DP T-ALL cells. Gapdh was used to normalize the amount of input RNA. Data are shown as the mean ± SEM (n = 3). (D) Scatter diagram showing RNA-seq data. Signal levels of RefSeq genes (FPKM+1 in log2) in WT and ΔCxxC DP thymocytes and ΔCxxC DP T-ALL cells are plotted. Representative direct target genes of NOTCH1 are shown as red dots. (E) Absolute cell numbers of thymus in WT and ΔCxxC mice (n = 4, each) 8 weeks after the injection of tamoxifen. (F) Absolute numbers and proportions of DN1 (CD25−CD44+), DN2 (CD25+CD44+), DN3 (CD25−CD44+), DN4 (CD25+CD44−), DN (CD4−CD8−), DP (CD4+CD8+), and CD4 or CD8 single positive (SP) cells among CD45.2 donor-derived cells in the thymus from WT and ΔCxxC mice (n = 4, each) 8 weeks after the injection of tamoxifen. Data are shown as means ± SD. (G) In vitro proliferation of WT and ΔCxxC thymocytes. DN2 or DN3 thymocytes from WT and ΔCxxC mice were cultured on TSt-4/DLL stromal cells in the presence of 10 ng/mL of SCF, Flt3L, and interleukin-7. Data are shown as the mean ± SEM of triplicate cultures. (H) GSEA summary of RNA-seq data of DN2, DN3, DN4, and DP cells in the thymus from WT and ΔCxxC mice. NES, NOM, and FDR are indicated. (I) Kaplan-Meier survival curves after serial transplantation assays. DN and DP T-ALL cells in thymus and total BM cells were collected from ΔCxxC T-ALL mice and were transplanted into sublethally irradiated recipient mice. Same numbers of the cells were transplanted (cohort 1: 2.5 × 10⁵/head, cohort 2: 4.0 × 10⁴/head). Data from 2 independent experiments were combined.
Next, we examined the possibility that the transformation has occurred at much earlier stages of T-cell development in the thymus. To this end, we analyzed CD4 and CD8 double-negative (DN) and DP cells 2 months after tamoxifen treatment (supplemental Figure 3). DN1-3 cells were significantly decreased in numbers in ΔCxxC mice compared with WT mice (Figure 3E-F), which could be attributed to the reduced numbers of lymphoid progenitors such as LMPPs and CLPs in BM (Figure 1D). In contrast, the numbers of DN4, DP, CD4+, and CD8+ cells in ΔCxxC mice recovered close to the WT levels (Figure 3E-F). Of note, the proportion of DN4 cells was significantly increased in ΔCxxC mice (Figure 3F), suggesting that ΔCxxC thymocytes acquired a growth advantage at around the DN4 stage. We then purified DN2 and DN3 cells from WT and ΔCxxC mice and cocultured them with TSt-4 stromal cells that express NOTCH ligand. Both DN2 and DN3 cells from ΔCxxC mice grew significantly better than those from WT mice (Figure 3G). RNA-seq of DN2, DN3, and DN4 cells from WT and ΔCxxC mice 2 months after tamoxifen injection revealed that the gene sets of NOTCH1 targets were specifically activated in ΔCxxC DN4 cells (Figure 3H; supplemental Table 2B). These results suggest that KDM2B loss enhanced proliferation of DN cells by augmenting the NOTCH1 signal.
We next performed serial transplantation assays to define the leukemia-initiating cells in this mouse model. We purified DN cells and DP cells in the thymus and total BM cells from ΔCxxC T-ALL mice and transplanted them into lethally irradiated recipient mice. All mice that were infused with DP cells or total BM cells from leukemic mice developed T-ALL within 1 month after transplantation (Figure 3I). Notably, 3 of 8 recipient mice infused with DN cells developed CD4+CD8+ T-ALL at around day 100 posttransplantation (Figure 3I). These results indicate that leukemic DP cells contain leukemia-initiating cells at a high frequency, but also suggest that DN cells are candidate cells of origin of tumor-initiating cells in this mouse model.
KDM2B target genes are transcriptionally active or primed for activation
We then performed a chromatin immunoprecipitation (ChIP)–seq analysis of KDM2B, H2AK119ub1, and H3K27me3 in thymocytes to identify KDM2B target genes. Because no anti-KDM2B antibodies were suitable for ChIP, we prepared mice expressing 3xFlag-KDM2B in hematopoietic cells by transducing HSCs with a 3xFlag-KDM2B virus followed by transplantation into lethally irradiated mice, and subjected total thymocytes containing DP thymocytes as the major cell population to a ChIP analysis using an anti-Flag antibody (supplemental Figure 4). A peak-calling analysis identified 6377 significant binding peaks of KDM2B. The majority of these peaks were located on the promoter region around TSS (TSS ± 2.0 kb) (Figure 4A; supplemental Table 3A). K-means clustering of the data around TSS revealed that the genes in cluster 1 showed the clear binding of KDM2B and colocalized with H2AK119ub1 and mostly with H3K27me3, indicating that these genes are targets of PRC1.1 (Figure 4B). Most of the target genes (cluster 1) were CGI genes defined by the UCSC Genome Browser (mm10) (Figure 4C), as expected from previous studies.5,6 We then compared H2AK119ub1, H3K27me3, and H3K4me3 modifications and RNA expression levels in each cluster in WT DP thymocytes. H2AK119ub1 levels were significantly higher in clusters 1 and 2 than in cluster 3, whereas H3K27me3 levels in cluster 2 were significantly higher than in the others. The enrichment of the H3K4me3+ histone mark was significantly and markedly stronger in clusters 1 and 2, respectively, than in cluster 3 (Figure 4D). RNA expression levels were significantly higher in cluster 1 than in the others (Figure 4E). These results suggest that KDM2B target genes are mainly repressed by H2AK119ub1 rather than H3K27me3, and many of the genes are already active or primed for activation by the H3K4me3 mark, which promotes transcription.
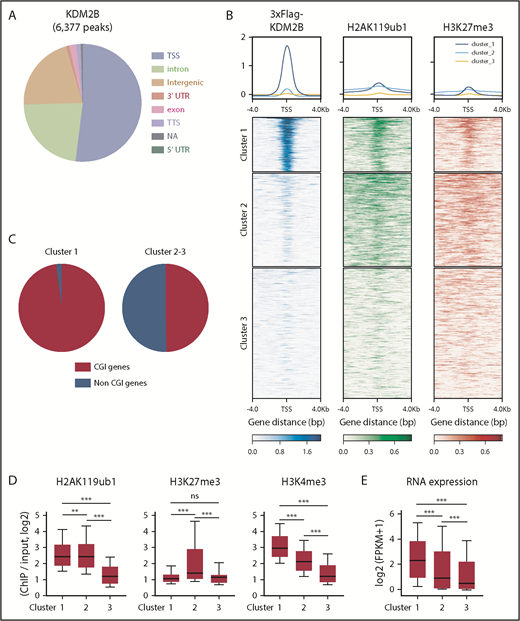
KDM2B targets transcriptionally active genes which are mainly repressed by H2AK119ub1. (A) Distribution of ChIP peaks detected in the ChIP-seq analysis of KDM2B using thymocytes overexpressing 3xFLAG-KDM2B. Peaks were called using MACS2 v2.1.1 with a q value <0.05. (B) K-means clustering of 3xFLAG KDM2B, H2AK119ub1, and H3K27me3 ChIP-seq data around TSS (±4 kb) obtained using DP thymocytes overexpressing 3xFLAG KDM2B. (C) Frequency of CGI genes in each cluster; 97.9% of genes in cluster 1 and 49.6% in clusters 2 and 3 were CGI genes. (D) Summary of H2AK119ub1, H3K27me3, and H3K4me3 enrichment around TSS (±2 kb) detected by the ChIP-seq analysis in WT DP thymocytes. The fold enrichment values of ChIP signals calculated against the input signals (ChIP/input, RPKM+0.1) of RefSeq genes. The values in each cluster are shown. WT DP thymocytes were collected 4 weeks after the tamoxifen treatment. (E) RNA expression levels in each cluster obtained by an RNA-seq of WT DP thymocytes. Signal levels of RefSeq genes (FPKM+1 in log2) are shown. WT DP thymocytes were collected 4 weeks after the tamoxifen treatment. **P < .01; ***P < .001 by the Student t test. NA, not available; TTS, transcription termination site; UTR, untranslated region.
KDM2B targets transcriptionally active genes which are mainly repressed by H2AK119ub1. (A) Distribution of ChIP peaks detected in the ChIP-seq analysis of KDM2B using thymocytes overexpressing 3xFLAG-KDM2B. Peaks were called using MACS2 v2.1.1 with a q value <0.05. (B) K-means clustering of 3xFLAG KDM2B, H2AK119ub1, and H3K27me3 ChIP-seq data around TSS (±4 kb) obtained using DP thymocytes overexpressing 3xFLAG KDM2B. (C) Frequency of CGI genes in each cluster; 97.9% of genes in cluster 1 and 49.6% in clusters 2 and 3 were CGI genes. (D) Summary of H2AK119ub1, H3K27me3, and H3K4me3 enrichment around TSS (±2 kb) detected by the ChIP-seq analysis in WT DP thymocytes. The fold enrichment values of ChIP signals calculated against the input signals (ChIP/input, RPKM+0.1) of RefSeq genes. The values in each cluster are shown. WT DP thymocytes were collected 4 weeks after the tamoxifen treatment. (E) RNA expression levels in each cluster obtained by an RNA-seq of WT DP thymocytes. Signal levels of RefSeq genes (FPKM+1 in log2) are shown. WT DP thymocytes were collected 4 weeks after the tamoxifen treatment. **P < .01; ***P < .001 by the Student t test. NA, not available; TTS, transcription termination site; UTR, untranslated region.
KDM2B in PRC1.1 suppresses T-ALL development by antagonizing NOTCH1 activation
We then compared the histone modification status at the promoter region (TSS ± 2.0 kb) in WT, ΔCxxC DP, and ΔCxxC T-ALL cells. H2AK119ub1 levels at promoters were significantly decreased in T-ALL cells, particularly at KDM2B target genes (cluster 1) (Figure 5A; supplemental Table 4A). Several NOTCH1 direct target genes, including Myc, lost H2AK119ub1 at promotors in T-ALL cells and similar results were observed in ΔCxxC DP cells (Figure 5B). We confirmed the binding of KDM2B to the promotor region of Myc, which appeared to be repressed mainly by H2AK119ub1, but not by H3K27me3, in DP thymocytes. Of note, H2AK119ub1 levels were reduced in ΔCxxC DP thymocytes and T-ALL cells (Figure 5C). A quantitative ChIP analysis confirmed the binding of KDM2B to the Myc promoter in DP thymocytes and significant reductions in H2AK119ub1 levels around the Myc promoter in ΔCxxC DP thymocytes and T-ALL cells (Figure 5D). The distribution of the ChIP-seq peaks of KDM2B in the present study, BCOR in WT thymocytes in our previous study27 and NOTCH1 in T-ALL cells32 closely overlapped at the promoter region (Figure 5E; supplemental Table 3A-C). We then compared H3K27me3 levels at promoters of cluster 1 genes and found that H3K27me3 levels were also significantly decreased in both T-ALL cells and ΔCxxC DP thymocytes (Figure 5F; supplemental Table 4B). Decreases in EZH2 binding peaks around TSS were significantly greater in ΔCxxC DP thymocytes than in WT DP thymocytes in cluster 1 genes (Figure 5G). EZH2 binding peaks in WT thymocytes also overlapped with KDM2B and NOTCH1 peaks (Figure 5H; supplemental Tables 3A, 3C, and 3D), suggesting that noncanonical PRC1.1 and PRC2 coordinately antagonized NOTCH1-driven transcription in thymocytes. The KEGG pathway analysis of 1276 genes, which had all peaks (Figure 5H), designated as overlapping genes, showed the significant enrichment of T-cell receptor signaling, NOTCH1 signaling, and the cell-cycle pathway, which plays an important role in the development of T-ALL (Figure 5I). The H3K27me3 levels of the overlapping genes in WT DP thymocytes were markedly lower than the 1182 EZH2 target genes without KDM2B and NOTCH1 binding in Figure 5H (designated as EZH2 only), whereas H3K4me3 levels showed an inverse relationship (Figure 5J). These results again indicate that PRC1.1 target genes are already more active or primed for activation by the H3K4me3 mark than EZH2 target genes without PRC1.1 and include many of the NOTCH1 direct target genes.
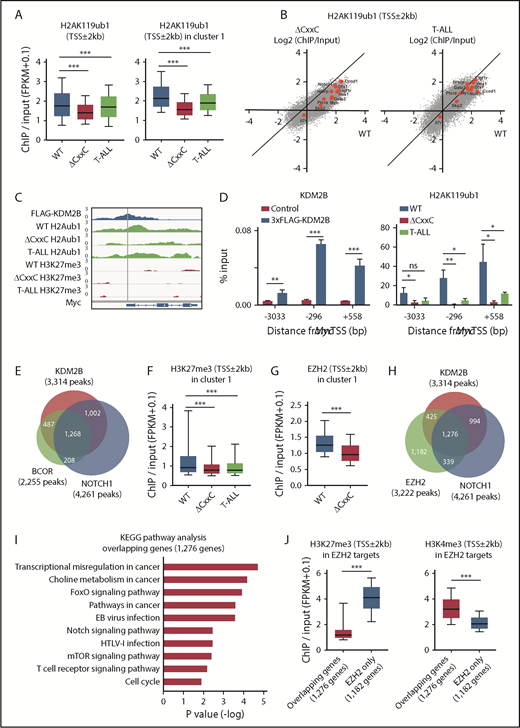
PRC1.1 and PRC2 antagonize NOTCH1 in the development of T-ALL. (A) Summary of H2AK119ub1 enrichment detected by the ChIP-seq analysis. The fold enrichment values of H2AK119ub1 signals were calculated against the input signals (ChIP/input, RPKM+0.1) around the TSS (±2 kb) of RefSeq genes in WT and ΔCxxC DP thymocytes 8 weeks after the tamoxifen treatment and ΔCxxC DP T-ALL cells with a Notch1 active mutation in exon 34. Left, all RefSeq genes; right, KDM2B target genes (cluster 1 genes) that were defined by the K-means clustering of 3xFLAG-KDM2B ChIP-seq data in Figure 4B. (B) Scatter diagram of the H2AK119ub1 enrichment (ChIP/Input, RPKM+0.1 in log2) in ΔCxxC DP thymocytes (left) and T-ALL cells (right) vs WT DP cells. Representative direct target genes of NOTCH1 are shown as red dots. (C) A snapshot of 3xFLAG-KDM2B ChIP signals in DP thymocytes overexpressing 3xFLAG-KDM2B and H2AK119ub1 and H3K27me3 ChIP signals in WT and ΔCxxC DP thymocytes and ΔCxxC DP T-ALL cells at the Myc gene locus. The structures of the Myc gene are indicated at the bottom. (D) ChIP quantitative PCR assays of KDM2B (left) and H2AK119ub1 levels (right) around Myc TSS. The cells used were WT and 3xFLAG-KDM2B-overexpressing DP thymocytes for KDM2B and WT and ΔCxxC DP thymocytes and ΔCxxC DP T-ALL cells for H2AK119ub1. The relative amounts of immunoprecipitated DNA are depicted as a percentage of input DNA. Data are shown as means ± SEM (n = 3). (E) Venn diagram of KDM2B and BCOR target genes in DP thymocytes and NOTCH1 target genes in T-ALL cells at the promoter region. Target genes were defined by a peak-calling analysis around TSS. Peaks were called using MACS2 v2.1.1 with a q value <0.05 for KDM2B, <0.2 for BCOR, and <10−10 for NOTCH1. All P values for the pairwise comparisons were <.0001 by Fisher's exact test. (F-G) Summary of H3K27me3 and EZH2 enrichment detected by the ChIP-seq analysis. The fold enrichment values of the H3K27me3 and EZH2 signals were calculated against the input signals (ChIP/input, RPKM+0.1) around the TSS (±2 kb) of RefSeq genes in WT and ΔCxxC DP thymocytes and ΔCxxC DP T-ALL cells. (H) Venn diagram of KDM2B and EZH2 target genes in DP thymocytes and NOTCH1 target genes in T-ALL cells around TSS (±2 kb). Peaks were called using MACS2 v2.1.1 with a q value <0.05 for KDM2B and EZH2 and <10−10 for NOTCH1. All P values for the pairwise comparisons were <.0001 by Fisher's exact test. (I) KEGG pathway analysis of the 1276 genes that have all peaks (KDM2B, EZH2, and NOTCH1) in Figure 6H (designated as overlapping genes). (J) H3K27me3 and H3K4me3 levels in EZH2 targets. The fold enrichment values of H3K27me3 signals were calculated against the input signals (ChIP/input, RPKM+0.1) around the TSS (±2 kb) of 1276 overlapping genes and 1182 EZH2 target genes without KDM2B and NOTCH1 binding in Figure 6H (designated as EZH2 only) in WT DP thymocytes. *P < .05; **P < .01; ***P < .001 by Student t test.
PRC1.1 and PRC2 antagonize NOTCH1 in the development of T-ALL. (A) Summary of H2AK119ub1 enrichment detected by the ChIP-seq analysis. The fold enrichment values of H2AK119ub1 signals were calculated against the input signals (ChIP/input, RPKM+0.1) around the TSS (±2 kb) of RefSeq genes in WT and ΔCxxC DP thymocytes 8 weeks after the tamoxifen treatment and ΔCxxC DP T-ALL cells with a Notch1 active mutation in exon 34. Left, all RefSeq genes; right, KDM2B target genes (cluster 1 genes) that were defined by the K-means clustering of 3xFLAG-KDM2B ChIP-seq data in Figure 4B. (B) Scatter diagram of the H2AK119ub1 enrichment (ChIP/Input, RPKM+0.1 in log2) in ΔCxxC DP thymocytes (left) and T-ALL cells (right) vs WT DP cells. Representative direct target genes of NOTCH1 are shown as red dots. (C) A snapshot of 3xFLAG-KDM2B ChIP signals in DP thymocytes overexpressing 3xFLAG-KDM2B and H2AK119ub1 and H3K27me3 ChIP signals in WT and ΔCxxC DP thymocytes and ΔCxxC DP T-ALL cells at the Myc gene locus. The structures of the Myc gene are indicated at the bottom. (D) ChIP quantitative PCR assays of KDM2B (left) and H2AK119ub1 levels (right) around Myc TSS. The cells used were WT and 3xFLAG-KDM2B-overexpressing DP thymocytes for KDM2B and WT and ΔCxxC DP thymocytes and ΔCxxC DP T-ALL cells for H2AK119ub1. The relative amounts of immunoprecipitated DNA are depicted as a percentage of input DNA. Data are shown as means ± SEM (n = 3). (E) Venn diagram of KDM2B and BCOR target genes in DP thymocytes and NOTCH1 target genes in T-ALL cells at the promoter region. Target genes were defined by a peak-calling analysis around TSS. Peaks were called using MACS2 v2.1.1 with a q value <0.05 for KDM2B, <0.2 for BCOR, and <10−10 for NOTCH1. All P values for the pairwise comparisons were <.0001 by Fisher's exact test. (F-G) Summary of H3K27me3 and EZH2 enrichment detected by the ChIP-seq analysis. The fold enrichment values of the H3K27me3 and EZH2 signals were calculated against the input signals (ChIP/input, RPKM+0.1) around the TSS (±2 kb) of RefSeq genes in WT and ΔCxxC DP thymocytes and ΔCxxC DP T-ALL cells. (H) Venn diagram of KDM2B and EZH2 target genes in DP thymocytes and NOTCH1 target genes in T-ALL cells around TSS (±2 kb). Peaks were called using MACS2 v2.1.1 with a q value <0.05 for KDM2B and EZH2 and <10−10 for NOTCH1. All P values for the pairwise comparisons were <.0001 by Fisher's exact test. (I) KEGG pathway analysis of the 1276 genes that have all peaks (KDM2B, EZH2, and NOTCH1) in Figure 6H (designated as overlapping genes). (J) H3K27me3 and H3K4me3 levels in EZH2 targets. The fold enrichment values of H3K27me3 signals were calculated against the input signals (ChIP/input, RPKM+0.1) around the TSS (±2 kb) of 1276 overlapping genes and 1182 EZH2 target genes without KDM2B and NOTCH1 binding in Figure 6H (designated as EZH2 only) in WT DP thymocytes. *P < .05; **P < .01; ***P < .001 by Student t test.
Role of KDM2B in the maintenance of T-ALL
Our study indicates that KDM2B in PRC1.1 works as a tumor suppressor in the initiation of T-ALL; however, a previous study demonstrated an oncogenic role of KDM2B in the maintenance of T-ALL.13 Therefore, we evaluated the function of KDM2B in the maintenance of human T-ALL cell lines and a T-ALL cell line that we established from ΔCxxC T-ALL. We first knocked down KDM2B in human T-ALL cell lines by expressing a short hairpin RNA against KDM2B.33 We used Jurkat cells, in which NOTCH1 is activated because of a FBXW7 mutation, and TALL-1 cells, in which NOTCH1 is not activated. KDM2B knockdown significantly impaired cell growth of both cell lines (Figure 6A; supplemental Figure 5A). We next took an advantage of a T-ALL cell line, designated as ΔCxxC T-ALL, that we established from T-ALL cells developed in ΔCxxC mice. NOTCH1 is active in these cells (supplemental Figure 5B), although we failed to detect Notch1 mutations in original T-ALL cells in the initial screening shown in Figure 2 (data not shown). Next, we reexpressed KDM2B with triple tandem repeats of the FLAG epitope (3xFLAG-KDM2B) in ΔCxxC T-ALL cells using a retrovirus (supplemental Figure 5B). KDM2B add-back significantly enhanced the growth of ΔCxxC T-ALL cells in culture (Figure 6B). Although KDM2B add-back in ΔCxxC T-ALL cells moderately promoted the induction of lethal T-ALL in sublethally irradiated recipient mice, it did not significantly shorten the survival of the mice (Figure 6C). These results suggest a role of KDM2B in the maintenance of T-ALL cells as previously reported.13 We then performed RNA-seq of KDM2B-depleted human T-ALL cells and ΔCxxC T-ALL cells with KDM2B add-back. Unexpectedly, the depletion or restoration of KDM2B in T-ALL cells did not activate or repress of NOTCH1 target genes, respectively (Figure 6D). These results indicate that the modulation of KDM2B-containing PRC1.1 function has little impact on the expression of NOTCH1 target genes, once their expression patterns have already been established during leukemic transformation.
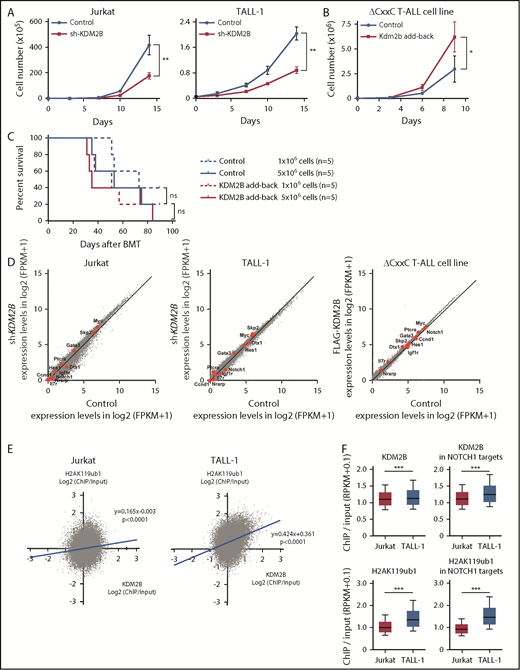
KDM2B is required for the maintenance of T-ALL. (A) In vitro proliferation of human T-ALL cell lines after the knockdown of KDM2B. mCherry tagged sh-KDM2B or control sh-SCR viruses were transduced into human T-ALL cell lines with (Jurkat) and without (TALL-1) NOTCH1 activation. mCherry positive cells were isolated by cell sorting. Data are shown as the mean ± SEM of triplicate cultures. (B) In vitro proliferation of mouse ΔCxxC T-ALL cells after the overexpression of KDM2B. GFP-tagged 3xFLAG-Kdm2b or control viruses were transduced into ΔCxxC T-ALL cells immortalized from primary ΔCxxC T-ALL cells. GFP+ cells were isolated by cell sorting. Data are presented as the mean ± SEM of triplicate cultures. (C) Kaplan-Meier survival curves of the sublethally irradiated recipient mice infused with ΔCxxC T-ALL cells with or without KDM2B add-back. A total of 1 or 5 × 10⁶ cells were transplanted into each recipient. (D) Scatter diagram showing RNA-seq data. Signal levels of RefSeq genes (FPKM+1 in log2) in control and KDM2B knockdown human T-ALL cell lines are plotted. Representative direct target genes of NOTCH1 are shown as red dots. (E) Scatter diagram of the H2AK119ub1 and KDM2B enrichment (ChIP/input, RPKM+0.1 in log2) in human T-ALL cells. (F) Summary of KDM2B binding and H2AK119ub1 levels detected by the ChIP-seq analysis. The fold enrichment values of KDM2B and H2AK119ub1 ChIP signals were calculated against the input signals (ChIP/input, RPKM+0.1) around the TSS (±2 kb) of RefSeq genes in Jurkat and TALL-1 cells. Left, all RefSeq genes; right, NOTCH1 target genes in DP T-ALL cells defined by the previous study.32 *P < .05; **P < .01; ***P < .001 by Student t test.
KDM2B is required for the maintenance of T-ALL. (A) In vitro proliferation of human T-ALL cell lines after the knockdown of KDM2B. mCherry tagged sh-KDM2B or control sh-SCR viruses were transduced into human T-ALL cell lines with (Jurkat) and without (TALL-1) NOTCH1 activation. mCherry positive cells were isolated by cell sorting. Data are shown as the mean ± SEM of triplicate cultures. (B) In vitro proliferation of mouse ΔCxxC T-ALL cells after the overexpression of KDM2B. GFP-tagged 3xFLAG-Kdm2b or control viruses were transduced into ΔCxxC T-ALL cells immortalized from primary ΔCxxC T-ALL cells. GFP+ cells were isolated by cell sorting. Data are presented as the mean ± SEM of triplicate cultures. (C) Kaplan-Meier survival curves of the sublethally irradiated recipient mice infused with ΔCxxC T-ALL cells with or without KDM2B add-back. A total of 1 or 5 × 10⁶ cells were transplanted into each recipient. (D) Scatter diagram showing RNA-seq data. Signal levels of RefSeq genes (FPKM+1 in log2) in control and KDM2B knockdown human T-ALL cell lines are plotted. Representative direct target genes of NOTCH1 are shown as red dots. (E) Scatter diagram of the H2AK119ub1 and KDM2B enrichment (ChIP/input, RPKM+0.1 in log2) in human T-ALL cells. (F) Summary of KDM2B binding and H2AK119ub1 levels detected by the ChIP-seq analysis. The fold enrichment values of KDM2B and H2AK119ub1 ChIP signals were calculated against the input signals (ChIP/input, RPKM+0.1) around the TSS (±2 kb) of RefSeq genes in Jurkat and TALL-1 cells. Left, all RefSeq genes; right, NOTCH1 target genes in DP T-ALL cells defined by the previous study.32 *P < .05; **P < .01; ***P < .001 by Student t test.
We then compared the KDM2B binding and H2AK119ub1 levels at the promoter regions of RefSeq genes (TSS ± 2.0 kb) in NOTCH1 active Jurkat cells and NOTCH1 inactive TALL-1 cells. KDM2B bindings were well associated with the H2AK119ub1 levels, particularly in NOTCH1 inactive TALL-1 cells (Figure 6E). Of interest, the enrichment of KDM2B and H2AK119ub1 ChIP signals were significantly attenuated in Jurkat cells compared with TALL-1 cells, particularly at the NOTCH1 target gene promoters (Figure 6F). These results indicate that activated NOTCH1 may antagonize KDM2B function, thereby inducing the reductions in H2AK119ub1 levels at the NOTCH1 target genes.
Discussion
In the present study, we analyzed mice lacking the ZF-CxxC DNA-binding domain of KDM2B. These mice exhibited severe lymphocytopenia in PB and decreased cell numbers of LSK HSPCs and lymphoid progenitors in BM, whereas myeloid cells in PB and myeloid progenitors in BM were maintained. A previous study using a different type of Kdm2b knockout mouse that harbored LoxP sites flanking Kdm2b exons 16-19, whose Cre-mediated recombination resulted in the deletion of all protein-coding isoforms of Kdm2b by out-of-frame transcription, also showed severely impaired lymphopoiesis and the maintenance of myeloid progenitors.13 These findings clearly indicated a critical role for KDM2B in the lineage commitment and differentiation of HSPCs. On the other hand, although the previous study showed significant reductions in long-term HSCs in BM,13 our mice maintained almost normal HSC numbers. This may be attributed to the different modes of KDM2B dysfunction due to different Kdm2b knockout designs, with the present model being milder than that in the previous study. Because KDM2B protein expression was reduced by ∼50% (supplemental Figure 1D), the reduced histone H3K36 demethylase activity of KDM2B, which is independent of the PRC function, may also have played a potential role in maintaining long-term HSCs as well as T-ALL development in ΔCxxC mice.
We previously found that mice lacking the BCL6-binding domain as well as the PCGF1-binding domain of BCOR developed T-ALL in a NOTCH1-dependent manner,27,28 suggesting that BCOR exerts its tumor suppressor function as a corepressor for BCL6 as well as a component of PRC1.1.34 As expected, mice lacking the ZF-CxxC DNA-binding domain of KDM2B developed T-ALL in a similar manner to Bcor insufficient mice, supporting an essential role for PRC1.1 in preventing the leukemic transformation of thymocytes. However, our results do not negate the contribution of BCL6 in this process. Our results suggest that BCOR mediates the collaboration of 2 repressive complexes, BCL6 and PRC1.1, to enforce the transcriptional repression of genes promoting transformation, including the direct target genes of NOTCH1. This may be the reason pathogenic mutations in PRC1.1 were confined to BCOR and BCORL1.19,26 To date, KDM2B mutations have not yet been identified in patients with T-ALL. As shown in the present study, Kdm2b insufficiency compromised the production and differentiation of HSPCs and severely impaired lymphopoiesis, providing a limited opportunity for the transformation of T-cell lineage cells. In contrast, mice lacking the PCGF1-binding domain of BCOR did not show any evident defects in T lymphopoiesis,28 thereby providing more opportunities for transformation. This may be because BCORL1 partially compensates for BCOR. BCOR and BCORL1 mutations are mutually exclusive.
KDM2B target promoters in DP thymocytes closely overlapped with those of EZH2 in DP thymocytes and NOTCH1 targets in human T-ALL cells. These findings suggest that PRC1.1, PRC2, and NOTCH1 frequently coexist at the promotor region of their target genes in DP thymocytes. We also identified that a NOTCH1 active human T-ALL cell line showed weaker KDM2B binding and lower H2AK119ub1 levels than a human T-ALL cell line without NOTCH1 activation. Because oncogenic NOTCH1 mutants have been shown to antagonize the functions of PRC2,16 they may also affect PRC1.1 function to fully activate the NOTCH1 transcriptional program.
KDM2B target genes, particularly those shared with EZH2 and NOTCH1, showed lower levels of H3K27me3 in thymocytes than the others. Because these regions may not efficiently recruit canonical PRC1 because of the low levels of H3K27me3, PRC1.1 may play a major role in restricting the aberrant transcriptional activation of its target genes, including NOTCH1 targets. Many of these genes were already active or primed for activation and included genes associated with T-cell development, proliferation, and oncogenesis. Thus, the dysfunction of PRC1.1 may induce the derepression of these genes, thereby initiating the pathogenesis of T-cell malignancies that eventually leads to the acquisition of activating Notch1 mutations. The present results together with our previous findings in Bcor insufficient mice27,28 strongly indicate that the PRC1.1 insufficient state facilitates the acquisition of activating Notch1 mutations that promote the development of T-ALL.
As described previously, Andricovich et al reported that KDM2B is expressed in T-ALL cells and KDM2B knockdown inhibits the growth of many T-ALL cell lines, suggesting an oncogenic role of KDM2B in the maintenance of T-ALL cells.13 Our KDM2B knockdown and overexpression experiments also supported a positive effect of KDM2B on the maintenance of T-ALL cells, contrary to its tumor suppressive effect on the initiation of T-ALL. Recently, EZH2 has been reported to have a contrastive role in the initiation and maintenance of AML. While EZH2 acts as a tumor suppressor during AML induction, it has an oncogenic function during disease maintenance.35 Our results suggest that KDM2B also have a dual role in the initiation and maintenance of T-ALL.
RNA sequence and chromatin immunoprecipitation sequence data were deposited in the DNA Data Bank of Japan (accession number DRA008519).
The full-text version of this article contains a data supplement.
Acknowledgments
The authors thank J. J. Schuringa for providing us with sh-KDM2B vectors, and S. Tara, D. Shinoda, K. Kayamori, W. Kuribayashi, and Y. Miyoda for their technical assistance. The super-computing resource was provided by the Human Genome Center, the Institute of Medical Science, the University of Tokyo.
This work was supported in part by Grants-in-Aid for Scientific Research (#18K19555) and Scientific Research on Innovative Areas “Stem Cell Aging and Disease” (#26115002) from MEXT, Japan, and grants from the Takeda Science Foundation and the Princess Takamatsu Cancer Research Fund.
Authorship
Contribution: Y.I. performed experiments, analyzed results, made figures, and actively wrote the manuscript; Y.N.-T., M.O., K.A., M.R., S.K., A.S., E.S., C.N., and K.Y. assisted with experiments; T.K. and H.K. generated mice; and A.I. conceived of and directed the study, secured funding, and actively wrote the manuscript.
Conflict-of-interest disclosure: The authors declare no competing financial interests.
Correspondence: Atsushi Iwama, Division of Stem Cell and Molecular Medicine, Center for Stem Cell Biology and Regenerative Medicine, The Institute of Medical Science, The University of Tokyo, 4-6-1 Shirokanedai, Minato-ku, Tokyo 108-8639, Japan; e-mail: 03aiwama@ims.u-tokyo.ac.jp.

