

Key Points
Gdf15−/− mice fail to expand stress erythroid progenitors in response to anemic stress, in part because of defects in the splenic niche.
Gdf15 regulates hypoxia dependent transcription, affecting niche Bmp4 expression and the metabolism of stress erythroid progenitors.

Abstract
Anemic stress induces the proliferation of stress erythroid progenitors in the murine spleen that subsequently differentiate to generate erythrocytes to maintain homeostasis. This process relies on the interaction between stress erythroid progenitors and the signals generated in the splenic erythroid niche. In this study, we demonstrate that although growth-differentiation factor 15 (Gdf15) is not required for steady-state erythropoiesis, it plays an essential role in stress erythropoiesis. Gdf15 acts at 2 levels. In the splenic niche, Gdf15−/− mice exhibit defects in the monocyte-derived expansion of the splenic niche, resulting in impaired proliferation of stress erythroid progenitors and production of stress burst forming unit-erythroid cells. Furthermore, Gdf15 signaling maintains the hypoxia-dependent expression of the niche signal, Bmp4, whereas in stress erythroid progenitors, Gdf15 signaling regulates the expression of metabolic enzymes, which contribute to the rapid proliferation of stress erythroid progenitors. Thus, Gdf15 functions as a comprehensive regulator that coordinates the stress erythroid microenvironment with the metabolic status of progenitors to promote stress erythropoiesis.
Introduction
Stress erythropoiesis is a tightly regulated physiological response to anemic stress. It is distinct from steady-state erythropoiesis. This process is best understood in mice, where it extramedullary occurs in the adult spleen and liver. It is mediated by distinct signals and relies on the mobilization, proliferation, and differentiation of specialized populations of stress erythroid progenitors (SEPs).1 One of the key signals that regulates stress erythropoiesis is bone morphogenetic protein 4 (Bmp4), a member of transforming growth factor-β superfamily. Mutations that affect Bmp4 signaling cause defects in erythroid recovery from anemia.2 During stress erythropoiesis, Bmp4 acts in concert with stem cell factor and hypoxia on immature erythroid progenitors to promote the proliferation and differentiation of stress burst forming unit-erythroid cells (BFU-Es).3 Another divergent transforming growth factor-β superfamily member, growth-differentiation factor 15 (Gdf15), has been intensively studied in obesity, cancer, chronic inflammatory disease, and for its regulatory roles on iron metabolism in thalassemia major patients.4-9 In vitro analysis demonstrated that Gdf15 is required for the proliferation of murine and human SEPs.10 However, the in vivo role of Gdf15 during the recovery from anemic stress is poorly understood.
Stress erythropoiesis occurs in a specialized microenvironment in the murine spleen. SEPs develop in close contact with macrophages and this interaction is required for proper development both in vitro and in vivo.10-12 During stress erythropoiesis, inflammatory monocytes (CD11b+Ly6C+Ly6Gneg) are recruited to the spleen by chemokines secreted from spleen resident red pulp macrophages (RPMs). These monocytes develop into niche macrophages, a process associated with increased Spic expression.13 Concurrent with the recruitment and differentiation of monocytes is their interaction with immature SEPs to form erythroblastic islands (EBIs). Within this specialized niche, the immature SEPs proliferate and differentiate in concert with the maturation of monocyte/macrophages in the EBIs, which underscores the coordination of proliferation and differentiation of SEPs with the development of the niche.14
In this study, we show that lack of Gdf15 remarkably impaired stress erythropoiesis in vivo and in vitro. Gdf15−/− mice exhibit defects in the development of monocyte-derived splenic microenvironment, leading to a failure to promote the proliferation of early SEPs and the production of stress BFU-E. Gdf15 regulates this process in part by maintaining hypoxia-dependent transcription via inhibition of von Hippel-Lindau tumor suppressor (Vhl). In the niche, this repression leads to the maintenance of Bmp4 expression, whereas in progenitor cells, Gdf15 upregulates the hypoxia-dependent expression of key metabolic enzymes regulating glycolysis and glutaminolysis, which meets the demand for anabolic intermediates that promote the proliferation of SEPs.
Materials and Methods
Detailed experimental design and methods are described in the supplemental Methods.
Mice
C57BL/6 (CD45.2+) were used as wild-type (WT) controls, and C57BL/6-Gdf15−/− (Gdf15−/−) mice were provided by Se-jin Lee.15 C57BL/6, B6.SJL-PtprcaPepcb/BoyJ (CD45.1+), and C57BL/6-Tg(UBC-GFP)30Scha/J (GFP+) mice were purchased from The Jackson Laboratory. Mice were 8 to 12 weeks old when experiments were performed. The Institutional Animal Use and Care Committee at The Pennsylvania State University approved all procedures.
Bone marrow transplant and phenylhydrazine challenge
The 5×10⁵ donor unfractionated bone marrow (BM) cells were transplanted into lethally irradiated recipients as previously described.16,17 Acute hemolytic anemia was induced by intraperitoneal injection of phenylhydrazine (PHZ) at a concentration of 100 mg/kg or 75 mg/kg body weight in phosphate-buffered saline buffer.
Monocyte enrichment assay
WT BM monocytes were isolated by EasySep Mouse Monocyte Enrichment kit (Stem Cell Technologies). After enrichment, purity of CD11b+Ly6C+ monocytes was >70%. The enriched WT monocytes were added to in vitro Gdf15−/− BM cultures at a concentration of 5.5 × 10⁴/mL culture media.
Statistical analysis
Significance tests were performed with Student t test or 1-way analysis of variance followed by Tukey comparison. P ≤ .05 was considered significant.
Results
Gdf15 signaling is required for recovery from anemic stress but not for steady-state erythropoiesis
Stress erythropoiesis plays an essential role in the recovery from PHZ-induced acute hemolytic anemia.2 C57BL/6 WT control mice completely recover from a standard dose of PHZ, 100 mg/kg body weight, within 8 days.18 Although Gdf15−/− mice showed no defects in steady-state erythropoiesis (Figure 1A), they failed to survive from full-dose PHZ treatment (Figure 1B). When a lower dose of PHZ, 75 mg/kg body weight, was used, only 40% of the Gdf15−/− mice survived (Figure 1B). Analysis of the surviving mice showed that they exhibited a delayed recovery with respect to hematocrit compared with WT animals (Figure 1C). This delayed recovery was associated with smaller spleens, decreased numbers of stress BFU-E colonies in spleen, and smaller colony sizes at key time points after PHZ treatment (Figure 1D-F). Furthermore, Gdf15−/− did not exhibit any differences in BM nor liver erythropoiesis compared with WT controls (supplemental Figure 1).

Gdf15 signaling is required for recovery from PHZ induced acute anemia. (A) Steady-state erythropoiesis is represented by red blood cell (RBC) counts, hemoglobin (Hb) concentrations, and hematocrit levels. n = 9 for WT and n = 11 for Gdf15−/−. Data are shown as individual subject and the mean ± standard error of the mean (SEM). (B-F) Analysis of recovery from PHZ-induced acute anemia. (B) Survival analysis of WT and Gdf15−/− after receiving different doses of PHZ with P = .0019 when Gdf15−/− is compared with control (Gehan-Breslow-Wilcoxon test). (C) Hematocrit levels during the entire recovery period. Each time point reflects >5 mice analyzed. Data are shown as the mean ± SEM. (D) Spleen weights at key time points during recovery. (E-F) Spleen stress BFU-E assay was conducted at key time points following PHZ injection. (E) Quantification of stress BFU-E colonies. (F) Representative images of stress BFU-E colonies of WT and Gdf15−/− mice. Pictures were taken with 40× magnification using an Olympus CK40 microscope. Each time point reflects >3 mice analyzed. Data are shown as individual subject and the mean ± SEM. *P < .05, **P < .01, and ***P < .001.
Gdf15 signaling is required for recovery from PHZ induced acute anemia. (A) Steady-state erythropoiesis is represented by red blood cell (RBC) counts, hemoglobin (Hb) concentrations, and hematocrit levels. n = 9 for WT and n = 11 for Gdf15−/−. Data are shown as individual subject and the mean ± standard error of the mean (SEM). (B-F) Analysis of recovery from PHZ-induced acute anemia. (B) Survival analysis of WT and Gdf15−/− after receiving different doses of PHZ with P = .0019 when Gdf15−/− is compared with control (Gehan-Breslow-Wilcoxon test). (C) Hematocrit levels during the entire recovery period. Each time point reflects >5 mice analyzed. Data are shown as the mean ± SEM. (D) Spleen weights at key time points during recovery. (E-F) Spleen stress BFU-E assay was conducted at key time points following PHZ injection. (E) Quantification of stress BFU-E colonies. (F) Representative images of stress BFU-E colonies of WT and Gdf15−/− mice. Pictures were taken with 40× magnification using an Olympus CK40 microscope. Each time point reflects >3 mice analyzed. Data are shown as individual subject and the mean ± SEM. *P < .05, **P < .01, and ***P < .001.
To further analyze the role of Gdf15 signaling in stress erythropoiesis, we used a second in vivo experimental system, BM transplant (BMT). In the immediate posttransplant period before the engraftment of donor hematopoietic stem cells, erythrocytes, platelets, and neutrophils must be generated to provide short-term radioprotective cells.19,20 Gdf15 messenger RNA (mRNA) expression is elevated in the spleen with peaks at day 4 and day 10 after transplant.10 In fact, Gdf15 expression was induced immediately following irradiation (supplemental Figure 2). We assessed the role of Gdf15 signaling in regulating stress erythropoiesis by transplanting Gdf15−/− or WT donor BM cells into lethally irradiated WT mice. The recipients, which received Gdf15−/− BM, could not survive more than 18 days after transplant, whereas the majority of them failed to survive for 10 days (Figure 2A). Analysis of complete blood counts confirmed that the Gdf15−/−-BM recipients developed a lethal anemia resulting from insufficient production of erythrocytes (Figure 2B). In addition, recovery of white blood cells in general, and platelets and neutrophils in particular, were delayed, suggesting that Gdf15 deficiency of donor BM cells have impaired capacity of generating cells of other lineages as well (supplemental Figure 3).
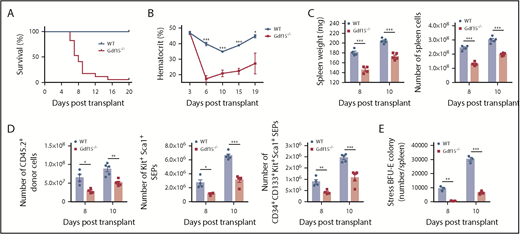
Gdf15 signaling is required for erythroid short-term radioprotection following bone marrow transplant. Analysis of short-term radioprotection by WT or Gdf15−/− bone marrow cells following transplant into lethally irradiated recipients. (A) Survival curve with P < .001 (Gehan-Breslow-Wilcoxon test). Data are representative of 4 individual transplants with total n = 9 for WT and n = 16 for Gdf15−/−. (B) Hematocrit levels during the recovery period. Each time point reflects >5 mice analyzed. Data are shown as the mean ± SEM. (C-E) Donor mice were CD45.2 and recipient mice were CD45.1. Spleens were isolated at day 8 and day 10 post-BMT for analysis. (C) Analysis of the proliferation of cell in the spleen following transplant, spleen weight (left), and total cell number (right) on the indicated days after transplant are shown. (D) Analysis of donor cell proliferation, total CD45.2+ donor cells (left), Kit+Sca1+ progenitors (middle), and CD34+CD133+Kit+Sca1+ progenitors (right) in each spleen. (E) Number of stress BFU-E in the spleen on the indicated days after transplant. Each time point reflects >3 mice analyzed. Data are shown as individual subject and the mean ± SEM. *P < .05, **P < .01, and *** P < .001.
Gdf15 signaling is required for erythroid short-term radioprotection following bone marrow transplant. Analysis of short-term radioprotection by WT or Gdf15−/− bone marrow cells following transplant into lethally irradiated recipients. (A) Survival curve with P < .001 (Gehan-Breslow-Wilcoxon test). Data are representative of 4 individual transplants with total n = 9 for WT and n = 16 for Gdf15−/−. (B) Hematocrit levels during the recovery period. Each time point reflects >5 mice analyzed. Data are shown as the mean ± SEM. (C-E) Donor mice were CD45.2 and recipient mice were CD45.1. Spleens were isolated at day 8 and day 10 post-BMT for analysis. (C) Analysis of the proliferation of cell in the spleen following transplant, spleen weight (left), and total cell number (right) on the indicated days after transplant are shown. (D) Analysis of donor cell proliferation, total CD45.2+ donor cells (left), Kit+Sca1+ progenitors (middle), and CD34+CD133+Kit+Sca1+ progenitors (right) in each spleen. (E) Number of stress BFU-E in the spleen on the indicated days after transplant. Each time point reflects >3 mice analyzed. Data are shown as individual subject and the mean ± SEM. *P < .05, **P < .01, and *** P < .001.
The initial step in stress erythropoiesis following BMT is the migration of CD34+Kit+Sca1+Lin− cells to spleen, followed by the expansion of the immature progenitor population before differentiation. To assess the possibility that Gdf15−/− BM cells fail to home to spleen niche, WT or Gdf15−/− BM were transplanted into lethally irradiated GFP+ recipient mice. Equivalent numbers of WT or Gdf15−/− donor cells in the spleen on day 2 following transplant demonstrated normal homing to spleen (supplemental Figure 4A-B), suggesting that the defect of Gdf15−/− donor cells is in proliferation of immature progenitors.
In control transplant experiments, donor SEPs proliferate in the spleen, where they reach a peak at day 12. From days 4 to 10 after transplant, the predominant population is the most immature SEPs (CD34+CD133+Kit+Sca1+), which are later replaced by more mature CD34negCD133negKit+Sca1+ cells.10 The proper expansion of these SEP populations is required to generate enough stress BFU-Es for the generation of erythrocytes. When we analyzed mice transplanted with Gdf15−/− donor cells, they had significantly smaller spleens and decreased numbers of spleen cells at day 8 and day 10 posttransplant compared with the control group (Figure 2C). Mice transplanted with Gdf15−/− donor cells exhibited inadequate expansion of Kit+Sca1+ SEP population in general and CD34+CD133+Kit+Sca1+ SEP population in particular in the spleen at both time points (Figure 2D). Because of this defect in proliferation, stress BFU-E formation ability was impaired at those time points (Figure 2E). Increased erythropoietin (EPO) production by the kidney is a key feature of erythroid recovery following BMT. We determined that EPO induction was delayed in survived Gdf15−/−-BM recipients, which may contribute to insufficient recovery (supplemental Figure 4C). Collectively, these data support the idea that Gdf15−/− SEPs fail to proliferate in the spleen, which leads to a severe reduction in stress BFU-Es and lethal anemia following erythroid challenge.
Gdf15−/− mice exhibit defects in the splenic stress erythroid niche
Previous studies showed that addition of GDF15 to human or murine BM cultures was required for the expansion of stress BFU-E population.10 In addition to progenitor cells expressing Gdf15,21 we observed Gdf15 expression in stromal cells in BM culture (Figure 3A). When we analyzed expansion culture of BM cells, consistent with our observations in BMT experiments, Gdf15−/− cultures contained significantly fewer Kit+Sca1+ SEPs and CD34+CD133+Kit+Sca1+ cells compared with WT (Figure 3B-E). To monitor proliferation status, we repeated the cultures but first labeled cells with the fluorescent membrane dye PKH26 and used loss of PKH26 fluorescence to measure proliferation. Highly proliferative PKH26lo cells were primarily the more mature CD133negKit+Sca1+ population, whereas the slower dividing PKH26hi cells were the more immature CD133+Kit+Sca1+ SEPs. Similar to what we observed in vivo, loss of Gdf15 impaired both populations (Figure 3G-H). Unexpectedly, addition of GDF15 to culture media could not rescue Gdf15−/− deficiency (supplemental Figure 5), suggesting that Gdf15−/− BM exhibited intrinsic defects.

Mutation of Gdf15 impairs expansion of stress erythroid progenitors in vitro. (A) Analysis of relative Gdf15 expression levels in unfractionated bone marrow (control), isolated erythroid progenitors (progenitors), and stromal cells (stroma) after 7 days of SEEM culture. One-way analysis of variance followed by Tukey pairwise comparison was performed. (B-E) Unfractionated WT or Gdf15−/− bone marrow cells were cultured for 7 days in SEEM. Nonadherent SEPs were collected and stained with fluorescent anti-Kit, anti-Sca1, and anti-CD133 antibodies. (B) Flow gating strategy schematic. (C) Representative flow cytometry analysis. (D) Percentage (left) and total number (right) of Kit+Sca1+ cells. (E) Percentage (left) and total number (right) of CD34+CD133+Kit+Sca1+ cells, Data are shown as individual subject and the mean ± SEM. (F-H) Unfractionated WT or Gdf15−/− bone marrow cells were labeled with PKH26 dye at the beginning of a 5-day culture in SEEM. (F) Schematic of the gating strategy. (G) Representative flow cytometry analysis. (H) Percentage of PKH26loCD133negKit+Sca1+ cells (top) and PKH26hiCD133+Kit+Sca1+ cells (bottom). Data are shown as individual subject and the mean ± SEM. *P < .05, **P < .01, and ***P < .001. ns, not significant.
Mutation of Gdf15 impairs expansion of stress erythroid progenitors in vitro. (A) Analysis of relative Gdf15 expression levels in unfractionated bone marrow (control), isolated erythroid progenitors (progenitors), and stromal cells (stroma) after 7 days of SEEM culture. One-way analysis of variance followed by Tukey pairwise comparison was performed. (B-E) Unfractionated WT or Gdf15−/− bone marrow cells were cultured for 7 days in SEEM. Nonadherent SEPs were collected and stained with fluorescent anti-Kit, anti-Sca1, and anti-CD133 antibodies. (B) Flow gating strategy schematic. (C) Representative flow cytometry analysis. (D) Percentage (left) and total number (right) of Kit+Sca1+ cells. (E) Percentage (left) and total number (right) of CD34+CD133+Kit+Sca1+ cells, Data are shown as individual subject and the mean ± SEM. (F-H) Unfractionated WT or Gdf15−/− bone marrow cells were labeled with PKH26 dye at the beginning of a 5-day culture in SEEM. (F) Schematic of the gating strategy. (G) Representative flow cytometry analysis. (H) Percentage of PKH26loCD133negKit+Sca1+ cells (top) and PKH26hiCD133+Kit+Sca1+ cells (bottom). Data are shown as individual subject and the mean ± SEM. *P < .05, **P < .01, and ***P < .001. ns, not significant.
Inflammatory monocytes are recruited to the spleen to generate the stress erythroid niche. Analysis of Gdf15−/− mice at steady state demonstrated that they had fewer circulating monocytes in peripheral blood and moderately fewer CD11b+Ly6C+ monocytes in BM, despite having a similar percentage of monocyte progenitors (MoPs) and the number of colony-forming unit granulocyte-macrophages (CFU-GMs) in BM as WT controls (Figure 4A-B; supplemental Figure 6; supplemental Table 1). Although the number of CFU-GM colonies was similar, the size of Gdf15−/− colonies was smaller, suggesting that proliferation of MoPs is defective. We additionally confirmed that Gdf15−/− mice had fewer F4/80+Vcam1+ spleen resident RPMs at steady state (Figure 4C). Monocytes and macrophages are essential for efficient erythroid recovery from PHZ challenge.11 To determine whether the defects in the number of monocytes and ineffective proliferation of MoPs in Gdf15−/− mice would affect the development of splenic stress erythroid niche, we compared the mobilization of monocytes to the spleen of WT and Gdf15−/− mice after 75% dosage PHZ challenge. Previously, we showed that Ccl2 expressing inflammatory monocytes and RPMs initiate the development of the splenic niche.14 We observed fewer Ccl2+CD11b+Ly6C+ cells in the spleens of Gdf15−/− mice 24 hours after PHZ treatment (Figure 4D-E). These Ccl2+ monocytes in Gdf15−/− spleens expressed lower levels of F4/80, supporting the idea that they were less mature than WT Ccl2+ cells (Figure 4F). Despite the defect in Ccl2 expression, the overall percentages of monocytes and macrophages were not significantly different at 24-hour post-PHZ treatment (supplemental Figure 7). However, at 48 hours, Gdf15−/− mice exhibited more circulating monocytes that failed to infiltrate spleen when compared with WT (Figure 4G-H). Analysis of the splenic niche demonstrated that recruited Gdf15−/− monocytes exhibited impaired capacity to develop into F4/80+ macrophages, leading to accumulated CD11b+Ly6C+ monocytes, but decreases in F4/80+Vcam1+ and F4/80+CD169+ RPMs (Figure 4I-L). These data indicate that, at 48 hours after treatment, monocytes in WT mice are differentiating into EBI macrophages, whereas this development in Gdf15−/− mice is delayed (Figure 4M,O). The result of this defect is a significantly lower hematocrit at 48 hours in mutant mice. We also observed that the expression of Spic was decreased in Gdf15−/− mice, which is consistent with the delayed maturation (Figure 4N). Spic is regulated by heme dependent signaling.13,14,22 Gdf15−/− mice exhibited decreased expression of Hmox1 and CD163, which is consistent with defects in heme signaling (Figure 4N).

Gdf15−/−defects in steady state and in splenic niche after 75% dosage of PHZ challenge. (A) Analysis of the concentration and percentage of monocytes in the peripheral blood at steady state. n = 9 for WT and n = 11 for Gdf15−/−. (B) Analysis of F4/80−CD11b+Ly6C+ monocytes in the homeostatic bone marrow. (C) Flow cytometry analysis of steady-state spleen resident red pulp macrophages, F4/80+Vcam1+ (left) and percentage of F4/80+Vcam1+ cells (right). (D-N) WT and Gdf15−/− mice were challenged with 75 mg/kg body weight PHZ through intraperitoneal injection. (D-F) Spleen cells were collected 24 hours after PHZ injection and stained for intracellular Ccl2 and cell surface CD11b and Ly6C. (D) Percentage of Ccl2+ splenocytes. (E) Flow cytometry analysis of CD11b and Ly6C expression on Ccl2+ cells (left) and the percentage of CCL2+CD11b+Ly6C+ monocytes in the spleen (right). (F) MFI of F4/80 expression on CCL2+CD11b+Ly6C+ monocyte population. (G-N) Blood and spleens were collected 48 hours after PHZ challenge. (G) Hematocrit. (H) Monocyte frequency (left) and percentage (right) in peripheral blood. (I) Flow cytometry analysis of spleen cells stained with anti-F4/80, anti-CD11b and anti-Ly6C antibodies (left) and the percentage of CD11b+Ly6C+ monocytes in the spleen (right). (J) The percentage of F4/80+CD11b−Ly6C− macrophages in the spleen. (K) Flow cytometry analysis of macrophage surface markers, F4/80 and Vcam1 (left), and the percentage of F4/80+Vcam1+ red pulp macrophages. (L) Flow cytometry analysis CD169 expression in splenocytes (left) and the percentage of F4/80+CD169+ macrophages in the spleen. (M) Changes in macrophage and monocyte populations between 24-hour and 48-hour time points after PHZ treatment. Percentage of CD11b+Ly6C+ monocytes (far left), percentage of F4/80+CD11b−Ly6C− macrophages (mid-left), percentage of F4/80+Vcam1+ RPMs (mid-right) and percentage of F4/80+CD169+ macrophages (far right) are shown as fold changes. (N) Change in relative expression levels of CD163, Hmox1, and Spic in the spleen between 24-hour and 48-hour time points are shown as fold changes. Data are shown as individual subject and the mean ± SEM. *P < .05, **P < .01, and ***P < .001. (O) Schematic of differences of monocyte mobilization in the peripheral blood, homing to the spleen, and monocytes differentiation into RPMs in WT and Gdf15−/− mice. MFI, mean fluorescent intensity.
Gdf15−/−defects in steady state and in splenic niche after 75% dosage of PHZ challenge. (A) Analysis of the concentration and percentage of monocytes in the peripheral blood at steady state. n = 9 for WT and n = 11 for Gdf15−/−. (B) Analysis of F4/80−CD11b+Ly6C+ monocytes in the homeostatic bone marrow. (C) Flow cytometry analysis of steady-state spleen resident red pulp macrophages, F4/80+Vcam1+ (left) and percentage of F4/80+Vcam1+ cells (right). (D-N) WT and Gdf15−/− mice were challenged with 75 mg/kg body weight PHZ through intraperitoneal injection. (D-F) Spleen cells were collected 24 hours after PHZ injection and stained for intracellular Ccl2 and cell surface CD11b and Ly6C. (D) Percentage of Ccl2+ splenocytes. (E) Flow cytometry analysis of CD11b and Ly6C expression on Ccl2+ cells (left) and the percentage of CCL2+CD11b+Ly6C+ monocytes in the spleen (right). (F) MFI of F4/80 expression on CCL2+CD11b+Ly6C+ monocyte population. (G-N) Blood and spleens were collected 48 hours after PHZ challenge. (G) Hematocrit. (H) Monocyte frequency (left) and percentage (right) in peripheral blood. (I) Flow cytometry analysis of spleen cells stained with anti-F4/80, anti-CD11b and anti-Ly6C antibodies (left) and the percentage of CD11b+Ly6C+ monocytes in the spleen (right). (J) The percentage of F4/80+CD11b−Ly6C− macrophages in the spleen. (K) Flow cytometry analysis of macrophage surface markers, F4/80 and Vcam1 (left), and the percentage of F4/80+Vcam1+ red pulp macrophages. (L) Flow cytometry analysis CD169 expression in splenocytes (left) and the percentage of F4/80+CD169+ macrophages in the spleen. (M) Changes in macrophage and monocyte populations between 24-hour and 48-hour time points after PHZ treatment. Percentage of CD11b+Ly6C+ monocytes (far left), percentage of F4/80+CD11b−Ly6C− macrophages (mid-left), percentage of F4/80+Vcam1+ RPMs (mid-right) and percentage of F4/80+CD169+ macrophages (far right) are shown as fold changes. (N) Change in relative expression levels of CD163, Hmox1, and Spic in the spleen between 24-hour and 48-hour time points are shown as fold changes. Data are shown as individual subject and the mean ± SEM. *P < .05, **P < .01, and ***P < .001. (O) Schematic of differences of monocyte mobilization in the peripheral blood, homing to the spleen, and monocytes differentiation into RPMs in WT and Gdf15−/− mice. MFI, mean fluorescent intensity.
Previous studies reported that CD14+ human monocytes, which correspond to CD11b+Ly6C+/lo mouse monocytes, positively influence CD34+ hematopoietic stem and progenitor cells survival, proliferation, and differentiation into erythroblasts during coculture.23-25 We next assayed whether Gdf15−/− in vitro cultures could be rescued by supplementing WT monocytes. These monocytes are able to give rise to F4/80+Vcam1+ macrophages in vitro (supplemental Figure 8). Addition of WT monocytes increased the percentages of Kit+Sca1+ and CD34+CD133+Kit+Sca1+ progenitors and the number of stress BFU-E generated (Figure 5A-E). We extended this analysis by performing coculture experiments, where WT or Gdf15−/− stromal cells were generated by culturing BM cells in SEEM media. These stromal cell layers were seeded with WT or Gdf15−/− progenitor cells. When WT progenitors were cultured on Gdf15−/− stroma, there were increased cell death and reduced production of Kit+Sca1+ SEPs, suggesting that Gdf15−/− stroma was less able to support the proliferation and survival of progenitors (Figure 5F-I), whereas WT stroma was able to rescue the expansion of Gdf15−/− Kit+Sca1+ progenitors. These data suggest that part of the defect in Gdf15−/− mice is due to the faulty development of erythroid niche.

Defects in Gdf15−/−stroma contribute to impaired expansion of SEPs in vitro. (A-E) Gdf15−/− BM cells were cultured in SEEM in vitro with or without the addition of WT CD11b+Ly6C+ monocyte (WT MO). After coculturing for 7 days, total cell numbers are presented in panel A. (B) Representative flow cytometry analysis of erythroid progenitor surface markers. (C) The percentages of Kit+Sca1+ SEPs (left) and absolute numbers of Kit+Sca1+ SEPs (right). (D) The percentages (left) and absolute numbers (right) of CD34+CD133+Kit+Sca1+ SEPs. Addition of WT monocytes promoted the expansion of Gdf15−/− SEPs. (E) Stress BFU-E colony production in cultures ± WT monocytes. (F-I) WT and Gdf15−/− BM cells were cultured in SEEM for 3 days. Nonadherent progenitor cells were collected with culture media and plated on the stromal layer of the indicated genotype. Progenitors were cultured for another 4 days before analysis. (F) Flow cytometry analysis of living vs dead progenitor cells. (G) Flow cytometry analysis of Kit+Sca1+ stress erythroid progenitors of the indicated genotype grown on the indicated stromal genotype. (H) Statistical analyses on percentages (left) and absolute numbers (right) of Kit+Sca1+ SEPs. (I) Statistical analyses on percentages (left) and absolute numbers (right) of CD34+CD133+Kit+Sca1+ SEPs. Data are shown as individual subject and the mean ± SEM. *P < .05, **P < .01, and ***P < .001.
Defects in Gdf15−/−stroma contribute to impaired expansion of SEPs in vitro. (A-E) Gdf15−/− BM cells were cultured in SEEM in vitro with or without the addition of WT CD11b+Ly6C+ monocyte (WT MO). After coculturing for 7 days, total cell numbers are presented in panel A. (B) Representative flow cytometry analysis of erythroid progenitor surface markers. (C) The percentages of Kit+Sca1+ SEPs (left) and absolute numbers of Kit+Sca1+ SEPs (right). (D) The percentages (left) and absolute numbers (right) of CD34+CD133+Kit+Sca1+ SEPs. Addition of WT monocytes promoted the expansion of Gdf15−/− SEPs. (E) Stress BFU-E colony production in cultures ± WT monocytes. (F-I) WT and Gdf15−/− BM cells were cultured in SEEM for 3 days. Nonadherent progenitor cells were collected with culture media and plated on the stromal layer of the indicated genotype. Progenitors were cultured for another 4 days before analysis. (F) Flow cytometry analysis of living vs dead progenitor cells. (G) Flow cytometry analysis of Kit+Sca1+ stress erythroid progenitors of the indicated genotype grown on the indicated stromal genotype. (H) Statistical analyses on percentages (left) and absolute numbers (right) of Kit+Sca1+ SEPs. (I) Statistical analyses on percentages (left) and absolute numbers (right) of CD34+CD133+Kit+Sca1+ SEPs. Data are shown as individual subject and the mean ± SEM. *P < .05, **P < .01, and ***P < .001.
Gdf15 maintains Bmp4 expression by repressing Vhl and stabilizing hypoxia-inducible factor 2α
Bmp4, a growth factor produced by erythroid niche, plays a key role in regulating stress erythropoiesis. The mRNA expression of Bmp4 in the spleen following BMT for the most part mirrors the expression of Gdf15 mRNA.10 However, Gdf15 mRNA increases within hours of irradiation, which is much earlier than Bmp4, suggesting that Gdf15 might regulate the expression of Bmp4. To test this hypothesis, WT or Gdf15−/− BM was transplanted to irradiated mice. Consistent with previous work of the laboratory,10 WT transplants exhibited an increase in Bmp4 expression in the spleen between days 4 and 10 after transplant. At early time points day 4 and 6, Gdf15−/− transplants exhibited less Bmp4 expression, but the difference was not statistically significant (Figure 6A). However, at later time points when WT transplants significantly increased Bmp4 expression in the spleen, the Gdf15−/− transplants exhibited significantly less expression. Similarly, when we analyzed Bmp4 expression in the spleen following PHZ administration, Gdf15−/− mice showed the greatest defect in Bmp4 expression at 36 hours (Figure 6B). These data suggest that in the absence of Gdf15, Bmp4 expression is induced but high-level expression is not maintained. Given the crucial role of Bmp4 in regulating stress erythropoiesis, our observation suggests that Gdf15 signaling may control Bmp4 expression. In cardiomyocytes, Gdf15 signaling is reported to induce the phosphorylation and activation of Smad2/3.26 However, we found no evidence that Gdf15-dependent activation of Smad2/3 regulates Bmp4 expression (data not shown).

Gdf15 signaling activates Hif2α-dependent Bmp4 expression via inhibition of Vhl during the recovery from anemia. (A-B) Analysis of relative mRNA expression levels of Bmp4 in the spleen at key time points during the recovery from BMT (A) and PHZ challenge (B), respectively. Each time point reflects >3 mice analyzed. Data are shown as individual subject and the mean ± SEM. (C) Primary spleen cells isolated from Gdf15−/− mice were treated ±10 ng/mL GDF15 for the indicated time. Relative Bmp4 and Vhl mRNA expression levels were determined by qRT-PCR. Each time point reflects >3 mice analyzed. Data are shown as individual subject and the mean ± SEM. (D) Primary spleen cells derived from Gdf15−/− mice were transduced with short hairpin RNAs targeting Vhl gene for 48 hours and then cultured in stress erythropoiesis media for 72 hours. Relative mRNA expression levels of Bmp4 and Vhl were analyzed by qRT-PCR. Each treatment was done in triplicate and the histogram is representative of 2 independent experiments. Data are shown as the mean ± SEM. (E-F) Analysis of relative mRNA expression levels of Vhl in the spleen at key time points during the recovery from (E) BMT and (F) PHZ challenge, respectively. Each time point reflects >3 mice analyzed. Data are shown as individual subject and the mean ± SEM. (G-H) Chromatin immunoprecipitation analysis of Hif2α binding to HRE4 of Bmp4 gene in the spleen during the recovery from BMT (G) and PHZ (H) treatment. Binding affinity is expressed as fraction of input DNA. Each time point reflects >3 mice analyzed. Data are shown as the mean ± SEM. (I-J) Analysis of Vhl and Hif2α protein expression in the spleen during the recovery from BMT (I) and PHZ (J) challenge, respectively. Western blots were probed with anti-VHL, anti-HIF2α, and anti-β-actin (control) antibodies. Three independent experiments were performed. In quantification graphs, data from 1 independent experiment are shown as individual subject and the mean ± SEM. *P < .05, **P < .01, and ***P < .001.
Gdf15 signaling activates Hif2α-dependent Bmp4 expression via inhibition of Vhl during the recovery from anemia. (A-B) Analysis of relative mRNA expression levels of Bmp4 in the spleen at key time points during the recovery from BMT (A) and PHZ challenge (B), respectively. Each time point reflects >3 mice analyzed. Data are shown as individual subject and the mean ± SEM. (C) Primary spleen cells isolated from Gdf15−/− mice were treated ±10 ng/mL GDF15 for the indicated time. Relative Bmp4 and Vhl mRNA expression levels were determined by qRT-PCR. Each time point reflects >3 mice analyzed. Data are shown as individual subject and the mean ± SEM. (D) Primary spleen cells derived from Gdf15−/− mice were transduced with short hairpin RNAs targeting Vhl gene for 48 hours and then cultured in stress erythropoiesis media for 72 hours. Relative mRNA expression levels of Bmp4 and Vhl were analyzed by qRT-PCR. Each treatment was done in triplicate and the histogram is representative of 2 independent experiments. Data are shown as the mean ± SEM. (E-F) Analysis of relative mRNA expression levels of Vhl in the spleen at key time points during the recovery from (E) BMT and (F) PHZ challenge, respectively. Each time point reflects >3 mice analyzed. Data are shown as individual subject and the mean ± SEM. (G-H) Chromatin immunoprecipitation analysis of Hif2α binding to HRE4 of Bmp4 gene in the spleen during the recovery from BMT (G) and PHZ (H) treatment. Binding affinity is expressed as fraction of input DNA. Each time point reflects >3 mice analyzed. Data are shown as the mean ± SEM. (I-J) Analysis of Vhl and Hif2α protein expression in the spleen during the recovery from BMT (I) and PHZ (J) challenge, respectively. Western blots were probed with anti-VHL, anti-HIF2α, and anti-β-actin (control) antibodies. Three independent experiments were performed. In quantification graphs, data from 1 independent experiment are shown as individual subject and the mean ± SEM. *P < .05, **P < .01, and ***P < .001.
Tissue hypoxia caused by anemia is a key signal to activate stress erythropoiesis. Our previous data showed that Bmp4 is a hypoxia-inducible gene.3,10,27 We next examined the role of Gdf15 in hypoxia-dependent regulation of Bmp4 expression. Hypoxia induces a stress response that transiently upregulates genes needed to compensate low O2 levels. Hypoxia inducible factor (Hif) and Vhl play opposing roles in hypoxic gene regulation.3 Under normoxia, Hifα, the oxygen-sensitive subunit, is targeted for rapid proteasomal degradation by Vhl-E3 ubiquitin ligase complex, which recognizes hydroxylation of specific proline residues on Hifα protein.28 However, Vhl is also a Hif target gene that provides a negative feedback loop to terminate the response.29 We evaluated Vhl expression by culturing Gdf15−/− spleen cells in media containing SHH, BMP4, stem cell factor, and EPO at 2% oxygen supplemented with or without GDF15. Addition of GDF15 significantly decreased Vhl expression and promoted Bmp4 expression at 72 hours of culture suggesting that Gdf15 stimulates Bmp4 expression through Vhl inhibition (Figure 6C). To further explore whether the repression of Vhl is sufficient for Bmp4 upregulation, we used short hairpin RNA to knock down Vhl expression. Compared with scramble control, cells with reduced Vhl expression level had increased expression of Bmp4 and the extent of the increase in Bmp4 expression was inversely correlated with Vhl activity (Figure 6D). These data suggest that Gdf15-dependent reduction of Vhl expression synergizes with hypoxia to upregulate and maintain Bmp4 expression in the spleen.
We next evaluated Vhl expression during the recovery from BMT and PHZ-induced acute anemia. In both in vivo models, we observed that increased levels of Vhl mRNA in the Gdf15−/− conditions corresponded to low levels of Bmp4 expression (Figure 6A, B, E, F). Hif2α binds to 2 hypoxia responsive elements (HRE) in Bmp4 gene.27 We analyzed Hif2α binding to 1 of these sites, HRE4, by chromatin immunoprecipitation during the recovery from BMT and PHZ induced anemia. On day 8 after transplant, we observed high relative binding of Hif2α to HRE4, which corresponded to the high levels of Hif2α protein and Bmp4 mRNA, whereas Vhl protein expression was low in the WT control group (Figure 6G, I). In contrast, mice transplanted with Gdf15−/− donor cells exhibited lower levels of Hif2α protein and Hif2α binding to HRE4, whereas the levels of Vhl protein were increased. Consistently, we observed similar results during the recovery from PHZ-induced acute hemolytic anemia. At 36 hours after PHZ treatment, low Vhl protein levels resulted in stabilized Hif2α protein and increased binding of Hif2α to HRE4 in WT animals (Figure 6H, J). In contrast, increased expression of Vhl protein in Gdf15−/− mice resulted in diminished Hif2α protein levels and reduced binding of Hif2α to HRE4.
These data demonstrate that, in vivo, Gdf15 signaling modulates Hif2α-dependent regulation of Bmp4 expression through Vhl inhibition during stress erythropoiesis, which also indicates a key role of Gdf15 signaling in governing hypoxia response. Taken together, these data demonstrate that Gdf15 plays a pivotal role in regulating the development of the splenic niche and the generation of key signals by the niche that promote proliferation of SEPs and recovery from anemic stress.
Gdf15 signaling in SEPs regulates metabolism to support proliferation
Studies have indicated that the proliferation ability of cell populations relies on the appropriate cellular metabolism to provide anabolic building blocks. We analyzed gene expression in SEPs expanded in vitro using SEEM media. By staining cells with fluorescent membrane dye PKH26 and cell surface markers, we identified 2 distinct SEP populations: the rapidly dividing progenitor population, which was characterized as PKH26loCD133negKit+Sca1+ (PKH26low) cells, and a more quiescent stem-cell like progenitor population, characterized as PKH26hiCD133+Kit+Sca1+ (PKH26high) cells. The total RNA from these 2 populations was profiled with Affymetrix Mouse Clariom D Pico Array and analyzed by Ingenuity Pathway Analysis and Gene Set Enrichment Analysis (GSEA) (supplemental Figure 9; supplemental Table 2). PKH26high cells express the signaling machinery for multiple hematopoietic lineages, whereas PKH26low cells are more erythroid restricted. Furthermore, PKH26low population is enriched in pathways concerning proliferation or metabolic pathways required to generate macromolecules to support proliferation. Although both PKH26high and PKH26low populations express a GSEA signature associated with glycolysis, PKH26low cells show an enrichment in the expression of genes associated with oxidative phosphorylation and fatty acid metabolism. We next investigated the differences in metabolism between PKH26high and PKH26low SEPs by metabolites extraction and LC/MS analysis. Highly proliferative PKH26low cells contained significantly increased levels of glutamate, a metabolite generated from glutamine by the action of Gls1 that supports glutaminolysis (supplemental Figure 10). In PKH26low cells, we also observed an increase in isocitrate/citrate, which is used during lipogenesis. This observation supports the GSEA analysis showing that the PKH26low population exhibited enriched expression of fatty acid metabolism genes (supplemental Figure 9). Consistent with the GSEA analysis, the levels of glycolytic metabolites were similar between the 2 populations.
Our data indicate that PKH26high and PKH26low SEPs are unique progenitor populations with distinct gene expression profiles and metabolic features. Given that Gdf15−/− progenitors have defects in expanding both PKH26high and PKH26low populations, especially the PKH26low SEPs (Figure 3H), Gdf15 signaling may support SEP proliferation via regulating their metabolism.
Gdf15 regulates metabolic enzyme expression in erythroid stress responses
Nutrient uptake and metabolic changes are key regulators of cell proliferation and differentiation. Hif1 activity promotes glycolysis through transcriptional activation of genes regulating glucose uptake by glucose transporter (Glut1) and pyruvate disposal (Pdk1/3).30-34 To determine whether loss of Gdf15 affects metabolic states and responses of SEPs during erythroid stress, we collected splenocytes at key time points following BM transplant. Relative expressions of Glut1, Pdk1, and Pdk3 were upregulated, correlated with erythroid recovery at day 8 in WT controls (Figure 7A). Alternatively, Gdf15 deficiency was accompanied by decreased expressions of these genes, consistent with reduced numbers of stress BFU-E (Figure 2E; Figure 7A). We next investigated expression of key metabolic enzymes in our in vitro culture system. Cultured Gdf15−/− erythroid progenitors displayed significantly decreased relative expressions of Glut1, Pdk1 and Pdk3, as well as Gls1 (Figure 7B). When Gdf15−/− progenitors were seeded on WT stromal layers, expression of key metabolic enzymes was restored (Figure 7C).
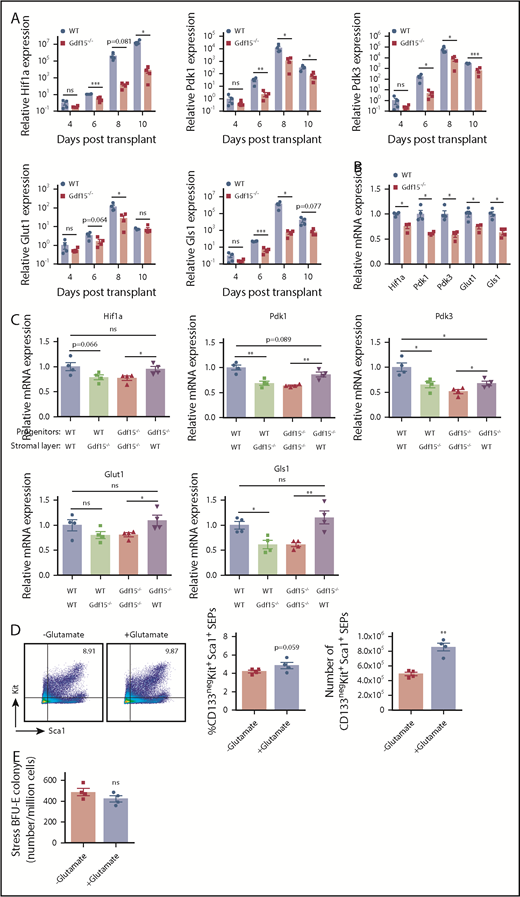
Mutation of Gdf15 alters the expression of metabolic enzymes during stress erythropoiesis. (A) Five × 105 bone marrow cells of WT or Gdf15−/− were transplanted to lethally irradiated WT recipients. Relative expression levels of Hif1α, Pdk1, Pdk3, Glut1, and Gls1 at indicated time points are plotted in a base-10 logarithmic scale. (B) WT and Gdf15−/− bone marrow cells were cultured in expansion media for 7 days. Stress erythroid progenitors were collected and analyzed with qRT-PCR. Relative expression levels of Hif1α, Pdk1, Pdk3, Glut1, and Gls1 are shown. (C) qRT-PCR analysis of Hif1α, Pdk1, Pdk3, Glut1, and Gls1 relative expression levels in control and mutant progenitors cultured on control or mutant stroma as indicated (see Figure 5F-G for description). Paired Student t test was performed to evaluate differences in gene expression levels. (D-E) Gdf15−/− bone marrow cells were cultured in vitro with or without 2 mM glutamate supplementation. (D) Flow cytometry analysis of (left) Kit+Sca1+ progenitor cells, (middle) percentage, and (right) absolute number of CD133negKit+Sca1+ SEPs are shown. (E) Analysis of stress BFU-E colony formation assay in hypoxia (2% O2). Data are shown as individual subject and the mean ± SEM. *P < .05, **P < .01, and ***P < .001.
Mutation of Gdf15 alters the expression of metabolic enzymes during stress erythropoiesis. (A) Five × 105 bone marrow cells of WT or Gdf15−/− were transplanted to lethally irradiated WT recipients. Relative expression levels of Hif1α, Pdk1, Pdk3, Glut1, and Gls1 at indicated time points are plotted in a base-10 logarithmic scale. (B) WT and Gdf15−/− bone marrow cells were cultured in expansion media for 7 days. Stress erythroid progenitors were collected and analyzed with qRT-PCR. Relative expression levels of Hif1α, Pdk1, Pdk3, Glut1, and Gls1 are shown. (C) qRT-PCR analysis of Hif1α, Pdk1, Pdk3, Glut1, and Gls1 relative expression levels in control and mutant progenitors cultured on control or mutant stroma as indicated (see Figure 5F-G for description). Paired Student t test was performed to evaluate differences in gene expression levels. (D-E) Gdf15−/− bone marrow cells were cultured in vitro with or without 2 mM glutamate supplementation. (D) Flow cytometry analysis of (left) Kit+Sca1+ progenitor cells, (middle) percentage, and (right) absolute number of CD133negKit+Sca1+ SEPs are shown. (E) Analysis of stress BFU-E colony formation assay in hypoxia (2% O2). Data are shown as individual subject and the mean ± SEM. *P < .05, **P < .01, and ***P < .001.
Glutaminolysis via glutaminase (Gls1) contributes to rapid proliferation of erythroid progenitors to maintain cell growth and viability.35,36 Glutaminolysis also plays a key role in the proliferation of hematopoietic progenitors and their commitment to the erythroid lineage.37 Higher Gls1 expression and higher glutamate abundance were detected in PKH26low transiently amplifying SEPs than PKH26high SEPs, which is consistent with its role to promote cell proliferation (supplemental Figures 9F and 10). We next determined whether the impaired proliferation of Gdf15−/− PKH26low cells was due to defects in glutaminolysis. We added 2 mM glutamate to Gdf15−/− BM in vitro culture. The transiently amplifying population of CD133negKit+Sca1+ SEPs were restored by glutamate supplementation (Figure 7D). However, glutamate supplementation failed to increase the frequency of stress BFU-Es suggesting that Gls1 specifically promotes erythroid progenitor expansion rather than their differentiation (Figure 7E). Thus, Gdf15 signaling regulates the proliferation of SEPs partially through glutaminolysis (Gls1 activity). Collectively, these results demonstrate that Gdf15-mediated glycolysis and glutaminolysis are essential for SEP expansion and consequent erythroid recovery from stress conditions.
Discussion
Our data demonstrate an essential role for Gdf15 signaling in stress erythropoiesis in vivo. These data complement our previous findings that Gdf15 is required in vitro for the expansion of human and murine SEPs.10 Gdf15 acts both in the splenic niche and on SEPs. Gdf15−/− mice exhibited defects in the development and the function of the erythroid niche. Some of this defect may be explained by decreased circulating monocytes and fewer splenic RPMs at steady state. However, in response to anemic stress, the increase in Ccl2 signaling in the spleen that recruits monocytes to expand the niche was impaired in Gdf15−/− mice, leading to fewer F4/80+Vcam1+ macrophages developed in spleen. The defect in macrophage development in the spleen is not caused by fewer progenitors because Gdf15−/− MoPs (Kit+CD115+Ly6Cneg/+CD11bneg) percentages were similar to WT (supplemental Figure 6). Gdf15−/− and WT produced similar numbers of CFU-GM colonies, but consistent with the phenotypes observed in vivo, Gdf15−/− colony sizes were smaller, suggesting that fewer monocyte/macrophages were produced per CFU-GM in absence of Gdf15. Our observation that Gdf15 regulates the hypoxia-dependent transcription of Bmp4 in the niche and metabolic enzymes in progenitors implicates that Gdf15 may also regulate metabolism in monocyte development and macrophage maturation leading to impaired expansion of the niche in Gdf15−/− mice. The deficiency in establishing supportive erythroid microenvironment was further supported by in vitro model where fewer F4/80+Vcam1+ macrophages were developed in Gdf15−/− culture (supplemental Figure 11). Recent studies demonstrated that Hif2α depletion leads to significantly reduced expression of Vcam1 in endothelial cells, and decreased expression of Hmox1 in renal cancer cells.38,39 Decreased expressions of Vcam1 and Hmox1 in Gdf15−/− mice after PHZ challenge can be explained as results of reduced Hif2α activity in the spleen.
Previous work showed that Gdf15 signaling plays a role in cardioprotection, where Gdf15 levels increased in response to ischemia.40-42 Our data indicate a Gdf15-mediated downregulation of Vhl, consistent with previous studies showing that activation of Hif-dependent transcription can protect against potential damages caused by ischemia reperfusion injury.43,44 Conversely, under pathological conditions, excess Gdf15 can contribute to pathology.45,46 Gdf15 is expressed in 2 waves during the recovery from BMT. The second wave corresponds with the expansion of BFU-E population in the spleen. In thalassemia and other iron loading anemias, inefficient terminal differentiation leads to prolonged proliferation of erythroid progenitors. Maintenance of Gdf15 expression could exacerbate this situation leading to increased erythroferrone expression, hepcidin suppression and iron overload.
In other tissues, Gdf15 has been identified as a potent mitohormetic signal, which regulates systemic energy homeostasis and prevents the incident of insulin resistance and obesity.7 Rapid proliferation of cells requires the generation of anabolic intermediates. Cancer cells use aerobic glycolysis to support proliferation. Our analysis shows that Gdf15 initiates a metabolic response characterized by increased expression of Glut1 to enhance glucose availability and Pdk1/3 which prevents the shunting of pyruvate into the TCA cycle. This increase in glycolysis was coupled with increased Gls1expression to promote the use of glutamine metabolism to support progenitor cell proliferation. The key role of glutamine metabolism was further confirmed by the observation that supplementing glutamate rescued the proliferation of Gdf15−/− cultures. These data support a model where Gdf15 regulates the expansion of progenitor populations by modulating their metabolism.
In the future, development of a conditional allele of Gdf15 will be needed to interrogate the tissue-specific roles of Gdf15 signaling in the regulation of the proliferation and differentiation of SEPs and development of the splenic niche.
The full-text version of this article contains a data supplement.
Acknowledgments
The authors thank Elyse Ellsworth and Shailaja Hegde for work on the project and members of the Paulson and Lai laboratories for their timely help and suggestions. This work was initiated because of discussions with Jeff Miller concerning the role of Gdf15 in thalassemia.
This work was supported, in part, by grants from the National Institutes of Health, National Institute of Diabetes and Digestive and Kidney Diseases (R01 DK080040) (R.F.P.), USDA-NIFA Hatch project number PEN04581 Accession #1005468 (R.F.P.), and PEN04607 Accession #1009993 (A.D.P.).
Authorship
Contribution: S.H., J.X., D.-C.W., J.W.F., and B.R. performed experiments; S.H., J.X., D.-C.W., J.W.F., R.F.P., and Z.-C.L. designed experiments and analyzed data; S.H., J.C., and A.D.P. performed and analyzed the metabolomics data; S.H. and R.F.P. wrote the paper; S.H., J.X., D.-C.W., and R.F.P. conceptualized the project; and S.H., J.X., D.-C.W., J.W.F., B.R., R.F.P., J.C., A.D.P., and Z.-C.L. commented on the manuscript.
Conflict-of-interest disclosure: The authors declare no competing financial interests.
The current affiliation for J.X. is University of Michigan Kidney Epidemiology and Cost Center, Washington Heights, MI.
Correspondence: Robert F. Paulson, Center for Molecular Immunology and Infectious Disease, Department of Veterinary and Biomedical Sciences, Penn State University, 108B Research A Building, University Park, PA 16802; e-mail: rfp5@psu.edu.

