

Key Points
We revealed a procoagulant climate within the CMML microenvironment related to TF-bearing sEVs secreted by CMML MSCs and monocytes.

Abstract
Chronic myelomonocytic leukemia (CMML) is a myeloid hematological malignancy with overlapping features of myelodysplastic syndromes (MDSs) and myeloproliferative neoplasms (MPNs). The knowledge of the role of the tumor microenvironment (TME), particularly mesenchymal stromal cells (MSCs), in MDS pathogenesis is increasing. Generally, cancer is associated with a procoagulant state participating in tumor development. Monocytes release procoagulant, tissue factor (TF)–bearing microparticles. We hypothesized that MSCs and clonal monocytes release procoagulant extracellular vesicles (EVs) within the CMML TME, inducing a procoagulant state that could modify hematopoietic stem cell (HSC) homeostasis. We isolated and cultured MSCs and monocytes from CMML patients and MSCs from healthy donors (HDs). Their medium EVs and small EVs (sEVs) were collected after iterative ultracentrifugations and characterized by nanoparticle tracking analysis. Their impact on hemostasis was studied with a thrombin generation assay and fibrinography. CMML or HD HSCs were exposed to sEVs from either CMML or HD MSCs. CMML MSC sEVs increased HD HSC procoagulant activity, suggesting a transfer of TF from the CMML TME to HD HSCs. The presence of TF on sEVs was shown by electron microscopy and western blot. Moreover, CMML monocyte EVs conferred a procoagulant activity to HD MSCs, which was reversed by an anti-TF antibody, suggesting the presence of TF on the EVs. Our findings revealed a procoagulant “climate” within the CMML environment related to TF-bearing sEVs secreted by CMML MSCs and monocytes.
Introduction
Chronic myelomonocytic leukemia (CMML) is the most frequent myelodysplastic syndrome (MDS)/myeloproliferative neoplasm (MPN). It is mostly defined by a chronic clonal monocytosis. CMML transformation toward acute myeloid leukemia occurs in 15% to 20% of cases.1-3
The role of the tumor microenvironment (TME) in MDS pathogenesis is increasingly highlighted.4,5 A permanent crosstalk takes place within the endosteal hematopoietic tumor niche between hematopoietic tumor cells and their microenvironment, especially peritumor mesenchymal stromal cells (MSCs).6,7 These interactions participate in oncogenesis.8,9 The intercellular crosstalk involves direct intercellular contact and the release of cytokines, chemokines, growth factors, soluble receptors, and extracellular vesicles (EVs).10,11 These EVs include microparticles shed from activated cell membrane and smaller exosomes derived from the endosomal compartment.10-12 Microparticles and exosomes are classically separated by size criteria, but there is a significant size overlap, and evidence of intracellular origin should be provided in order to stringently define exosomes.13 Therefore, we will use the terms medium EVs (mEVs) and small EVs (sEVs) instead of microparticles and exosomes.14
Studies of the MDS TME have focused on the vascular niche and demonstrated increased angiogenesis and higher medullar vascular endothelial growth factor rates.15-20 This increased medullar angiogenesis, along with elevated reactive oxygen species, may induce a hyperproliferation of hematopoietic stem cells (HSCs), provoking an accumulation of DNA alterations leading to tumor development.21 However, the involvement of MSCs has been less studied in the specific subset of CMML.
Besides increased angiogenesis, cancer is associated with a procoagulant state participating in tumor development and the metastatic process. Monocytes are particularly important cells in the coagulation process, as they shed procoagulant tissue factor (TF)–bearing microparticles.22,23 It has been recently shown that MSCs also carry TF24-26 and have procoagulant activity (PCA).27
Microparticles bear anionic phosphatidylserines on their outer membrane, enabling the concentration of coagulation enzymes via the fixation of their γ-carboxyglutamic acid domain.28 Tumor microparticles have PCA in vitro, but little is known about exosomes.10,29-36 The impact of EVs on fibrinolysis has also not been thoroughly investigated, but recent in vitro data suggest that tumor EVs might have a profibrinolytic activity.37
We hypothesized that MSCs and clonal monocytes release EVs within the CMML TME, inducing a dysregulated coagulant state that could modify the homeostasis of HSCs and participate in the development of bone marrow dysfunction in CMML.
Methods
A precise description of each assay and technique is given in supplemental Methods.
Cells
All patients signed an informed consent approved by the local ethics committee (Centre de Ressources Biologiques cession: 2019-02-07-C, Bio-Resource Research Impact: BB-0033-00069, agreement: AC 2014-2094).
MSCs were isolated from total marrow aspirations of CMML patients and patients with normal marrow (supplemental Table 1). Mononuclear cells were isolated through a density gradient and magnetically sorted according to CD34 expression (AutoMACS Pro, Miltenyi Biotec). MSCs were separated from the CD34− fraction by their adherence to plastic. Their immunophenotype (CD90+, CD73+, CD105+, CD45−) was verified. MSCs were incubated in an Exofree medium 72 hours before EV extraction.
Monocytes were isolated from peripheral blood of CMML patients and patients with a reactional monocytosis and magnetically sorted according to CD14+ expression (AutoMACS Pro). Monocytes were cultured for 37 to 40 hours before EV extraction.
HSCs were isolated from the CD34+ fraction of the total marrow aspirations of healthy donors or CMML patients and cultured in a medium containing Myelocult H5100 with FLT3-ligand, stem cell factor, and thrombopoietin.
EV extraction and characterization
EVs were extracted from cell culture supernatants (SNs) through iterative centrifugations (supplemental Figure 1) and tested fresh for hemostasis assays.38 All EV samples were characterized by nanoparticle tracking analysis (NTA) on the NanoSight NS300 (NanoSight, Malvern, United Kingdom). This technique is based on both light scattering and Brownian motion of particles, determining their size and their concentration.
Hemostasis
A thrombin generation assay (TGA) was performed according to Hemker’s method39 with MSCs, mEVs, and sEVs using different types of normal platelet-poor plasma (n-PPP), factor VII (FVII)–deficient PPP (Stago), and n-PPP with a blocking anti-TF antibody (HTF-1, eBioscience).
The positive control contained 0.5 pM TF and 2 µM phospholipids (PPP Reagent Low half-diluted in phosphate-buffered saline [PBS], Stago). Negative control contained 2 µM phospholipids (MP-Reagent [MPR] half-diluted in PBS, Stago). All conditions were half-diluted in MPR. Results of thrombin peak and coagulation lag time were normalized on a positive control to avoid plasma change variability.
The thrombin generation curves starting after the negative control correspond not to the activation of the TF-FVII pathway but rather to the contact-phase activation. These conditions were thus not considered as procoagulant.
A fibrinolysis assay was performed on MSC EVs in the presence of 0.5 pM TF and 80 ng/mL tissue plasminogen activator (t-PA).
Transmission electron microscopy
Fresh MSC sEVs were immunolabeled with an anti-TF rabbit polyclonal primary antibody and a gold-labeled anti-protein A rabbit monoclonal secondary antibody.
Incorporation of CMML sEVs in HD HSCs by confocal microscopy
CMML MSC sEVs were labeled with a Vybrant DiD (1,1′-dioctadecyl-3,3,3′,3′-tetramethylindodicarbocyanine perchlorate) cell-labeling solution. They were incubated on healthy donor (HD) HSCs labeled with anti-CD34 fluorescein isothiocyanate (FITC).
HSC proliferation
CMML and HD HSCs were cocultured in the H5100 culture medium with sEVs (derived from CMML or HD MSCs). After 6 days of culture, thymidine incorporation was measured in a TopCount liquid scintillation counter (Packard).
Statistics
Statistics were calculated with bilateral unpaired or paired Student t test using GraphPad Prism5 software (http://www.graphpad.com/scientific-software/prism/). Results are expressed as mean ± standard error of the mean. A Spearman test was performed to study the correlation between CMML biological characteristics and EV PCA.
Results
EV extraction and characterization
All EV samples were analyzed with the NTA technique (Figure 1). The pellets collected after the 10 000g and the 100 000g ultracentrifugation corresponded to mEVs (Figure 1A) and sEVs (Figure 1B), respectively.
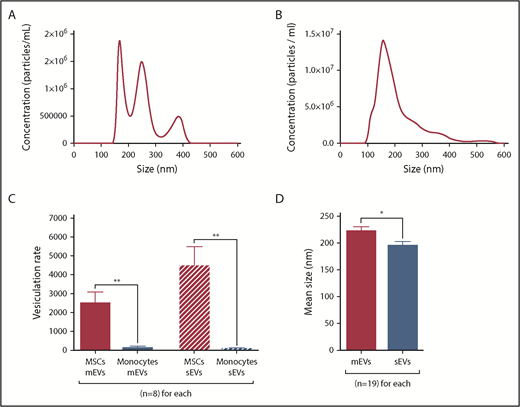
EV characterization by NTA. (A-D) mEVs and sEVs analyzed by NTA were isolated from the same CMML MSC culture SN by differential ultracentrifugation. *P ≤ .05, **P ≤ .005. (A) NTA profile of a sample of CMML MSC mEVs. (B) NTA profile of a sample of CMML MSC sEVs. (C) Vesiculation rates of MSCs and monocytes for mEVs and sEVs, defined as the number of vesicles shed per cell. MSCs are represented in red and monocytes in blue. (D) Mean size of MSC mEVs and sEVs (nm). MSC mEVs are represented in red and MSC sEVs in blue.
EV characterization by NTA. (A-D) mEVs and sEVs analyzed by NTA were isolated from the same CMML MSC culture SN by differential ultracentrifugation. *P ≤ .05, **P ≤ .005. (A) NTA profile of a sample of CMML MSC mEVs. (B) NTA profile of a sample of CMML MSC sEVs. (C) Vesiculation rates of MSCs and monocytes for mEVs and sEVs, defined as the number of vesicles shed per cell. MSCs are represented in red and monocytes in blue. (D) Mean size of MSC mEVs and sEVs (nm). MSC mEVs are represented in red and MSC sEVs in blue.
The vesiculation rate was defined by the number of vesicles shed per cell. It was significantly higher for MSCs (mEVs: 2492 ± 599; sEVs: 4448 ± 1044) than monocytes (mEVs: 123 ± 89; P = .002; sEVs: 72 ± 41; P = .001) (Figure 1C). Vesiculation rates were similar between CMML and HD MSCs and between CMML and reactional monocytes (P = not significant).
mEVs were significantly larger (221.6 ± 8.8 nm) than sEVs (194.3 ± 8.4 nm, P = .03, Figure 1D).
The 100 000g pellets had already been characterized by western blot and electron microscopy in a previous study conducted by our team,40 but we recharacterized them (supplemental Figure 1B-C). The 100 000g pellets mostly contained exosomes, based on size criteria (∼80 nm) (supplemental Figure 1B) and the expression of the exosome-specific markers flotillin, Alix, and CD63 (supplemental Figure 1C).
The procoagulant activity of CMML MSCs and monocytes is carried by their sEVs
When they were added in n-PPP, CMML MSCs displayed a higher PCA than HD MSCs (Figure 2A).
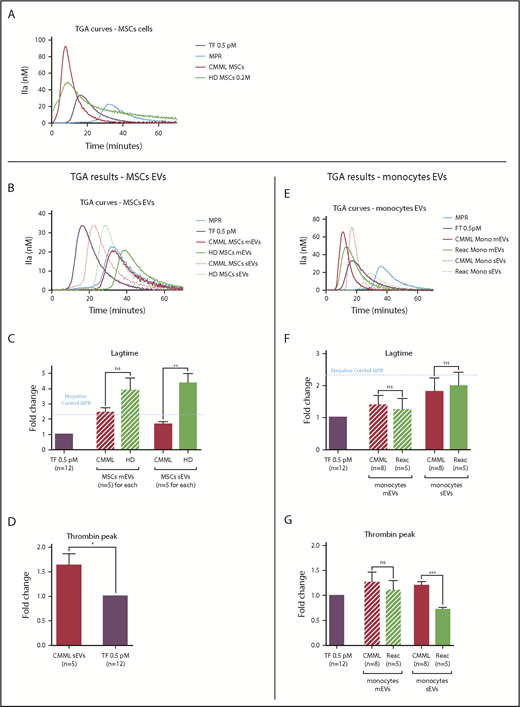
The procoagulant impact of CMML MSCs and monocytes is conveyed by sEVs. Lag times and thrombin peak are expressed as fold changes of values obtained with positive control (TF 0.5 pM). The negative control used was MPR 0.5. Any thrombin generated after corresponded to contact-phase activation. CMML EVs are represented in red, HD EVs in green, and TF 0.5 pM in purple. Continuous curves represent mEVs, and dotted curves represent sEVs. *P ≤ .05, **P ≤ .005, ***P ≤ .0005. (A) TGA curves of 0.2 million CMML MSCs and HD MSCs compared with 0.5 pM TF. (B) TGA curves of CMML and HD MSC mEVs and sEVs. (C) Coagulation lag time for CMML and HD MSC EVs. (D) Peak of thrombin generated by CMML MSC sEVs. (E) TGA curves of CMML and reactional monocyte mEVs and sEVs. (F) Coagulation lag time for CMML and reactional monocyte EVs. (G) Peak of thrombin generated by CMML and reactional monocyte EVs. Mono, monocytes; ns, not significant.
The procoagulant impact of CMML MSCs and monocytes is conveyed by sEVs. Lag times and thrombin peak are expressed as fold changes of values obtained with positive control (TF 0.5 pM). The negative control used was MPR 0.5. Any thrombin generated after corresponded to contact-phase activation. CMML EVs are represented in red, HD EVs in green, and TF 0.5 pM in purple. Continuous curves represent mEVs, and dotted curves represent sEVs. *P ≤ .05, **P ≤ .005, ***P ≤ .0005. (A) TGA curves of 0.2 million CMML MSCs and HD MSCs compared with 0.5 pM TF. (B) TGA curves of CMML and HD MSC mEVs and sEVs. (C) Coagulation lag time for CMML and HD MSC EVs. (D) Peak of thrombin generated by CMML MSC sEVs. (E) TGA curves of CMML and reactional monocyte mEVs and sEVs. (F) Coagulation lag time for CMML and reactional monocyte EVs. (G) Peak of thrombin generated by CMML and reactional monocyte EVs. Mono, monocytes; ns, not significant.
We explored whether the procoagulant impact of tumor monocytes and peritumor MSCs could be carried by the EVs they shed (Figure 2B-G).
The contact phase was defined as any thrombin generation starting after the thrombin generated by the negative control (MPR). This random, delayed activation of coagulation via endogenous pathway generation is not the consequence of TF-FVII pathway activation.
Regarding MSC mEVs, the thrombin generated by both CMML and HD MSC mEVs corresponded to the activation of the contact phase (Figure 2B-C). Analysis of the thrombin peak was therefore not relevant.
Regarding MSC sEVs, sEVs derived from CMML MSCs generated thrombin earlier than HD MSC sEVs (lag-time fold change: 1.69 ± 0.15 vs 4.38 ± 0.64; P = .003; Figure 2C) and in a higher concentration than the positive control (thrombin peak fold change: 1.63 ± 0.24; P = .03; Figure 2D). HD MSC sEV PCA corresponded to the contact phase (Figure 2C), and the analysis of the thrombin peak was not suitable.
The same experiments were performed on EVs derived from CMML and reactional monocytes, respectively (Figure 2E-G).
Regarding monocyte mEVs, both CMML and reactional monocyte mEVs generated thrombin earlier than the negative control. Their lag times were similar (CMML monocyte mEV fold change: 1.40 ± 0.29 vs reactional monocytes mEV fold change: 1.25 ± 0.34; P = not significant; Figure 2F). The thrombin concentration generated by both mEVs was also similar (CMML monocytes mEV fold change: 1.26 ± 0.20 vs reactional monocytes mEV fold change: 1.10 ± 0.19; P = not significant; Figure 2G).
Regarding monocyte sEVs, CMML and reactional monocytes sEVs generated thrombin earlier than the negative control, with similar lag times (Figure 2F) but a higher peak for CMML monocyte sEVs (Figure 2G; CMML monocyte sEV fold change: 1.20 ± 0.07 vs reactional monocytes sEV fold change: 0.72 ± 0.05; P = .0004).
To summarize, mEVs derived from CMML or HD MSCs or monocytes did not differ in terms of PCA. However, sEVs derived from CMML MSCs and monocytes presented a higher PCA than sEVs derived from HD MSCs or reactional monocytes.
CMML MSCs EVs also carry antifibrinolytic activity
We investigated whether peritumor MSC EVs, in addition to PCA, also displayed an antifibrinolytic effect (Figure 3B).
![Figure 3. CMML MSCs EVs have an antifibrinolytic impact. For each experiment, PBS was used as a negative control. CMML EVs are represented in red, HD EVs in green, and PBS in blue. Continuous curves represented mEVs, and dotted curves represented sEVs. *P ≤ .05, **P ≤ .005. (A) Fibrinolysis parameters: clot lysis time (minutes, time between 50% of the peak during the coagulation phase [TNp50Up] and 50% of the peak during the lysis phase [TNp50Down]), Npmax (the maximum number of protofibril per fibrin fiber), Np97 (97% of the maximum number of protofibril per fibrin fiber and corresponding to 97% of clot formation), Np50 (50% of the maximum number of protofibril per fibrin fiber and corresponding to 50% of clot formation), coagulation time (time at which the clot formation begins), and TNp97. (B) Fibrinography curves of our fibrinolysis assay on CMML EVs and HD MSC EVs. In each condition, 0.5 pM TF and 80 ng/mL t-PA were added. (C) Comparison of clot lysis times between CMML and HD MSC EVs. A longer clot lysis time corresponds to a higher clot resistance to fibrinolysis. (D) Comparison of coagulation times between CMML and HD MSC EVs. (E) Comparison of TNp97 between CMML and HD MSC EVs.](https://ash.silverchair-cdn.com/ash/content_public/journal/bloodadvances/3/12/10.1182_bloodadvances.2018026955/4/m_advances026955f3.png?Expires=1769720713&Signature=CJOvFHNK0o07dvRaSeH8gSOjTvg0Y9g2zIUl-4~4AN6p12XpnEyea4W2NiAGxtJPhvlVJBkJclT6EPlPRHcgnCFlRNuqvmnizbpV-zwLoibMDTORvhVo9hA0EDDULILrlpI0nDL1iHzN44GMXkEPpHmbgTsYbkMnvSgRs-gsYekv48u0KT2XQt9HiUweg3knlsDtICilRNmFdSX5YwjWqBEV-a5q2a59dR6Qehp982~j801F7lJhsHlaNrOAaVH9ufgrMkQYd55cO~cc8MR7N8YECtvT17HgxJXsXgHoo0ZkB8~DPIAq7LPptfs7t4UY-FacqU54q6qEBr-YV8n7zg__&Key-Pair-Id=APKAIE5G5CRDK6RD3PGA)
CMML MSCs EVs have an antifibrinolytic impact. For each experiment, PBS was used as a negative control. CMML EVs are represented in red, HD EVs in green, and PBS in blue. Continuous curves represented mEVs, and dotted curves represented sEVs. *P ≤ .05, **P ≤ .005. (A) Fibrinolysis parameters: clot lysis time (minutes, time between 50% of the peak during the coagulation phase [TNp50Up] and 50% of the peak during the lysis phase [TNp50Down]), Npmax (the maximum number of protofibril per fibrin fiber), Np97 (97% of the maximum number of protofibril per fibrin fiber and corresponding to 97% of clot formation), Np50 (50% of the maximum number of protofibril per fibrin fiber and corresponding to 50% of clot formation), coagulation time (time at which the clot formation begins), and TNp97. (B) Fibrinography curves of our fibrinolysis assay on CMML EVs and HD MSC EVs. In each condition, 0.5 pM TF and 80 ng/mL t-PA were added. (C) Comparison of clot lysis times between CMML and HD MSC EVs. A longer clot lysis time corresponds to a higher clot resistance to fibrinolysis. (D) Comparison of coagulation times between CMML and HD MSC EVs. (E) Comparison of TNp97 between CMML and HD MSC EVs.
CMML MSCs EVs have an antifibrinolytic impact. For each experiment, PBS was used as a negative control. CMML EVs are represented in red, HD EVs in green, and PBS in blue. Continuous curves represented mEVs, and dotted curves represented sEVs. *P ≤ .05, **P ≤ .005. (A) Fibrinolysis parameters: clot lysis time (minutes, time between 50% of the peak during the coagulation phase [TNp50Up] and 50% of the peak during the lysis phase [TNp50Down]), Npmax (the maximum number of protofibril per fibrin fiber), Np97 (97% of the maximum number of protofibril per fibrin fiber and corresponding to 97% of clot formation), Np50 (50% of the maximum number of protofibril per fibrin fiber and corresponding to 50% of clot formation), coagulation time (time at which the clot formation begins), and TNp97. (B) Fibrinography curves of our fibrinolysis assay on CMML EVs and HD MSC EVs. In each condition, 0.5 pM TF and 80 ng/mL t-PA were added. (C) Comparison of clot lysis times between CMML and HD MSC EVs. A longer clot lysis time corresponds to a higher clot resistance to fibrinolysis. (D) Comparison of coagulation times between CMML and HD MSC EVs. (E) Comparison of TNp97 between CMML and HD MSC EVs.
The control condition displayed a clot lysis time of 73.47 ± 0.5 minutes. Compared with the control, clot lysis time was not increased when adding HD MSC EVs (mEVs: 68.49 ± 5.5 minutes; sEVs: 74.01 ± 3.5 minutes; P = not significant for both) or CMML MSC mEVs (87.37 ± 3.9 minutes, P = not significant); however, it was lengthened when CMML MSC sEVs were added (95.01 ± 4.5 minutes; P = .03). Compared with HD MSC sEVs, CMML MSC sEVs displayed a higher antifibrinolytic effect (P = .02) (Figure 3C).
Then, we studied clot formation with 2 parameters: coagulation time (Figure 3D) and TNp97 (the time at which Np97 is reached and corresponding to 97% of clot formation; Figure 3E). The PBS condition showed a coagulation lag time of 21.82 ± 2.1 minutes and a TNp97 of 32.75 ± 0.3 minutes.
The coagulation time was not significantly shortened when HD MSC EVs were added (mEVs: 18.94 ± 1.1 minutes; sEVs: 17.54 ± 0.5 minutes; P = not significant for both), but it was shortened for CMML MSC mEVs (12.86 ± 0.3 minutes; P = .01 vs PBS and P = .006 vs HD MSCs mEVs) and CMML MSC sEVs (11.20 ± 0.9 minutes; P = .01 vs control and P = .004 vs HD MSC sEVs; Figure 3D).
The same observations were made when we studied TNp97. HD MSCs did not induce a TNp97 shortening (mEVs: 31.50 ± 1.6 minutes; sEVs: 28.74 ± 1.1 minutes; P = not significant for both). However, TNp97 was shortened by both CMML MSC mEVs and sEVs, with a greater impact for sEVs (23.19 ± 1.2 minutes; P = .009 vs PBS and P = .03 vs HD MSCs sEVs) than mEVs (25.50 ± 1.2 minutes; P = .02 vs control and P = .04 vs HD MSCs mEVs; Figure 3E).
Using fibrinography and studying 3 parameters (clot lysis time, coagulation time, and TNp97), we showed that CMML MSC EVs and, more particularly, sEVs carry an antifibrinolytic activity. Indeed, compared with HD MSC EVs and CMML MSC mEVs, they were able to increase both clot formation and resistance to clot lysis.
CMML MSC and monocyte sEV PCA is mediated by the presence of TF on their membrane
We tried to understand the underlying mechanism of CMML cell sEV PCA.
TGAs were repeated using an FVII-deficient plasma (defVII-PPP). While CMML MSCs and monocyte sEVs generated thrombin in n-PPP, there was no thrombin generation in the defVII-PPP (Figure 4A). The initial trigger of the coagulation cascade by TF transforming FVII in FVIIa did not happen, suggesting that sEVs carry TF on their membrane. We repeated the TGA with n-PPP in the presence of a blocking anti-TF antibody (HTF-1). While CMML MSCs and monocyte sEVs generated thrombin earlier than the negative control in n-PPP without HTF-1, the addition of HTF-1 abolished early coagulation, and only contact-phase activation remained (Figure 4B-C). This finding also strongly suggests the presence of TF on CMML MSC and monocyte sEVs membranes.
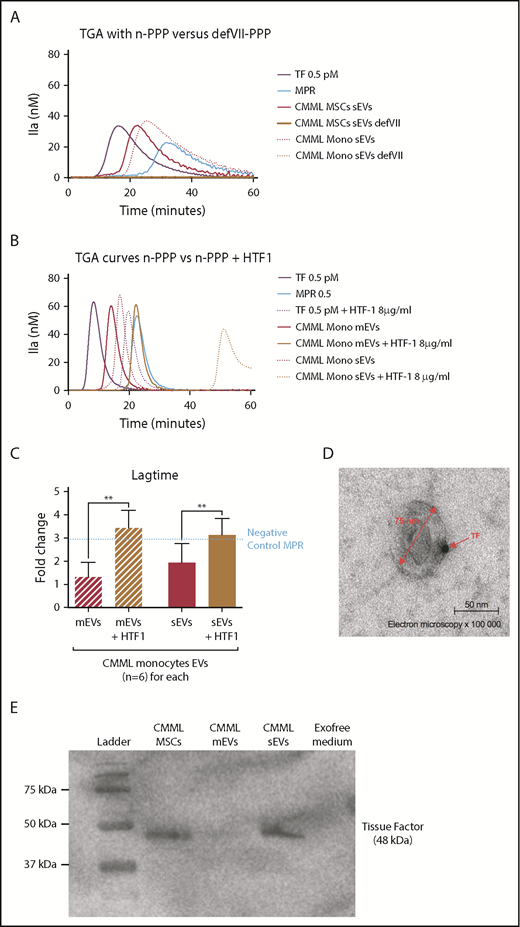
The CMML MSCs and monocyte sEVs procoagulant effect is probably mediated by TF on EV membrane. Lag times are expressed as fold changes of the lag time obtained with the positive control (TF 0.5 pM). The negative control used was MPR 0.5. Any thrombin generated after corresponded to contact-phase activation. **P ≤ .005. (A) TGA curves of CMML MSCs and monocyte sEVs with n-PPP and FVII-deficient plasma (defVII-PPP). TGA conditions performed with normal plasma are represented in red, deficient FVII plasma in mustard, TF 0.5 pM in purple, and MPR in blue. Continuous curves represent MSC sEVs, and dotted curves represent monocyte sEVs. (B) TGA curves of CMML MSCs and monocyte sEVs with n-PPP and n-PPP with a blocking anti-TF antibody (HTF-1) at the concentration of 8 µg/mL. TGA conditions performed without HTF-1 are represented in red and with HTF-1 in mustard. TF 0.5 pM is represented in purple and MPR in blue. Continuous curves represent mEVs, and dotted curves represent sEVs. (C) Effect of a blocking anti-TF antibody (HTF-1, final concentration of 8 µg/mL) on coagulation lag time with n-PPP. TGA conditions performed without HTF-1 are represented in red and with HTF-1 in mustard. TF 0.5 pM is represented in purple. (D) Direct visualization of TF on sEV membranes with electron microscopy. Primary antibody, rabbit anti-TF; secondary antibody, gold-labeled anti-protein A rabbit. Observations were made using a transmission electron microscope (JEOL1200 EX) with a digital camera (VELETA), G = 100 000, at room temperature. (E) Western blot analysis of CMML MSCs and sEVs showing TF expression (48 kDa). CMML MSCs were used as positive control and Exofree medium as negative control.
The CMML MSCs and monocyte sEVs procoagulant effect is probably mediated by TF on EV membrane. Lag times are expressed as fold changes of the lag time obtained with the positive control (TF 0.5 pM). The negative control used was MPR 0.5. Any thrombin generated after corresponded to contact-phase activation. **P ≤ .005. (A) TGA curves of CMML MSCs and monocyte sEVs with n-PPP and FVII-deficient plasma (defVII-PPP). TGA conditions performed with normal plasma are represented in red, deficient FVII plasma in mustard, TF 0.5 pM in purple, and MPR in blue. Continuous curves represent MSC sEVs, and dotted curves represent monocyte sEVs. (B) TGA curves of CMML MSCs and monocyte sEVs with n-PPP and n-PPP with a blocking anti-TF antibody (HTF-1) at the concentration of 8 µg/mL. TGA conditions performed without HTF-1 are represented in red and with HTF-1 in mustard. TF 0.5 pM is represented in purple and MPR in blue. Continuous curves represent mEVs, and dotted curves represent sEVs. (C) Effect of a blocking anti-TF antibody (HTF-1, final concentration of 8 µg/mL) on coagulation lag time with n-PPP. TGA conditions performed without HTF-1 are represented in red and with HTF-1 in mustard. TF 0.5 pM is represented in purple. (D) Direct visualization of TF on sEV membranes with electron microscopy. Primary antibody, rabbit anti-TF; secondary antibody, gold-labeled anti-protein A rabbit. Observations were made using a transmission electron microscope (JEOL1200 EX) with a digital camera (VELETA), G = 100 000, at room temperature. (E) Western blot analysis of CMML MSCs and sEVs showing TF expression (48 kDa). CMML MSCs were used as positive control and Exofree medium as negative control.
To directly highlight the presence of TF on the sEV membrane, we performed electron microscopy on sEVs derived from CMML MSCs (Figure 4D). Images displayed the presence of TF on the sEV membrane, confirming that sEVs could carry TF on their surface. We confirmed these results with western blot by isolating sEVs and mEVs. We showed by western blot that TF was particularly expressed on sEVs (Figure 4E).
CMML monocytes can increase HD MSC PCA
MSCs have intrinsic PCA, but we wondered whether CMML monocytes could transfer a higher PCA to MSCs.
HD MSCs were cultured with CMML monocyte SN containing mEVs, sEVs, and other secretion products (n = 5) for 48 hours. Afterward, MSC PCA was studied by TGA (Figure 5A).
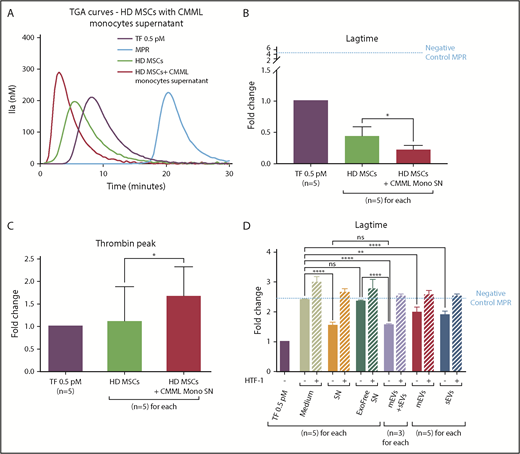
CMML monocytes are able to modify the PCA of HD MSCs. Lag times are expressed as fold changes of the lag time obtained with the positive control (TF 0.5 pM). The negative control used was MPR 0.5. Any thrombin generated after corresponded to contact-phase activation. HD MSCs cultured with medium are represented in green, with monocyte SN in red, TF 0.5 pM in purple, and MPR in blue. *P ≤ .05, **P ≤ .005, ****P ≤ .0001. (A) TGA curves of HD MSCs coincubated without or with CMML monocyte SN. (B) Effect of CMML monocyte SN on HD MSC coagulation lag time. (C) Effect of CMML monocyte SN on HD MSC thrombin generation. (D) Study of the effect of the different CMML monocyte SN components on HD MSCs lag time. The effect of 6 different SNs was studied: (1) medium alone, (2) monocyte culture SN, (3) monocyte culture SN without exosomes (Exofree SN), (4) mEVs isolated from CMML monocyte SN, (5) sEVs isolated from CMML monocyte SN, and (6) mEVs and sEVs isolated from CMML monocyte SN at the same time. Experiments were performed without or with a blocking anti-TF antibody (HTF-1) at a final concentration of 8 µg/mL.
CMML monocytes are able to modify the PCA of HD MSCs. Lag times are expressed as fold changes of the lag time obtained with the positive control (TF 0.5 pM). The negative control used was MPR 0.5. Any thrombin generated after corresponded to contact-phase activation. HD MSCs cultured with medium are represented in green, with monocyte SN in red, TF 0.5 pM in purple, and MPR in blue. *P ≤ .05, **P ≤ .005, ****P ≤ .0001. (A) TGA curves of HD MSCs coincubated without or with CMML monocyte SN. (B) Effect of CMML monocyte SN on HD MSC coagulation lag time. (C) Effect of CMML monocyte SN on HD MSC thrombin generation. (D) Study of the effect of the different CMML monocyte SN components on HD MSCs lag time. The effect of 6 different SNs was studied: (1) medium alone, (2) monocyte culture SN, (3) monocyte culture SN without exosomes (Exofree SN), (4) mEVs isolated from CMML monocyte SN, (5) sEVs isolated from CMML monocyte SN, and (6) mEVs and sEVs isolated from CMML monocyte SN at the same time. Experiments were performed without or with a blocking anti-TF antibody (HTF-1) at a final concentration of 8 µg/mL.
HD MSCs incubated with CMML monocyte SN (lag-time fold change: 0.21 ± 0.05) generated thrombin earlier than MSCs cultured with medium alone (fold change: 0.43 ± 0.09; P = .04) and earlier than the TF 0.5 pM (Figure 5B). Furthermore, HD MSCs incubated with CMML monocyte SN generated more thrombin (fold change: 1.66 ± 0.29) than MSCs cultured in the medium alone (fold change: 1.10 ± 0.35; P = .02) (Figure 5C).
MSC PCA was thus influenced by the peritumor microenvironment, particularly by monocyte secretions.
Thereafter, we wanted to determine more precisely which secretion products from CMML monocytes were able to confer a higher PCA to HD MSCs and whether the higher PCA was due to TF transfer (Figure 5D). HD MSCs were therefore cultured with 6 different SNs: (1) medium alone, (2) monocyte culture SN, (3) monocyte culture SN without exosomes (Exofree SN), (4) mEVs isolated from CMML monocyte SN, (5) sEVs isolated from CMML monocyte SN, and (6) mEVs and sEVs isolated from CMML monocyte SN at the same time.
First, we performed the TGA with a blocking anti-TF antibody (HTF-1) for all culture conditions to validate the involvement of TF transfer in the HD MSC PCA increase. Results showed, for all conditions tested, that the thrombin generated correspond to the contact phase with HTF-1, highlighting the fact that the PCA increase of MSCs was mediated by TF transfer. We then compared the effect of different CMML monocyte SN components on HD MSC PCA to determine which components of the monocyte SN were responsible for the PCA increase.
MSCs displayed a higher PCA when they were cultivated with CMML monocyte SN (lag-time fold change: 1.57 ± 0.1) compared with MSCs cultivated in the medium alone (fold change: 2.40 ± 0.02; P < .0001). However, when monocyte SN was ultracentrifuged to remove EVs (Exofree SN), the lag time of MSCs was lengthened and their PCA level was brought back to that of MSCs in the medium condition (fold change: 2.35 ± 0.02; P = not significant). The PCA measured corresponded to the basal PCA of HD MCS. These results suggested that CMML monocyte SN confer a higher PCA to HD MSCs through their EVs
To confirm this hypothesis, we studied the effects on PCA of mEVs alone, sEVs alone, or mEVs and sEVs at the same time, resuspended in medium.
When both mEVs and sEVs were added to the culture medium, the MSC lag time was strongly shortened compared with the lag times of MSCs cultured with Exofree SN or medium alone (fold change: 1.53 ± 0.04; P < .0001 vs Exofree SN and P < .0001 vs medium). The PCA of HD MSCs with both mEVs and sEVs was similar to that of MSCs cultured with CMML monocyte SN (P = not significant).
Lastly, we wanted to determine which EVs were responsible of the increase in MSC PCA. Compared with the medium condition, when sEVs were added to the medium, the lag time of MSCs was shortened (fold change: 1.89 ± 0.06; P < .0001) as well as mEVs (fold change: 1.98 ± 0.09; P = .001).
To summarize, CMML monocytes, through their sEVs and mEVs, were able to induce a higher PCA in HD MSCs, and this activity involves TF.
CMML MSC sEVs can transfer their TF to HSCs
We then investigated whether peritumor MSC sEVs could, in turn, interact with CD34+ cells (hereafter HSCs) to impact their PCA and proliferation ability.
First, coculture of CD34-FITC–labeled HD HSCs and DiD-labeled CMML MSC sEVs was performed. Confocal microscopy imaging showed that sEVs were able to interact with HSCs and were integrated into their cytoplasm (Figure 6A).
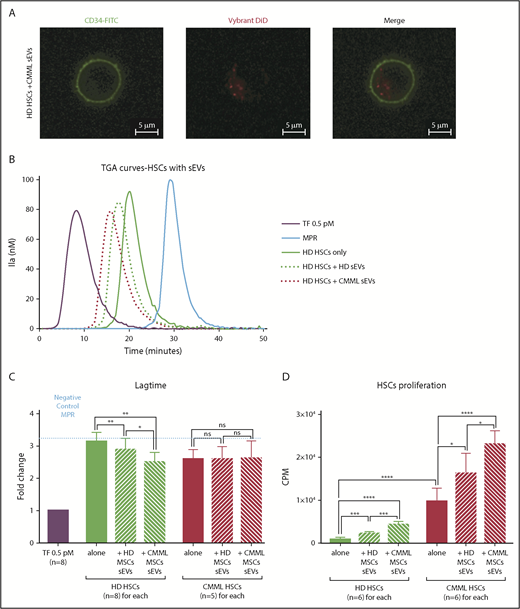
MSC sEVs can interact with HSCs and increase their PCA. Lag times are expressed as fold changes of the lag time obtained with the positive control (TF 0.5 pM). The negative control used was MPR 0.5. Any thrombin generated after corresponds to contact-phase activation. *P ≤ .05, **P ≤ .005, ***P ≤ .0005, ****P ≤ .0001. (A) Visualization of CMML MSC sEV incorporation into HD HSCs by confocal microscopy. HSCs were CD34-FITC labeled, and sEVs were Vybrant DiD labeled; visualization was on a Zeiss Dynascope LSM710 NLO, 63×/1.4 oil-immersion objective, at room temperature. (B) TGA curves of HD HSCs coincubated without or with HD MSCs vs CMML MSC sEVs. HD HSCs alone are represented by a green continuous curve, HD HSCs with HD sEVs by a green dotted curve, and HD HSCs with CMML sEVs by a red dotted curve. TF 0.5 pM is represented in purple and MPR in blue. (C) Effect of sEVs on HSC coagulation lag time. (D) Effect of sEVs on HSC proliferation (by thymidine incorporation). CPM, counts per minute.
MSC sEVs can interact with HSCs and increase their PCA. Lag times are expressed as fold changes of the lag time obtained with the positive control (TF 0.5 pM). The negative control used was MPR 0.5. Any thrombin generated after corresponds to contact-phase activation. *P ≤ .05, **P ≤ .005, ***P ≤ .0005, ****P ≤ .0001. (A) Visualization of CMML MSC sEV incorporation into HD HSCs by confocal microscopy. HSCs were CD34-FITC labeled, and sEVs were Vybrant DiD labeled; visualization was on a Zeiss Dynascope LSM710 NLO, 63×/1.4 oil-immersion objective, at room temperature. (B) TGA curves of HD HSCs coincubated without or with HD MSCs vs CMML MSC sEVs. HD HSCs alone are represented by a green continuous curve, HD HSCs with HD sEVs by a green dotted curve, and HD HSCs with CMML sEVs by a red dotted curve. TF 0.5 pM is represented in purple and MPR in blue. (C) Effect of sEVs on HSC coagulation lag time. (D) Effect of sEVs on HSC proliferation (by thymidine incorporation). CPM, counts per minute.
Then, to study the impact of MSC sEVs on the PCA of HSCs, cocultures of HSCs (n = 8 for HD HSCs and n = 5 for CMML HSCs) and sEVs were performed for 48 hours. HSC PCA was then studied by TGA (Figure 6B).
We explored 6 different conditions: CMML and HD HSCs were cultured alone, with HD MSC sEVs, or with CMML MSC sEVs
For both HD and CMML HSCs, there was no significant difference in terms of thrombin peak values when HSCs were cultured alone or with CMML or HD sEVs (data not shown).
Regarding HD HSCs, the coagulation lag time of HD HSCs (fold change: 3.10 ± 0.09) was shortened after a coculture with HD MSC sEVs (2.89 ± 0.12; P = .008) and even more with CMML MSC sEVs (2.50 ± 0.10; P = .005 vs control, P = .04 vs HD MSCs sEVs) (Figure 6B-C).
Regarding CMML HSCs, lag times were the same for the 3 conditions (fold changes: CMML HSCs only: 2.59 ± 0.13; CMML HSCs with HD MSC sEVs: 2.59 ± 0.17; CMML HSCs with CMML MSCs sEVs: 2.614 ± 0.24; P = not significant) (Figure 6C). These lag times were comparable with those of HD HSCs incubated with CMML MSC sEVs, suggesting that CMML HSCs already carry PCA.
The PCA of HD HSC was increased when they were coincubated with CMML MSC sEVs. We hypothesized that CMML sEVs were able to transfer their TF to HD HSCs and confer them a higher PCA. We demonstrated the implication of the TF in this PCA by adding anti-TF antibody (HTF-1), which restored a lag time similar to the negative control (MPR) (supplemental Figure 3).
Lastly, we analyzed the ability of sEVs to induce HSC proliferation. Cocultures of HD and CMML HSCs and MSC sEVs (n = 6 for each) were performed for 48 hours. HSC proliferation ability was then studied by thymidine incorporation (Figure 6D).
Firstly, we compared the proliferation ability of HD vs CMML HSCs cultured alone. CMML HSCs (9725.00 ± 1267.00) proliferated more than HD HSCs (921.30 ± 155.30; P < .0001).
Regarding HD HSCs, the addition of CMML sEVs induced cell proliferation (4323.00 ± 290.00) compared with HD HSCs cultured alone (921.30 ± 155.30; P < .0001). This effect was higher for CMML sEVs than for HD sEVs (2239 ± 202.70; P = .0002).
The proliferation ability of CMML HSCs was increased when sEVs were added. CMML MSC sEVs induced a greater proliferation of CMML HSCs (23 026.00 ± 1286.00) than HD MSC sEVs (16 240.00 ± 1916.00; P = .02).
However, this effect did not seem to be mediated by the TF, as there was no difference in terms of proliferation when sEVs were incubated with HTF-1 before coculture (supplemental Figure 3).
To conclude, CMML MSCs can interact with HSCs through their sEVs and modify the PCA of HSCs via TF. Their sEVs are also able to induce HSCs proliferation.
Discussion
Coagulation is known to play an important role in solid tumor growth41 and the metastatic process.42 TF itself has specific functions in tumor progression and angiogenesis that have been demonstrated in solid tumors and cancer cell lines.43 Although coagulation or hemorrhagic complications of different hematological malignancies have also been extensively studied,44 little is known about their potential impact on leukemogenesis. Our study aimed at better understanding the possible interaction between a local procoagulant climate within the tumor niche and the HSCs homeostasis in CMML.
In this work, we have demonstrated that CMML clonal monocytes and CMML peritumor MSCs have procoagulant and antifibrinolytic activity. This suggests the existence of a procoagulant climate within the CMML tumor niche.
Our data also show that the procoagulant impact of CMML cells is mediated by the sEVs shed by MSCs and monocytes. This is a new finding, as the PCA of EVs has mostly been observed on microparticles.22,32,33 Our sEVs mostly contain exosomes that come from the endosomal compartment of the cell and as such do not contain the anionic phospholipids essential for clot formation. In vivo, anionic phospholipids can be found on every activated cell membrane and on microparticles. Therefore, we performed all TGAs in the presence of anionic phospholipids (MPR) in order to show the specific impact of sEVs
In addition, we used fibrinography, a new assay currently developed45 to dynamically monitor fibrin polymerization. In the presence of TF and t-PA, we were able to observe the fibrin fibers growing during clot formation and their destruction during fibrinolysis. Although TGA is widely used, it depends on the amount of TF and the intrinsic ability of plasma to generate thrombin. Fibrinography can also be used as a coagulation assay and shows a better sensitivity than TGA for the early phase of coagulation,45-47 as it can detect the formation of fibrin before thrombin reaches a concentration high enough to be measured.45,48 It may thus be useful for the coagulation assay as well as fibrinolysis exploration.
Moreover, we showed that the PCA of sEVs derived from CMML cells is linked to the presence of TF on their membrane, thanks to 2 indirect functional techniques and a direct visualization of TF on the sEV membrane with electron microscopy and western blot, as previously shown on other subtypes of EVs.49
Within the procoagulant hematopoietic niche, a permanent crosstalk takes place between the different actors (circulating monocytes, MSCs, and HSCs and the EVs between them). Previous studies have shown that microvesicles are important players for cell crosstalk in MDSs. They highlighted the fact that microvesicles are indeed able to integrate HSCs and transfer their microRNA in order to modify HSC properties.7 By cultivating HD HSCs with CMML sEVs, we showed with confocal microscopy that sEVs can be integrated into HSCs. Using TGA, we highlighted an increase in the PCA of HSCs in the presence of CMML MSC-derived sEVs (supplemental Figure 3). With this experiment, we have shown, for the first time (to our knowledge), that CMML MSC sEVs are able to transfer their TF to HSCs. This transfer could participate in tumor development by inducing a more procoagulant microenvironment and activating specific intracellular pathways. Several previous studies have shown that TF is expressed by cancer cells and that TF signaling involving PAR2 and integrins has multiple effects on angiogenesis and tumor progression. In lymphoma cell lines, TF was also involved in nonprocoagulant pathways acting on cellular signaling pathways50 such as MAPK, phosphatidylinositol 3-kinase/AKT, JAK/STAT, and mechanistic target of rapamycin, which are involved in mitosis, cell migration, proliferation, and apoptosis.51 Although our results show that sEVs induce proliferation of HSCs, we were not able to show that this effect implicated specifically the TF. Further studies are requested to demonstrate this hypothesis.
Furthermore, monocytes are described in the literature as cells that play a particularly important role in coagulation. By comparing clinical and biological characteristics of CMML disease and the PCA of the tumor niche components as clonal monocytes and MSCs, we show that there seems to exist some correlation between the number of blood monocytes and the PCA of CMML MSC EVs (supplemental Table 2).
It has been shown in previous studies that monocytes carry TF, which is responsible for their procoagulant effect.52 Under physiological conditions, monocytes are inactivated and do not express TF. When activated in a pathological context, they acquire TF expression.53 By cultivating HD MSCs with CMML monocyte SN, we noticed by TGA an increase in the PCA of HD MSCs. Thereby, we have shown that CMML circulating monocytes are able to amplify the procoagulant climate within the hematopoietic niche by transferring TF via the sEVs they shed in the peritumor niche.
In conclusion, there is a procoagulant climate within the CMML tumor niche due to TF borne on the sEV membrane shed by clonal monocytes and peritumor MSCs. This study brings an original vision of the links among the TME, EVs, and hemostasis in CMML.
The full-text version of this article contains a data supplement.
Acknowledgments
The authors thank the Rémy Sadoul’s research group, especially Karine Laulagnier of the Grenoble Institute of Neuroscience, University Grenoble Alpes, for access to Nanosight, advice on particle analysis, and helpful discussions on EVs, as well as Anne Bertrand for technical assistance with electron microscopy. They also thank Frédéric Garban for providing patient samples.
Authorship
Contribution: J.Z., N.M., L.S., M.M., K.P.-G., C.J., D.L., J.B., F.C., M. Pezet, and M. Pernollet performed experiments; J.Z., N.M., L.S., B.P., and S.P. contributed to research design and results analysis; J.Z., N.M., and L.S. contributed to manuscript redaction; J.-Y.C. contributed to manuscript revision; and B.P. and S.P. contributed to manuscript revision and work supervision.
Conflict-of-interest disclosure: The authors declare no competing financial interests.
Correspondence: Sophie Park, Clinique Universitaire d’Hématologie, Centre Hospitalier Universitaire Grenoble Alpes, Université Grenoble Alpes, Institute for Advanced Biosciences, INSERM U1209/Centre National de la Recherche Scientifique UMR 5309, CS 10 217, 38043 Grenoble Cedex 09, France; e-mail: spark@chu-grenoble.fr.

