

Key Points
A regulatory locus of African ancestry is associated with alloantibody formation among SCD transfusion recipients.
Fine-scale considerations of ancestry are important to the interpretation of genetic studies in African-admixed populations.

Abstract
Red blood cell (RBC) transfusion remains a critical therapeutic intervention in sickle cell disease (SCD); however, the apparent propensity of some patients to regularly develop RBC alloantibodies after transfusion presents a significant challenge to finding compatible blood for so-called alloimmunization responders. Predisposing genetic loci have long been thought to contribute to the responder phenomenon, but to date, no definitive loci have been identified. We undertook a genome-wide association study of alloimmunization responder status in 267 SCD multiple transfusion recipients, using genetic estimates of ancestral admixture to bolster our findings. Analyses revealed single nucleotide polymorphisms (SNPs) on chromosomes 2 and 5 approaching genome-wide significance (minimum P = 2.0 × 10⁻⁸ and 8.4 × 10⁻⁸, respectively), with local ancestry analysis demonstrating similar levels of admixture in responders and nonresponders at implicated loci. Association at chromosome 5 was nominally replicated in an independent cohort of 130 SCD transfusion recipients, with meta-analysis surpassing genome-wide significance (rs75853687, Pmeta = 6.6 × 10⁻⁹), and this extended to individuals forming multiple (>3) alloantibodies (Pmeta = 9.4 × 10⁻⁵). The associated variant is rare outside of African populations, and orthogonal genome-wide haplotype analyses, contingent on local ancestry, revealed genome-wide significant sharing of a ∼60-kb haplotype of African ancestry at the chromosome 5 locus (Bayes Factor = 4.95). This locus overlaps a putative cis-acting enhancer predicted to regulate transcription of ADRA1B and the lncRNA LINC01847, both members of larger ontologies associated with immune regulation. Our findings provide potential insights to the pathophysiology underlying the development of alloantibodies and implicate non-RBC ancestry-limited loci in the susceptibility to alloimmunization.
Introduction
Sickle cell disease (SCD) is an autosomal recessive genetic disorder of the β-globin gene (HBB) that results in a variety of clinical consequences.1 Red blood cell (RBC) transfusions remain a critical medical intervention to abrogate these complications and have been shown to reduce overall mortality.1-3 RBC transfusion in SCD is not without its attendant complications,2 however, of which the development of alloantibodies in response to repeated RBC transfusions remains a major clinical problem.
Two immunologically distinct phenotypes in SCD transfused patients have been described: the less common immune responders, who, clinically, often develop antibodies after RBC transfusions, and the more commonly observed immune nonresponders, for whom an alloantibody response, even after multiple RBC transfusions, is unusual.4,5 In the most robust responders, alloantibodies appear to form with almost each new RBC transfusion, increasing the difficulty of obtaining compatible donor RBCs6-8 and, by proxy, increasing the likelihood of adverse transfusion reactions. Therefore, identifying individuals with the highest risk of becoming responders and understanding the events underlying the development of alloantibodies in susceptible individuals remain persistent challenges in transfusion medicine.
Both environmental and genetic factors have been implicated in alloimmunization among apparent responders. A pro-inflammatory state of recipients has been associated with an increased risk for alloimmunization,9,10 as have cumulative number of transfusions and age at first transfusion.11 Environmental factors alone, however, do not fully account for the variation in alloimmunization occurrence and severity, particularly among those with a robust responder phenotype. As a consequence, attention has turned to the recipients’ genetic composition as another source of potential variability. Candidate gene associations with the human leukocyte antigen (HLA) loci HLA-DRB112 and HLA-DQB1,13 Lupus susceptibility locus-Tripartite motif-containing protein 21 (TRIM21),14 signal transduction CD81 Molecule (CD81),15 and most recently, the Fc fragment of immunoglobulin G Receptor IIc (FCGR2C)16 have been reported with alloimmunization; however, to date, these have not been independently replicated.
In the United States, alloimmunization in SCD transfusion patients of African American or Afro-Caribbean ancestry was historically attributed to the predominantly non-African blood donor pool being the primary source of RBCs for patients with SCD17-20 ; however, alloimmunization rates have remained relatively high even when donors are primarily African American.19 Expanded phenotype matching of RBC alloantigens has reduced the overall rate of alloimmunization, although 3% to 6% of recipients still form alloantibodies, including high-risk, multiple-alloantibody formers, and there remains an appreciable rate of RBC alloimmunization even in regions in which there is greater homogeneity between blood donor and recipient pools.21,22
Given the complexity of gene-environment-ancestry interactions evident in alloimmunization, we previously employed a genome-wide association strategy to the responder phenotype in SCD23 and demonstrated a lack of identifiable loci of very large effect. In this study, we use a larger sample size, alongside ancestry- and haplotype-based analyses, to identify loci with moderate but potentially clinically relevant effects, and replicate our main findings in a second cohort of patients with SCD.
Methods
Primary study cohort
Details of the study cohort have been previously published.23 Briefly, the cohort consists of DNA samples from multiply transfused patients with SCD living predominantly in northern Louisiana and southeast Texas, who were referred to LifeShare Blood Centers for blood group genotyping before RBC transfusion. Permission to use remaining de-identified DNA samples and their corresponding demographic data in this study was obtained from the institutional review boards of Baylor College of Medicine and St. Luke’s Hospital in Houston, Texas. The cohort consists almost exclusively of adult SS genotype patients with SCD classified into 2 groups: those with no alloantibodies after receiving at least 2 transfusions of at least 2 units per episode (ie, 4 units minimum) were classified as nonresponders, and those with alloantibodies after a similar number of transfusions were referred to as responders.23 The precise number of transfusions for each individual was not available, although in the context of the proposed heightened immunity among SCD individuals, 4 units is typically sufficient to elicit an immune response.24-26 Individuals were transfused across multiple health facilities in northern Louisiana and southeast Texas and were not consistently matched for extended antibodies. Demographic distributions in cases and controls were comparable (supplemental Table 3). Our original publication comprised 94 individuals23 ; the current analysis comprises the remaining 288 genotyped samples: 154 responders and 134 nonresponders. DNA extraction and quantification were performed as previously described.23
Replication study cohort
The replication cohort was composed of adult patients with SCD mainly of self-reported African American ancestry, living in Illinois and receiving medical care at the University of Illinois at Chicago. A total of 130 patients with SCD were classified into responder cases and nonresponder control patients, using the same criteria as our discovery cohort, resulting in 62 responders and 68 nonresponders (supplemental Table 3).
Genotyping
Samples (N = 288) for the discovery cohort were genotyped on the IlluminaOmni2.5 BeadChip (Illumina, San Diego, CA) according to manufacturer’s prescribed protocol. Chip scanning, normalization, and genotype calling were performed using GenomeStudio software (Illumina). The replication cohort was genotyped on the Affymetrix Pan-African array, which interrogates approximately 2.3 million single nucleotide polymorphisms (SNPs) genome-wide.
Data quality control
Raw genotyping intensity files (iDAT) generated in the discovery cohort were imported into GenomeStudio v2.2. Resulting genotypes for non–copy number variant, autosomal SNPs were then exported to PLINK v1.07 software.27 SNPs with greater than 5% missingness, SNPs with minor allele frequency (MAF) less than 5% in both control and case patients, and SNPs not in Hardy-Weinberg equilibrium (P < .001) in control patients were filtered from analysis. This resulted in 1 509 415 SNPs for analysis.
Samples with less than 3% missing data (genotyping efficiency < 0.97) were included in analysis. Further quality control of samples included removal of individuals with sex discrepancies and high inbreeding coefficient (F > 0.1). Individuals with close relatedness (PI_HAT ≥ 0.25) were identified, and 1 individual of each pair was excluded from the data. Multidimensional scaling cluster plots were generated from linkage disequilibrium (LD) pruned SNPs (r2 < 0.2), and the first 2 multidimensional scaling components were used to identify outliers (N = 2) and to assess ancestry (supplemental Figure 2). In total, 21 samples were excluded as a result of our quality control measures (supplemental Figure 1), resulting in a final dataset of 144 cases and 123 control patients. With this sample size, the study had 80% power to detect association of common variants (MAF > 5%) of reasonable effect size (0.21 ≤ odds ratio ≥ 2.6) with 95% confidence (supplemental Methods and results).
Association analysis
Standard case/control association (allelic association) analysis using Fisher’s exact test was performed using PLINK v1.07.27 SHAPEIT28 and IMPUTE2 version 2.3.229 were used to impute regions of interest. Imputed SNPs with certainty greater than 90% were converted to hard genotype calls using PLINK version 1.9 and subject to the same quality control measures noted previously. The QQman R package30 was used to generate all Manhattan and Q-Q plots in R v3.2.3.31 LocusZoom v1.132 with genome build hg19 and data from 1000 Genomes33 African population LD was used to plot region association results. Haploview v4.234 was used for LD and haplotype block visualization. Haplotype reconstruction and phasing was carried out using PHASE35 and fastPHASE36 software. Phased haplotype sequences of interest were visually inspected, and the size of conserved regions was estimated. Raw genotyping plots for suggestive associated SNPs were visually confirmed in GenomeStudio (supplemental Figure 4).
In our discovery cohort, allelic association was performed using 144 responders (cases), 123 nonresponders (controls), and 1 509 415 SNPs. The genome-wide inflation factor for the analysis was 1.01, indicating an absence of systematic genotype biases such as population stratification, technical factors, or unaccounted familial relationships. This was supported by the resulting Q-Q plot (supplemental Figure 2) and multidimensional scaling cluster plot (supplemental Figure 3). The slight female sex bias noted among responders was also not significant (P > .05; supplemental Table 3), and the association was run without these covariates.
Local ancestry inference
Local ancestry across each chromosome for each sample was inferred using efficient local ancestry inference (ELAI).37 ELAI uses a 2-layered hidden-Markov model to learn the haplotype structure of source populations (International HapMap Project [HapMap] data38 ) and then infer ancestry of each marker in admixed samples. Quality controlled data were lifted to the human genome build hg18 from hg19 for compatibility with HapMap data files. During this process, 37 445 unmapped SNPs were removed, resulting in 1 471 970 SNPs remaining for ELAI analysis. HapMap239 European (Utah residents with Northern and Western European ancestry [CEU]) and West African (Yoruba in Ibadan, Nigeria [YRI]) population data were used as the training set (source populations). The average of 20 expectation maximization runs with upper and lower clusters set as 2 and 10, respectively, and the number of admixed generations set to 10 (recommended for African Americans) was used to infer local ancestry for each sample. Mean YRI allele dosage with 95% confidence interval (95% CI) for cases and controls was plotted against genomic position for each chromosome, using RStudio v0.99.878.
Haplotype-based ancestry-specific allele dosage association
Haplotype-based ancestry-specific allele dosage association analysis was performed using an in-house method that is an extension of the haplotype association method implemented in Haplotype Quantitative Loci software (hapQTL) designed by Xu and Guan.40 Briefly, the new method relies on local ancestry inferred from ELAI (see local ancestry inference). First, it jointly tests ancestral local haplotype loadings (see Xu and Guan40 ) in association with phenotypes, which is equivalent to a random effect model using local haplotype sharing as the random effect. Second, it computes the ancestry-specific allele dosage (Hadamard product of genotype vector and ancestry loading vector), treating this dosage as SNP genotypes to perform a single-SNP test. When an allele confers different risks on different ancestry backgrounds, this test tends to have more power than single SNP analyses. All 1 471 970 SNPs used for ELAI analysis were used for the haplotype-based ancestry. In this analysis, the first 5 principal components and sex were included as covariates.
Immunohistochemistry of human spleen
Formalin-fixed, paraffin-embedded human spleen tissue was provided by the Pathology and Histology Core at Baylor College of Medicine and was subject to immunohistochemistry staining, using an affinity-purified polyclonal rabbit antibody that is a synthetic 20-amino acid peptide derived from the c-terminus of human ADRA1B. For heat-induced antigen retrieval, the slides were heated under pressure (110°C) for 15 minutes with low pH retrieval buffer and then incubated with primary antibody (NLS697, Novus Biologicals, CO) dilutions of 1:50 and 1:100 for 1 hour at room temperature. Thereafter, enhancer (PolyVue Plus Mouse/Rabbit Enhancer; Diagnostic BioSystems, Pleasanton, CA) and horseradish peroxidase (PolyVue Plus Mouse/Rabbit HRP Label; Diagnostic BioSystems) were applied and the slides were washed with Tris-buffered saline with Tween (TBS-T). DAB chromogen/buffer (3,3′-diaminobenzidine) was used for detection, and slides were mounted for viewing and storage.
Results
Genome-wide association of alloimmunization status reveals 2 candidate loci
Our initial analysis focused on genotyped SNPs in the discovery cohort. Two clusters of SNPs, 1 each on chromosomes 2 and 5, approached our genome-wide significance cutoff of P < 5.0 × 10⁻⁸ (P = 1.7 × 10⁻⁷ for rs56737264 on chromosome 2 and P = 8.4 × 10⁻⁸ for rs75853687 on chromosome 5; Figure 1A). LD-based association mapping in populations of African ancestry using currently available SNP microarrays provides only limited coverage of genome-wide SNP variation in African cohorts41-44 ; therefore, although neither locus reached full genome-wide significance, we considered these strong candidate loci and proceeded to impute a 2-megabase region up- and downstream of the 2 SNPs in question and re-ran the association analysis.

Allelic association with responder status. (A) Loci on chromosomes 2 and 5 have SNPs close to genome-wide significance (red line, P = 5.0 × 10⁻⁸). Genomic inflation factor (based on median χ2) is 1.013. (B) LocusZoom plot of imputed chromosome 2 region. SNP rs66516066 reaches genome-wide significance. A SNP cluster in strong LD is 0.5 Mb downstream of NBAS. (C) LocusZoom plot of imputed chromosome 5 region. rs7585387 SNP cluster is located with long noncoding RNA gene LOC101927766 and 0.7 Mb upstream of ADRA1B. Purple highlighted region between peaks of increase recombination rate indicates the location of identified rare haplotype.
Allelic association with responder status. (A) Loci on chromosomes 2 and 5 have SNPs close to genome-wide significance (red line, P = 5.0 × 10⁻⁸). Genomic inflation factor (based on median χ2) is 1.013. (B) LocusZoom plot of imputed chromosome 2 region. SNP rs66516066 reaches genome-wide significance. A SNP cluster in strong LD is 0.5 Mb downstream of NBAS. (C) LocusZoom plot of imputed chromosome 5 region. rs7585387 SNP cluster is located with long noncoding RNA gene LOC101927766 and 0.7 Mb upstream of ADRA1B. Purple highlighted region between peaks of increase recombination rate indicates the location of identified rare haplotype.
On chromosome 2, 1 of the imputed SNPs (rs66516066) surpassed genome-wide significance for association and was in strong LD with our originally associated SNP rs56737264 (Figure 1B). The T allele of rs66516066 showed strong evidence for protection from responder status (odds ratio, 0.21; 95% CI, 0.11-0.37; Table 1); this was consistent with the direction and magnitude of effect observed at LD-related SNPs in this region. This cluster of SNPs on chromosome 2 is located 54.5 kb downstream the protein coding gene NBAS (Neuroblastoma Amplified Sequence; Figure 1B). Rare, recessively inherited variants in NBAS have been associated with a Mendelian disorder characterized by the immune phenotypes of atopic dermatitis, recurrent acute liver failure, and a multisystem disorder involving bone, connective tissue, liver, and the immune system.45-48
Associated SNPs at chromosome 2 and 5 loci
| Chromosome* | Position* | SNP rs ID | Minor allele | Major allele | MAF cases | MAF controls | P | Odds ratio (95% CI) | Global MAF | YRI MAF | CEU MAF | |
|---|---|---|---|---|---|---|---|---|---|---|---|---|
| 2 | 15 252,558 | rs66516066 | Imputed | T | A | 0.06 | 0.23 | 2.01e-08* | 0.21 (0.11-0.37) | 0.07 | 0.11 | 0.08 |
| 2 | 15 234,153 | rs56737264 | Genotyped | G | A | 0.09 | 0.27 | 1.56e-07 | 0.28 (0.17-0.46) | 0.07 | 0.15 | 0.07 |
| 2 | 15 242,283 | rs67088901 | Genotyped | A | G | 0.08 | 0.23 | 6.36e-07 | 0.28 (0.16-0.47) | 0.07 | 0.13 | 0.08 |
| 5 | 159 277,285 | rs75853687 | Genotyped | A | G | 0.12 | 0.01 | 8.36e-08 | 16.46 (3.91-69.26) | 0.02 | 0.10 | — |
| 5 | 159 285,569 | rs116416070 | Imputed | T | C | 0.11 | 0.00 | 1.13e-07 | 28.76 (3.89-212.8) | 0.01 | 0.10 | — |
| 5 | 159 285,922 | rs114221476 | Imputed | A | G | 0.11 | 0.00 | 1.13e-07 | 28.76 (3.89-212.8) | 0.01 | 0.10 | — |
SNP rs66516066 on chromosome 2 surpasses genome wide significance. Chromosome 5 SNPs are not observed in CEU cohort of 1000 genomes. Italics differentiate genotyped from imputed (inferred) variants.
All positions are relative to GRCh37/hg19 human genome build.
On chromosome 5, we observed a cluster of SNPs in strong LD with our originally associated SNP (Figure 1C), although none of the imputed SNPs had a lower P value than our genotyped SNP (Table 1). In this case, the associated A allele of rs75853687 was enriched among responders, with strong evidence of increasing susceptibility to develop alloantibodies (odds ratio, 16.4; 95% CI, 3.5-78.5; Table 2); this was consistent with the direction and magnitude of association at adjacent SNPs. The A allele of rs75853687 is rarely observed outside of African populations,33,49 and has its highest frequency (10%) among the YRI and Gambian in Western Divisions in the Gambia from the 1000 Genomes Project (Table 1). Haplotypes underlying such SNPs are likely to be underrepresented in current imputation panels50 ; therefore, we also maintained this locus as a candidate in subsequent analyses. The rs75853687 SNP is located in an enhancer region embedded within the lncRNA gene LINC01847/LOC101927766 and is within 100 kb of protein coding gene ADRA1B (adrenoceptor α 1B; Figure 1C) and near binding sites for multiple transcription factors and enhancer binding proteins (Figure 2).
Replication analysis of rs75853687 (chromosome 5)
| Primary analysis (0 alloantibodies vs any alloantibodies) | Multiantibody analysis (0 alloantibodies vs > 3 alloantibodies) | |||||
|---|---|---|---|---|---|---|
| Cohort | Discovery (N = 267) | Replication (N = 130) | Meta-analysis | Discovery (N = 163) | Replication (N = 91) | Meta-analysis |
| MAF cases | 0.119 | 0.067 | 0.095 | 0.100 | ||
| MAF controls | 0.008 | 0.008 | 0.016 | 0.007 | ||
| Odds ratio (95% CI) | 16.5 (3.9-69.3) | 9.6 (1.2-78.3) | 6.5 (1.8-22.8) | 15.7 (1.7-144.5) | ||
| P | 8.36e-08 | .01 | 6.59e-09* | .0036 | .0086 | 9.43e-05 |
The results also show association that extends to individuals forming multiple antibodies (multiantibody analysis) in both cohorts with comparable magnitude and direction.
![Chromosome 5 regulatory locus. Screenshot from the University of California, Santa Cruz, Genome browser80 (http://genome.ucsc.edu; Human Genome Build GRCh37/hg37 released in February 2009) showing regional binding sites for multiple transcription factors and enhancer binding proteins. Location of SNP rs75853687 is indicated by the light blue highlight. SNP rs75853687 within 1 base pair of the CEBPB binding motif, 5′-T[TG]NNGNAA[TG]-3′.](https://ash.silverchair-cdn.com/ash/content_public/journal/bloodadvances/2/24/10.1182_bloodadvances.2018020594/6/m_advances020594f2.png?Expires=1763479687&Signature=bq8v45g48CX3OG3bDS0PHnM5BXNpO~djS7EYCesTYcl0kWNvQQlXPVX-vLGl5pt1EguCRX5Zci-aHNJCtH7YCngQHzv5KGfB9Vgi2RsQnaJaaDKMbpAXGXGs7u025bZaBujY4XxM8hEc93fWzC13~BFZOQKrpZFgfCrOWxeEU5F6SqRwiTl2zFY0PwdafqL-3i0z5r0dsHVMyTG6LnI9nLvCTK3uPDkRihS8rGujIoFGj1A4TViUlArHED2dtWpEys3Im97xbdEuvHOejscb3u6r56hKO4D~4FbuIj0Tez-emOknUv5Ir7lmsOLmM9I6pjuXQm3skr48SoTqR67UlQ__&Key-Pair-Id=APKAIE5G5CRDK6RD3PGA)
Chromosome 5 regulatory locus. Screenshot from the University of California, Santa Cruz, Genome browser80 (http://genome.ucsc.edu; Human Genome Build GRCh37/hg37 released in February 2009) showing regional binding sites for multiple transcription factors and enhancer binding proteins. Location of SNP rs75853687 is indicated by the light blue highlight. SNP rs75853687 within 1 base pair of the CEBPB binding motif, 5′-T[TG]NNGNAA[TG]-3′.
Chromosome 5 regulatory locus. Screenshot from the University of California, Santa Cruz, Genome browser80 (http://genome.ucsc.edu; Human Genome Build GRCh37/hg37 released in February 2009) showing regional binding sites for multiple transcription factors and enhancer binding proteins. Location of SNP rs75853687 is indicated by the light blue highlight. SNP rs75853687 within 1 base pair of the CEBPB binding motif, 5′-T[TG]NNGNAA[TG]-3′.
Responders and nonresponders show similar local genetic ancestry at associated loci
We observed that the 2 top SNPs from our association analysis both showed evidence of ancestry-related variation in frequency (Table 1). Although we did not observe any evidence of global differences in ancestry between cases and controls, such estimates do not account for more nuanced differences in ancestry at a given locus, especially in admixed populations such as African Americans. We thus considered whether differences in local genetic ancestry between cases and controls (rather than differences in phenotype) might be driving the observed association signals. To evaluate this, we determined the genetic ancestry of responders and nonresponders at the 2 candidate loci using ELAI (Methods). ELAI uses a hidden Markov model to learn population-specific haplotype features over small genomic regions, and then assigns an individual’s local ancestry based on the haplotype features.37
Using HapMap2 European (CEU) and African (YRI) population data as our training data set, we first determined the degree of African ancestry across the genomes of both responders (cases) and nonresponders (controls). On average, African Americans have been reported to have ∼22% European ancestry (∼78% African ancestry) across the genome51-53 ; this is comparable with the mean ancestry proportions we observed in our cohort (83% African ancestry ± 12%). Next, as a proof of concept, we assessed the proportion of African ancestry at the HBB locus on chromosome 11. The high frequency of the HbS allele in Sub-Saharan African populations reflects an evolutionary response to protection from severe malarial infection54-57 ; therefore, we expected ELAI to discern a larger proportion of African ancestry at this locus. In keeping with this expectation, we observed that both responders and nonresponders have near complete African ancestry across the HBB locus, reflecting the ancestry of the HbS allele in our cohort (Figure 3A). Finally, we applied ELAI at our 2 associated loci. We did not observe significant differences in ancestry-specific allele dosages between responders and nonresponders at either locus, suggesting that association at these 2 loci is not the result of case-control differences in local genetic ancestry (Figures 3B-C).
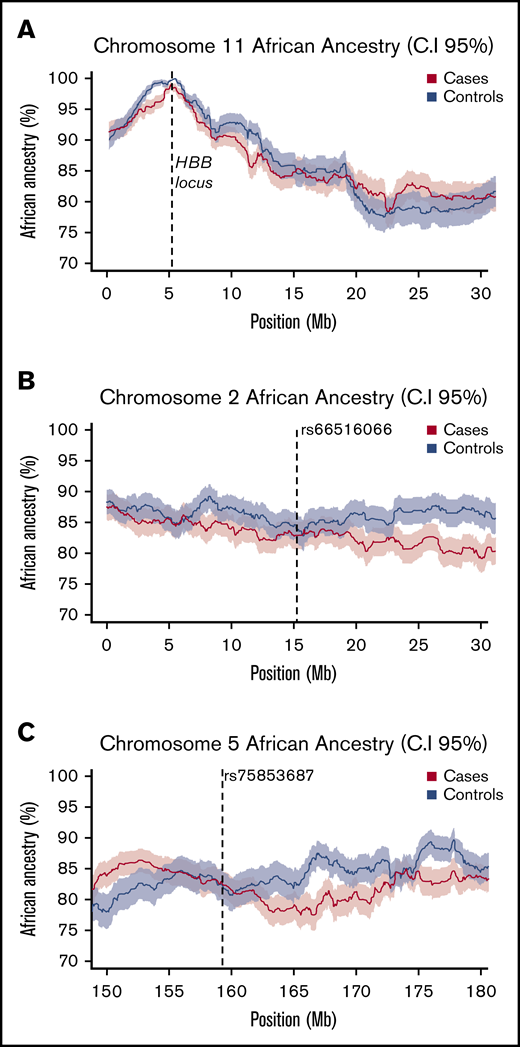
Local African ancestry of responders and nonresponders. (A) Local ancestry across chromosome 11 in cases and controls shows a strong peak of African ancestry at the HBB locus. (B-C) local African ancestry on chromosomes 2 and 5 in responders (cases) and nonresponders (controls). At each locus mean values are plotted as a bold line, with shaded values indicating upper (95%) and lower (5%) CIs.
Local African ancestry of responders and nonresponders. (A) Local ancestry across chromosome 11 in cases and controls shows a strong peak of African ancestry at the HBB locus. (B-C) local African ancestry on chromosomes 2 and 5 in responders (cases) and nonresponders (controls). At each locus mean values are plotted as a bold line, with shaded values indicating upper (95%) and lower (5%) CIs.
Association with responder status and multiple alloantibodies is observed in an independent cohort
We then sought to replicate our associations in a similarly phenotyped cohort of African American SCD transfusion responders and nonresponders (“Methods”). Despite having a smaller sample size, we observed a nominal association with responder status at our chromosome 5 SNP (P = .01), with the implicated allele having the same magnitude and direction of association in both cohorts (Table 2; supplemental Methods). The resulting meta-analysis P value surpassed genome-wide significance (P = 6.59 × 10⁻⁹). We were unable to replicate our association on chromosome 2 in this cohort.
In clinical practice, a subset of red cell antigens are polymorphic between populations, and their corresponding alloantibodies are usually the first to emerge and are encountered more frequently (eg, alloantibodies C, E, and K19,58 ). We therefore explored whether our chromosome 5 association extended beyond this baseline level of alloimmunization to the group of transfusion responders who are considered the most severe (ie, the most definitive responders), and for whom compatible blood is the most challenging: those who develop multiple alloantibodies. For this analysis, we considered both cohorts and compared the allele frequency of rs56737264 (chromosome 5 SNP) among responders having more than 3 reported alloantibodies with that observed among nonresponders. Despite the number of responders with more than 3 alloantibodies being small in both groups (supplemental Table 3), we observed strong evidence of association with virtually identical odds ratios and allele frequency distributions across both cohorts (meta-analysis P < .00001; Table 2)
Ancestry-specific allele dosage analysis reveals association of an allele on a rare African haplotype
Finally, we performed an orthogonal genome-wide analysis of our discovery cohort designed to account for local ancestry background (ie, West African or European) of an allele when testing for association. This analysis differs from the ELAI analysis in having the ability to identify interactions between ancestral haplotype background and SNP allele dosages. One locus from this analysis achieved genome-wide statistical significance: an African-restricted haplotype associated with responder status and marked by our chromosome 5 SNP (log10 Bayes Factor = 4.95; Figure 4). This observation confirmed our original allelic, single-SNP association and, consistent with the ancestry-restricted global allele frequencies, implied that this association was driven by an uncommon haplotype of African ancestry that was enriched in responder cases. Examination of phased data suggests a haplotype extending a minimum of ∼11 kb up to ∼70 kb in length (supplemental Figure 5).

Ancestry-restricted haplotype association at chromosome 5 candidate locus. SNP rs75853687 shows significant association (log10 BF= 4.954) in the restricted African ancestry analysis (A) that is not detected in the restricted European ancestry analysis (B). Red lines show typical threshold for significant log10 BF.
Ancestry-restricted haplotype association at chromosome 5 candidate locus. SNP rs75853687 shows significant association (log10 BF= 4.954) in the restricted African ancestry analysis (A) that is not detected in the restricted European ancestry analysis (B). Red lines show typical threshold for significant log10 BF.
Discussion
The development of alloimmunization can present a significant clinical challenge to identify lifesaving RBCs for transfusion. We sought to determine the role of recipient genetic factors in the development of alloimmunization among adult, long-term, RBC transfusion recipients with SCD. Our analyses revealed association on chromosome 2 (P = 2.0 × 10⁻⁸) and chromosome 5 (P = 8.4 × 10⁻⁸), with replication of the latter association in an independent cohort (meta-analysis P = 6.59 × 10⁻⁹). Association at the chromosome 5 locus, which encompasses genes and transcription factor binding sites implicated in the immune response, extended to individuals reported to develop multiple (>3) alloantibodies, and was driven by a rare haplotype of African ancestry (log10 BF > 4). Implicit in our analysis is that we were unable to replicate previously cited associated loci, HLA-DRB1, HLA-DQB1, TRIM21, CD81, and FCGR2C, in our SCD cohort. Although it is possible that these previously associated variants represent false-positive results, the lack of replication could also be a result of differing ancestries (eg, the CD81 and FCGR2C cohorts were from France and The Netherlands) or differences in study design and phenotyping approach (eg, implicated SNPs around FCGR2C are not present on the Omni2.5 chip; supplemental Table 4).
The haplotype associated with alloimmunization on chromosome 5 spans part of a lncRNA gene, LINC01847, which currently has no known function, but is highly expressed in the liver. Although lncRNA genes do not result in coded proteins, they have been shown to play a role in a number of cellular processes including gene regulation.59-61 Expanding work on lncRNAs has revealed that these genes are expressed in immune cells and add an additional tier of gene regulation in both the adaptive and innate immune systems.62-67 Some of these RNA molecules are transcribed bidirectionally from enhancer elements and have been shown to be important for gene enhancer activation,61 although the underlying mechanism is unknown. The associated region is an ENCODE project68 putative enhancer that overlies regulatory elements and contains putative binding sites for several transcription factors and enhancer binding proteins, including TCF7L2 (Transcription Factor 7 Like 2), MYC (V-Myc Avian Myelocytomatosis Viral Oncogene Homolog), CEBPB (CCAAT/Enhancer Binding Protein β), and STAT3 (Signal Transducer and Activator of Transcription 3; Figure 2). The SNP rs75853687 is within 1 base pair of the CEBPB binding motif, and increased activity of CEBPB and STAT369,70 have been shown to be pro-inflammatory.71,72
The adrenergic receptor coding gene ADRA1B (adrenoceptor α 1B) is found ∼65 kb downstream of our associated haplotype (Figure 1C). α-1 adrenergic receptors expressed on immunocompetent cell populations are activated by the sympathetic nervous system, resulting in anti-inflammatory effects.73-75 ADRA1B is highly expressed in the spleen,76 which has been implicated in the clearance of alloimmunized red blood cells, in addition to its other functions of synthesizing antibodies and extramedullary hematopoiesis.73,77 In vivo experiments on SCD model mice have shown that transfused RBCs are consumed by macrophages in the spleen,78 with splenectomy attenuating immunization to alloantigens on transfused RBCs, but not pathogens.79 The cellular role of the ADRA1B protein in spleen is uncertain; our localization studies using immunohistochemistry of human spleens (“Methods”) showed ADRA1B to be most abundant in the cytoplasm of lymphocytes and splenocytes in the red pulp, outside of follicular germinal centers (supplemental Figure 6). Thus, ADRA1B could directly interact with alloimmunized red cells and participate in their subsequent degradation. Inflammation has been shown to enhance the frequency and magnitude of immunization to transfused red blood cells,9,10,78,80 and patients with SCD are thought to have an increased level of inflammation at baseline.24-26
In the context of alloimmunization, therefore, it may be that differential binding of pro-inflammatory (or other) transcription factors to the enhancer region, consequent on the associated sequence variation, could result in differential expression of ADRA1B and/or LINC01847 or more distant genes, including IL12B (interleukin 12B), which is ∼500 kb upstream of our association. IL12B encodes a subunit of the T cell and natural killer cell cytokine, interleukin 12, that is central to Th1 immune responses.81,82 It should be possible to use CRISPR/Cas9 technology to disrupt the enhancer motif in appropriate cell types (eg, macrophages/monocytes) and use RNAseq to evaluate changes in expression of proximal genes of interest. Once identified, the paradigm could be applied to existing mouse models of red cell alloimmunization to determine the effect of the implicated genes on alloimmunization.
The associated SNPs on chromosome 5 have not been observed among non-African populations; such ancestry-limited associations are rare in the literature. Local ancestry analyses suggested that the initial associations observed in our discovery cohort were not the result of systematic differences in ancestry between responders and nonresponders at associated loci; this inference represents an aggregate assessment of ancestry from the many haplotypes across the region. Further analyses identified the chromosome 5 locus as the only region with genome-wide significant evidence of ancestry-limited haplotype association, with a signal that was contingent on African ancestry. This suggests that at least some of the increased risk for alloimmunization among SCD transfusion recipients may be the result of genetic ancestry that is independent of RBC blood group antigens. This would be consistent with rates of alloimmunization in global SCD populations in which donors and recipients are better matched for RBC alloantigens. Recently, it has been postulated that immune transcriptional responses vary with ancestry83 as the result of dissimilar selection pressures in different geographical regions, resulting in a significantly higher expression of pro-inflammatory genes among Africans compared with Europeans. This would presumably be advantageous in areas with high rates of endemic infectious diseases such as might be observed across Africa84,85 and would be consistent with our observed association.
We also observed a cluster of associated SNPs in strong LD on chromosome 2 located 55 kb upstream of a biologically plausible alloimmunization candidate: NBAS. Despite having adequate power (supplemental Methods and results), we were unable to replicate this association, which might reflect ancestral, clinical, or immunological differences between the 2 cohorts (eg, there is a significant female sex bias in our replication cohort; supplemental Table 3). In the absence of replication, we cannot confidently assert NBAS as a robust candidate locus, and thus await the results of future studies of alloimmunization in larger SCD cohorts with more detailed phenotyping86 to clarify or refute this association. A further consideration is our characterization of nonresponders, which was agnostic to follow-up data; although unlikely, it is possible that some of the nonresponders could have produced alloantibodies after additional transfusions. The effect of this on our association would depend on the frequency of the associated SNP among misclassified individuals.
Our results reflect what, to our knowledge, is the first replicated genome-wide association study of RBC alloimmunization among multiply transfused RBC recipients with SCD. Our analyses suggest that non-RBC genetic variation of African ancestry may contribute to the increased incidence of alloimmunization in this population, and our findings implicate a locus with putative biological relevance to the development of alloimmunization in SCD. Future studies, focused on functional validation and delineation of the mechanism or mechanisms underlying this association, could herald important avenues for therapeutic exploitation. Similarly, the large effect-size noted in both cohorts suggests that our findings may also be of diagnostic relevance as a means of identifying SCD individuals with increased susceptibility to RBC alloimmunization, for whom expanded antigen profiling and targeted prophylaxis could be implemented. This would provide for a more equitable allocation of resources, while limiting the attendant clinical challenges associated with RBC alloimmunization.
Acknowledgments
The authors thank Barrie Hanchard and Michael Ittmann for assistance with spleen pathology. They thank John Belmont, Joann Moulds, and Chance Luckey for their input during the initial study design and subsequent analyses.
This study was supported by research grants from the National Blood Foundation (grant NBF 1103112502) (N.A.H.) and from the Center for Computational and Integrative Biological Research at Baylor College of Medicine (Y.G. and N.A.H.). L.M.W. and N.A.H. were supported in undertaking this work through the Collaborative African Genetics Network of the Human Health and Heredity in Africa Project (grant 1U54AI110398-01A1). Z.Q. and Y.G. are supported in part by grant R01 HG008157 from the National Institutes of Health, National Human Genome Research Institute. R.F.M. is supported by National Institutes of Health, National Heart, Lung, and Blood Institute grant R01 HL111656.
Authorship
Contribution: L.M.W. performed research, analyzed data, and wrote the paper; Z.Q. and Y.G. performed local ancestry inference and haplotype association analysis; K.B., S.H., and R.K. provided the replication cohort and performed the replication; N.J.H. performed the immunohistochemistry staining; R.F.M. and S.C.-L. provided the study samples; A.C. and N.A.H. conceived and designed the study; and all authors approved and commented on the manuscript.
Conflict-of-interest disclosure: The authors declare no competing financial interests.
Correspondence: Neil A. Hanchard, Department of Molecular and Human Genetics, Baylor College of Medicine, 1 Baylor Plaza, Houston, TX 77030; e-mail: hanchard@bcm.edu.

