

Key Points
HLA eplet–derived epitope mismatch may quantify HLA disparity more accurately than HLA allele mismatch in haploidentical transplantation.
HLA eplet–derived epitope mismatch is associated with decreased relapse and delayed engraftment in haploidentical transplantation.

Abstract
HLA disparity is traditionally measured at the antigen or allele level, and its impact on haploidentical hematopoietic cell transplantation (haplo-HCT) with high-dose posttransplant cyclophosphamide (PTCy) is unclear. To the best of our knowledge, the relationship between HLA eplet–derived epitope mismatch (EM) and clinical outcome has not been examined in haplo-HCT. We retrospectively analyzed 148 patients who received a peripheral blood, T-cell–replete haplo-HCT with PTCy at a single center. HLA EM was quantified using an HLAMatchmaker-based method and was stratified by class and vector. The primary outcome was incidence of relapse. The total number of mismatched epitopes (MEs) per patient-donor pair in our patient population ranged from 0 to 51 (median, 24) in the graft-versus-host (GVH) direction and 0 to 47 (median, 24) in the host-versus-graft (HVG) direction. Higher HLA class II EM in the GVH direction was associated with a significantly reduced risk of relapse (adjusted hazard ratio [HR], 0.952 per ME; P = .002) and improved relapse-free survival (adjusted HR, 0.974 per ME; P = .020). Higher HLA class II EM in the HVG direction was associated with longer time to neutrophil (adjusted HR, 0.974 per ME; P = .013) and platelet (adjusted HR, 0.961 per ME; P = .001) engraftment. In peripheral blood haplo-HCT patients, increased HLA EM was associated with a protective effect on the risk of relapse in the GVH direction but a negative effect on time to count recovery in the HVG direction. HLA EM based on the HLA Matchmaker represents a novel strategy to predict clinical outcome in haplo-HCT.
Introduction
Allogeneic hematopoietic cell transplantation (allo-HCT) is a vital therapy for hematologic malignancies and often represents the only curative therapy for refractory disease.1 Historically, HLA-matched sibling donors provide the best clinical outcomes,2 whereas HLA-matched unrelated donors (MUDs) are considered the second-line option.2,3 However, matched sibling donors and MUDs are often limited by donor availability, especially for ethnic minorities.4,5 This limitation represents a major obstacle and restricts the number of patients who can receive potentially curative allo-HCT. In contrast, the parents and children of a patient are all potential haploidentical donors by sharing at least 1 HLA haplotype, with each sibling having a 50% chance. Thus, haploidentical allo-HCT (haplo-HCT) represents an attractive alternative to MUD allo-HCT due to its increased donor availability. With the use of posttransplant cyclophosphamide (PTCy) to selectively deplete alloreactive T cells,6-10 haplo-HCT has been shown to have similar outcomes when compared with MUD allo-HCT.8,11-17
Given the increased donor availability for haplo-HCT, several studies have investigated the impact of donor characteristics on clinical outcomes, with HLA disparity representing a topic of particular interest.18-22 For patients undergoing mismatched unrelated allo-HCT, increased HLA mismatch has been associated with inferior survival and increased treatment-related mortality (TRM).23-28 However, the impact of HLA disparity in haplo-HCT is less clear, with the previous literature presenting differing results.18-22
HLA disparity is traditionally measured at the antigen or allele level. The HLAMatchmaker program, however, measures HLA disparity at the level of the HLA eplet–derived epitope, which is defined as a 3-dimensional patch of linear or discontinuous polymorphic amino acids within a 3-Å radius on the surface of an HLA antigen capable of inducing an alloantibody response.29,30 Duquesnoy29 and Duquesnoy and Askar30 developed the definition of the eplet-derived epitope through the study of molecular models of crystallized antigen-antibody complexes.29,30 They subsequently compiled a comprehensive database of eplet-derived epitopes present on the surfaces of HLA antigens through the study of crystallographic structures of HLA molecules.29,30 With the use of this database, the HLAMatchmaker algorithm quantifies the structural and functional differences between a donor and recipient’s HLA antigens that may induce subsequent antibody responses. In the setting of kidney transplantation, greater class II eplet–derived epitope mismatch (EM) was associated with the development of donor-specific antibodies (DSAs) and shortened graft survival.31
To the best of our knowledge, the role of HLA eplet–derived EM has not been studied in the setting of haplo-HCT. We hypothesized that a higher degree of HLA EM in the graft-versus-host (GVH) direction would be associated with an enhanced graft-versus-leukemia (GVL) effect leading to a protective effect on relapse. To test this hypothesis, we assessed the impact of HLA disparity at the epitope level on patient outcomes after haplo-HCT. We found that increased HLA class II EM was associated with a significantly decreased risk of relapse in the GVH direction and delayed count recovery in the host-versus-graft (HVG) direction, which may inform decisions on donor selection and posttransplant care.
Materials and methods
Patients and demographics
We performed a retrospective study on 148 patients receiving PTCy-based, peripheral blood, T-cell–replete haplo-HCT at a single center from July 2009 to May 2016. The date of last follow-up was September 2016. Diagnoses included acute myeloid leukemia (AML), acute lymphoblastic leukemia (ALL), chronic myeloid leukemia, Hodgkin lymphoma, non-Hodgkin lymphoma, myelodysplastic syndrome, multiple myeloma, and severe aplastic anemia. All patients age 18 years or older receiving PTCy-based, peripheral blood, T-cell–replete haplo-HCT were included regardless of diagnosis. Per protocol, patients (95%) received tacrolimus and mycophenolate mofetil for graft-versus-host disease (GVHD) prophylaxis in addition to PTCy unless intolerant. The Institutional Review Board at Washington University in St. Louis approved this study. Informed consent was waived given the study’s retrospective nature. Data collection on patient demographics and clinical variables was conducted systematically by a single chart reviewer. For original data, please contact the corresponding authors.
HLA disparity
High-resolution HLA-typing data were collected for the following HLA loci: A, B, C, DRB1, and DQB1. High-resolution HLA typing was performed by a combination of sequence-based typing, reverse sequence-specific oligos, or sequence-specific primer methods. For patients or donors with intermediate HLA-typing data only, their 2-field, high-resolution HLA typing was inferred using the online tool Haplostats (www.haplostats.org).32 The most likely HLA high-resolution typing was chosen for each case. HLA EM was quantified using the HLAMatchmaker software (HLAMatchmaker ABC Eplet Matching version 2.0 and DRDQDP Matching version 2.1; http://www.hlamatchmaker.net)29,30 and a Python script (available at https://github.com/cliu32/hla-mm) in a dose-dependent fashion in the GVH and HVG directions separately. EM was further stratified by HLA class. The HLAMatchmaker software considers both antibody-verified and theoretically predicted epitopes, or “eplets,” which are defined as 3-dimensional patches of linear or discontinuous polymorphic amino acids within a 3-Å radius on the surface of an HLA antigen capable of inducing an alloantibody response.29,30
Outcomes
The primary outcome was the incidence of relapse. Secondary outcomes were overall survival (OS), relapse-free survival (RFS), TRM, acute GVHD (aGVHD [all grades]), chronic GVHD (cGVHD), time to neutrophil engraftment, time to platelet engraftment, and graft failure. OS was defined as the time from day 0 of the haplo-HCT to time of last follow-up or death from any cause. RFS was defined as the time from day 0 of the haplo-HCT to relapse or death from a cause other than relapse of disease. Relapse was defined per accepted criteria.33 TRM was defined as death prior to day +28 or due to any cause other than relapsed disease. aGVHD and cGVHD were defined by previously accepted criteria.34,35 Time to neutrophil engraftment was defined as the first of 3 consecutive days with an absolute neutrophil count (ANC) >500 cells per microliter. Time to platelet engraftment was defined as the first of 2 weeks with a platelet count >20 000 cells per microliter with no transfusion support in the past 2 weeks. Primary graft failure was defined as undetectable (<5%) donor chimerism on short-tandem-repeat testing in the absence of disease relapse leading to death or retransplantation. Secondary graft failure was loss of donor chimerism or decline of ANC to below 500 cells per microliter in the absence of relapse, GVHD, and cytomegalovirus (CMV) infection. Graft failure in this study included patients with both primary and secondary failure. Patients with death prior to day +28 were excluded from consideration for graft failure.
Data analysis and statistics
Patient demographics and disease characteristics were summarized using counts and frequencies for categorical variables or means and standard deviations for continuous variables. The distributions of patient demographics and disease characteristics across total HLA EM (dichotomized by its median) were compared using the Student t test, χ2 test, or Mann-Whitney U test as appropriate.
The amount of EM and allele mismatch (AM), stratified by class and vector, were both analyzed as a continuous variable in relation to the primary and secondary outcomes, and the assumption of linearity was assessed graphically based on residuals out of the corresponding regression models. Associations between HLA disparity (including both EM and AM) and OS or RFS were assessed using Cox proportional hazards regression models. Cumulative incidences of relapse, TRM, aGVHD, cGVHD, neutrophil engraftment, and platelet engraftment were estimated using Gray subdistribution regression to account for competing risks. Death without relapse was considered a competing risk for relapse. Relapse was considered a competing risk for TRM. Death without count recovery was considered a competing risk for count recovery. Graft failure, relapse, or death without GVHD were considered competing risks for GVHD. To facilitate graphical presentation, HLA disparity was also dichotomized by the median and the curves of survival or cumulative incidence were estimated using Kaplan-Meier product limit methods and compared by the log-rank test or Gray test as appropriate.
Associations between HLA disparity and outcomes in the univariate analysis were adjusted for other significant demographic and clinical variables in a multivariate analysis. Covariates considered for adjustment were: male sex; age at transplant; donor age at transplant; presence of sex mismatch; CMV match status; donor relationship; presence of ablative regimen; disease status at transplant (active vs remission); refined Disease Risk Index (DRI)36 (low/intermediate vs high/very high); Hematopoietic Cell Transplant Comorbidity Index (HCT-CI)37 ; presence of DSAs; and presence of any, class I, or class II anti-HLA antibodies. Due to the relatively small sample size, these potential confounders were adjusted using marginal structural models with an inverse probability weighting (IPW). Specifically, a linear regression model was fitted to each of the HLA disparity indices to estimate the conditional probability of the observed HLA disparity level given individuals’ demographic and clinical characteristics. The inverse of these probabilities were then used as weights when estimating the associations between the HLA disparity indices and clinical outcomes. This weighting process literally created a “pseudopopulation” that was balanced in terms of potential confounders across all HLA disparity levels.38 Additionally, a prespecified subset analysis was performed for AML vs non-AML patients and AML active disease vs AML remission patients. All tests were 2-sided, and significance was set at a P value of .05. The inverse probability weights were calculated with the library ipw in statistical package R,38 and all other analyses were performed using SAS 9.4 (SAS Institutes, Cary, NC).
Results
Patient characteristics
We identified 148 patients who underwent haplo-HCT during the study period (Table 1). Seventy-five patients (50.7%) were male. The median age at transplant was 53 years (range, 19-73 years), and the median donor age at transplant was 42 years (range, 15-70 years). Ninety-five patients (64.2%) had AML. Sixty-one patients (41.2%) received an ablative regimen. Seventy-seven patients (54.6%) had high- or very-high-risk disease based on the refined DRI.36 Seventy-one patients (48.0%) had a sex-mismatched donor, and 58 patients (39.2%) had a CMV-mismatched donor.
Patient characteristics, stratified by total EM in the GVH and HVG directions
| Patient characteristic | Total, N = 148 | Total GVH EM below the median, N = 76 | Total GVH EM above the median, N = 72 | P* | Total HVG EM below the median, N = 72 | Total HVG EM above the median, N = 76 | P* |
|---|---|---|---|---|---|---|---|
| Male sex, n (%) | 75 (50.7) | 36 (47.4) | 39 (54.2) | NS | 36 (50.0) | 39 (51.3) | NS |
| Male sex, donor, n (%) | 92 (62.2) | 50 (65.8) | 42 (58.3) | NS | 45 (62.5) | 47 (61.8) | NS |
| Age at transplant, median (range), y | 53 (19-73) | 53 (19-73) | 50 (21-72) | NS | 52 (19-73) | 53 (19-73) | NS |
| Donor age at transplant, median (range), y | 42 (15-70) | 43 (15-70) | 42 (15-67) | NS | 43 (15-69) | 42 (16-70) | NS |
| Patient ethnicity, n (%) | |||||||
| African American | 23 (15.5) | 15 (19.7) | 8 (11.1) | NS | 14 (19.4) | 9 (11.8) | NS |
| White | 119 (80.4) | 57 (75.0) | 62 (86.1) | 55 (76.4) | 63 (84.2) | ||
| Other | 6 (4.1) | 4 (5.3) | 2 (2.8) | 3 (4.2) | 3 (4.0) | ||
| Sex mismatch, n (%) | |||||||
| Female patient/donor | 29 (19.6) | 13 (17.1) | 16 (22.2) | NS | 16 (22.2) | 13 (17.1) | NS |
| Female patient, male donor | 44 (29.7) | 27 (35.5) | 17 (23.6) | 20 (27.8) | 24 (31.6) | ||
| Male patient, female donor | 27 (18.2) | 13 (17.1) | 14 (19.4) | 11 (15.3) | 16 (21.1) | ||
| Male patient/donor | 48 (32.4) | 23 (30.3) | 25 (34.7) | 25 (34.7) | 23 (30.1) | ||
| Donor relationship, n (%) | |||||||
| Child | 51 (34.9) | 26 (34.7) | 25 (35.2) | 24 (33.8) | 27 (36.0) | ||
| Parent | 23 (15.8) | 13 (17.3) | 10 (14.1) | 8 (11.3) | 15 (20.0) | ||
| Sibling | 72 (49.3) | 36 (48.0) | 36 (50.7) | 39 (54.9) | 33 (44.0) | ||
| Other | 2 (1.4) | ||||||
| CMV serostatus, n (%) | |||||||
| Donor/recipient positive | 45 (30.4) | 21 (27.6) | 24 (33.3) | NS | 27 (37.5) | 18 (23.7) | .088 |
| Donor positive, recipient negative | 19 (12.8) | 8 (10.5) | 11 (15.3) | 5 (6.9) | 14 (18.4) | ||
| Donor negative, recipient positive | 39 (26.4) | 23 (20.3) | 16 (22.2) | 20 (27.8) | 19 (25.0) | ||
| Donor/recipient negative | 45 (30.4) | 24 (31.6) | 21 (29.2) | 20 (27.8) | 25 (32.9) | ||
| ABO mismatch, n (%) | |||||||
| Bidirectional | 5 (3.4) | 3 (4.0) | 2 (2.8) | NS | 1 (1.4) | 4 (5.3) | NS |
| Major | 21 (14.2) | 10 (13.2) | 11 (15.3) | 10 (13.9) | 11 (14.5) | ||
| Minor | 28 (18.9) | 15 (19.7) | 13 (18.1) | 11 (15.3) | 17 (22.4) | ||
| Matched | 94 (63.5) | 48 (63.2) | 46 (63.9) | 50 (69.4) | 44 (57.9) | ||
| KPS, median (range) | 80 (50-100) | 85 (50-100) | 80 (50-100) | NS | 90 (50-100) | 80 (50-100) | .050 |
| HCT-CI,38 median (range) | 3 (0-9) | 3 (0-9) | 3 (0-9) | NS | 3.5 (0-9) | 3 (0-9) | NS |
| CD34 cell dose, median (range), 106 cells/kg | 5 (1.6-14.2) | 5 (2.4-14.2) | 5 (1.6-9.3) | NS | 5.0 (2.4-9.3) | 5.0 (1.6-14.2) | NS |
| CD3 cell dose, median (range), 107 cells/kg | 17.8 (0-68.5) | 17.3 (0.1-68.5) | 19.3 (0-59.4) | NS | 18.1 (0.1-59.4) | 17.4 (0-68.5) | NS |
| Ablative regiment received, n (%) | 61 (41.2) | 25 (32.9) | 36 (50.0) | .035 | 26 (36.1) | 35 (46.1) | NS |
| Diagnosis, n (%) | |||||||
| AML | 95 (64.2) | 46 (60.5) | 49 (68.1) | NS | 47 (65.3) | 48 (63.2) | NS |
| Other (ALL, MDS, severe aplastic anemia, lymphoma, multiple myeloma, other leukemia) | 53 (35.8) | 30 (39.5) | 23 (31.9) | 25 (34.7) | 28 (36.8) | ||
| Active disease at transplant, n (%) | 60 (40.5) | 26 (36.6) | 34 (48.6) | .15 | 25 (36.8) | 35 (48.0) | .18 |
| DRI,37 n (%) | |||||||
| Low/intermediate | 64 (45.4) | 33 (46.5) | 31 (44.3) | NS | 34 (50.0) | 30 (41.1) | NS |
| High/very high | 77 (54.6) | 38 (53.5) | 39 (55.7) | 34 (50.0) | 43 (58.9) | ||
| N/A (aplastic anemia) | 7 (4.7) | ||||||
| Presence of DSAs, n (%) | 23 (15.8) | 10 (13.2) | 13 (18.1) | NS | 8 (11.1) | 15 (19.7) | NS |
| Not tested | 22 (14.9) | 10 (13.2) | 12 (16.7) | 11 (15.3) | 11 (14.5) | ||
| Recipient anti-HLA antibodies, n (%) | |||||||
| Class I | 61 (41.2) | 29 (43.9) | 32 (53.3) | NS | 30 (49.2) | 31 (47.7) | NS |
| Class II | 34 (27.0) | 16 (24.2) | 18 (30.0) | NS | 15 (24.6) | 19 (23.2) | NS |
| Class I and II | 64 (50.8) | 30 (45.4) | 34 (56.7) | NS | 31 (50.8) | 33 (50.8) | NS |
| Not tested | 22 (14.9) | ||||||
| History of prior allo-HCT, n (%) | 44 (29.7) | 18 (23.7) | 26 (36.1) | .098 | 17 (23.6) | 27 (35.5) | .11 |
MDS, myelodysplastic syndrome; N/A, not applicable; NS, nonsignificant (P > .2).
The parametric P value is calculated by analysis of variance for numerical covariates and the χ2 test for categorical covariates.
Patients were stratified by total (class I and II) EM in the GVH and HVG directions above and below the median (Table 1). Patients with total EM in the GVH direction above the median had a significantly higher rate of receiving an ablative regimen (36 vs 25; P = .035) when compared with those below the median. Patients with total EM in the HVG direction above the median had a significantly lower Karnofsky Performance Status (KPS) (80 vs 90; P = .050) when compared with those below the median. No other patient characteristics varied significantly between these groups.
HLA high-resolution typing
Thirty patients (20.3%), 8 donors (5.4%), and 3 patient-donor pairs (2.0%) had HLA high-resolution typing at HLA-A, B, C, DRB1, and DQB1. However, 123 patients (83.1%), 115 donors (77.7%), and 102 patient-donor pairs (68.9%) had HLA class II high-resolution typing at DRB1 and DQB1. HLA high-resolution typing provided by Haplostats had a median likelihood percentage of 85.6% (range, 27.2%-100%) for patients and 75.6% (range, 7.5%-100%) for donors.
Distributions of HLA EM
The median of total EM in the GVH direction was 24 (range, 0-51) (Table 2). The median of total EM in the HVG direction was 24 (range, 0-47). Total, class I, and class II HLA EM in the GVH and HVG directions were plotted against the corresponding HLA AM category to characterize their relationship (Figure 1). EM correlated with AM (R2 ranging from 0.39 to 0.59), but significant overlap existed between the ranges of EM for each level of AM in all categories.
Univariate relationships between EM and clinical outcomes
| GVH | HVG | |||||
|---|---|---|---|---|---|---|
| Outcome | HR | 95% CI | P | HR | 95% CI | P |
| Class I EM | ||||||
| Relapse | 1.011 | 0.965-1.059 | NS | 1.015 | 0.975-1.058 | NS |
| OS | 1.014 | 0.976-1.053 | NS | 1.034 | 0.996-1.074 | .082 |
| RFS | 1.019 | 0.984-1.056 | NS | 1.035 | 1.000-1.072 | .049 |
| TRM | 1.012 | 0.962-1.064 | NS | 1.032 | 0.978-1.088 | NS |
| aGVHD | 0.991 | 0.954-1.030 | NS | — | — | — |
| cGVHD | 0.981 | 0.933-1.033 | NS | — | — | — |
| Neutrophil engraftment | — | — | — | 0.975 | 0.949-1.003 | .075 |
| Platelet engraftment | — | — | — | 0.974 | 0.945-1.003 | .079 |
| Class II EM | ||||||
| Relapse | 0.966 | 0.938-0.995 | .023 | 0.994 | 0.964-1.025 | NS |
| OS | 0.983 | 0.961-1.006 | .145 | 1.009 | 0.985-1.033 | NS |
| RFS | 0.978 | 0.957-0.999 | .037 | 1.007 | 0.985-1.029 | NS |
| TRM | 1.006 | 0.976-1.037 | NS | 1.013 | 0.982-1.046 | NS |
| aGVHD | 1.004 | 0.978-1.030 | NS | — | — | — |
| cGVHD | 1.007 | 0.977-1.039 | NS | — | — | — |
| Neutrophil engraftment | — | — | — | 0.976 | 0.955-0.997 | .027 |
| Platelet engraftment | — | — | — | 0.971 | 0.950-0.993 | .010 |
| Total EM | ||||||
| Relapse | 0.978 | 0.954-1.004 | .091 | 1.000 | 0.978-1.023 | NS |
| OS | 0.991 | 0.972-1.011 | NS | 1.015 | 0.995-1.035 | .142 |
| RFS | 0.989 | 0.971-1.007 | NS | 1.014 | 0.996-1.032 | .137 |
| TRM | 1.008 | 0.983-1.033 | NS | 1.018 | 0.989-1.048 | NS |
| aGVHD | 1.000 | 0.979-1.023 | NS | — | — | — |
| cGVHD | 1.000 | 0.973-1.028 | NS | — | — | — |
| Neutrophil engraftment | — | — | — | 0.977 | 0.959-0.996 | .015 |
| Platelet engraftment | — | — | — | 0.975 | 0.958-0.992 | .004 |
GVH (median, 24; range, 0-51); HVG (median, 25; range, 0-47).
—, test not performed.
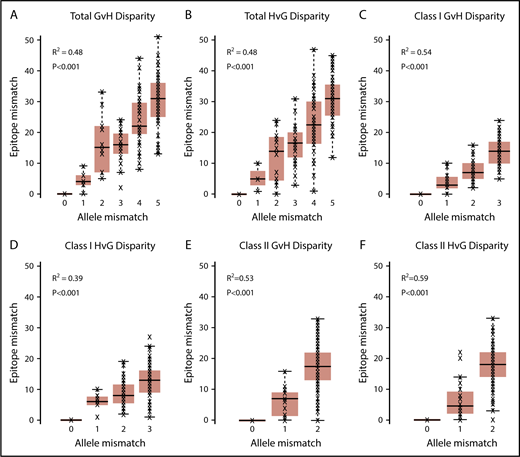
HLA EM plotted against HLA AM. Total (A), class I (C), and class II (E) GVH disparities and total (B), class I (D), and class II (F) HVG disparities are shown. HLA EM correlated with AM in all classes and vector directions (R2 ranging from 0.39 to 0.59), but significant overlap existed between the ranges of EM for each level of AM in all categories.
HLA EM plotted against HLA AM. Total (A), class I (C), and class II (E) GVH disparities and total (B), class I (D), and class II (F) HVG disparities are shown. HLA EM correlated with AM in all classes and vector directions (R2 ranging from 0.39 to 0.59), but significant overlap existed between the ranges of EM for each level of AM in all categories.
Patient outcomes
The median time to follow-up for survivors was 19.6 months (range, 2.9-65.8 months). Eighty-eight patients (59.5%) were deceased, and 56 patients (37.8%) had relapsed disease by the time of the last follow-up. Seventy-three patients (50.7%) developed aGVHD (any grade), and 38 (26.0%) developed cGVHD. The median time to neutrophil engraftment was 17 days (range, 10-78 days) among the 133 neutrophil-engrafted patients, and the median time to platelet engraftment was 29 days (range, 8-214 days) among the 112 platelet-engrafted patients. Six patients (4.1%) had graft failure.
Class II EM in the GVH direction was associated with reduced relapse and improved RFS
We found a significant association between class II EM in the GVH direction and a lower incidence of relapse (hazard ratio [HR], 0.966 per mismatched epitope [ME]; 95% confidence interval [CI], 0.938-0.995; P = .023) on univariate analysis (Table 2; Figure 2A). Class I, class II, and total EM in the HVG direction were not associated with reduced relapse. Multivariate analysis was performed using IPW to adjust for potential confounders, and class II EM in the GVH direction remained significantly associated with a reduced incidence of relapse (adjusted HR, 0.952 per ME; 95% CI, 0.923-0.982; P = .002) (Table 3). Univariate associations between potential confounders and selected clinical outcomes are included in supplemental Table 1. Individual class II loci were then studied to delineate the relationship between class II EM and relapse. DRB1 EM in the GVH direction was associated with decreased relapse (HR, 0.933 per ME; 95% CI, 0.885-0.982; P = .008), whereas DQB1 EM in the GVH direction was not (supplemental Table 2).
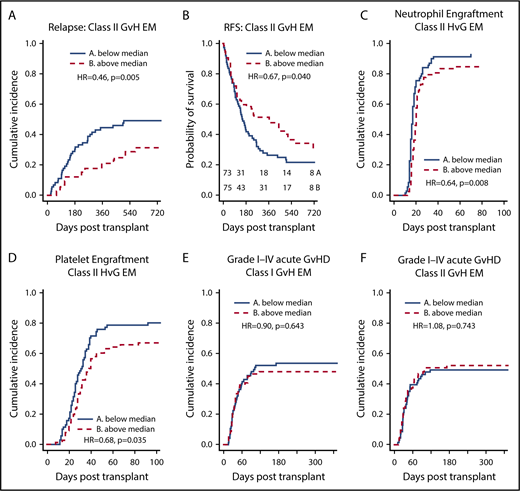
EM, stratified by the median, and clinical outcomes. (A-B) Greater class II EM in the GVH direction was associated with reduced incidence of relapse and improved RFS, and these associations remained significant in multivariate analysis. (C-D) Greater class II EM in the HVG direction was associated with longer time to neutrophil and platelet engraftment, and these associations remained significant in multivariate analysis. (E-F) Class I and II EM in the GVH direction were not associated with aGVHD of any grade.
EM, stratified by the median, and clinical outcomes. (A-B) Greater class II EM in the GVH direction was associated with reduced incidence of relapse and improved RFS, and these associations remained significant in multivariate analysis. (C-D) Greater class II EM in the HVG direction was associated with longer time to neutrophil and platelet engraftment, and these associations remained significant in multivariate analysis. (E-F) Class I and II EM in the GVH direction were not associated with aGVHD of any grade.
Selected multivariate analyses for EM, AM, and clinical outcomes
| GVH | HVG | |||||
|---|---|---|---|---|---|---|
| Outcome | Adjusted HR | 95% CI | P | Adjusted HR | 95% CI | P |
| Multivariate analyses for class II EM | ||||||
| Relapse, all patients | 0.952 | 0.923-0.982 | .002 | — | — | — |
| Relapse, AML patients | 0.959 | 0.926-0.994 | .022 | — | — | — |
| RFS | 0.974 | 0.952-0.996 | .020 | — | — | — |
| Neutrophil engraftment | — | — | — | 0.974 | 0.954-0.995 | .013 |
| Platelet engraftment | — | — | — | 0.961 | 0.938-0.983 | .001 |
| Multivariate analyses for class II AM | ||||||
| Relapse, all patients | 0.645 | 0.451-0.924 | .017 | — | — | — |
| Platelet engraftment | — | — | — | 0.609 | 0.474-0.781 | <.001 |
Multivariate analyses were conducted using marginal structural models with IPW. Covariates considered for adjustment were: male sex; age at transplant; donor age at transplant; presence of sex mismatch; CMV match status; donor relationship; presence of ablative regiment; disease status at transplant (active vs remission); refined DRI37 (low/intermediate vs high/very high); HCT-CI38 ; presence of DSAs; and presence of any class I or class II anti-HLA antibodies.
—, test not performed.
Univariate analysis also identified a significant association between class II AM in the GVH direction and a lower incidence of relapse (HR, 0.720 per mismatched allele [MA]; 95% CI, 0.524-0.990; P = .043) (Table 4). Similar to EM, class I, class II, and total AM in the HVG direction were not associated with reduced relapse. After multivariate adjustment, class II AM in the GVH direction remained significantly associated with a reduced incidence of relapse (adjusted HR, 0.645 per MA; 95% CI, 0.451-0.924; P = .017) (Table 3).
Univariate relationships between AM and selected clinical outcomes
| GVH | HVG | |||||
|---|---|---|---|---|---|---|
| Outcome | HR | 95% CI | P | HR | 95% CI | P |
| Class I AM* | ||||||
| Relapse | 0.917 | 0.688-1.223 | NS | 1.042 | 0.788-1.377 | NS |
| RFS | 1.178 | 0.909-1.526 | NS | 1.363 | 1.056-1.760 | .018 |
| Neutrophil engraftment | — | — | — | 0.870 | 0.743-1.019 | .085 |
| Platelet engraftment | — | — | — | 0.871 | 0.743-1.021 | .088 |
| Class II AM† | ||||||
| Relapse | 0.720 | 0.524-0.990 | .043 | 0.785 | 0.571-1.079 | .136 |
| RFS | 0.819 | 0.633-1.061 | .130 | 0.922 | 0.715-1.188 | NS |
| Neutrophil engraftment | — | — | — | 0.876 | 0.684-1.120 | NS |
| Platelet engraftment | — | — | — | 0.734 | 0.575-0.938 | .013 |
| Total AM‡ | ||||||
| Relapse | 0.848 | 0.696-1.033 | NS | 0.914 | 0.749-1.116 | NS |
| RFS | 0.998 | 0.849-1.175 | NS | 1.131 | 0.948-1.349 | .173 |
| Neutrophil engraftment | — | — | — | 0.896 | 0.786-1.022 | .101 |
| Platelet engraftment | — | — | — | 0.832 | 0.738-0.937 | .002 |
—, test not performed.
GVH (median, 3; range, 0-3); HVG (median, 3; range, 0-3).
GVH (median, 2; range, 0-2); HVG (median, 2; range, 0-2).
GVH (median, 4; range, 0-5); HVG (median, 4; range, 0-5).
To further study the relationship between class II EM in the GVH direction and the incidence of relapse, subgroup analyses were performed for disease type and disease status at transplant. For AML patients, class II EM in the GVH direction was significantly associated with a lower incidence of relapse (HR, 0.51; P = .045) (Figure 3A). After adjusting for potential confounders, this association remained significant (adjusted HR, 0.959 per ME; 95% CI, 0.926-0.994; P = .022) (Table 3). For AML patients with active disease at the time of transplant, class II EM in the GVH direction was significantly associated with a lower incidence of relapse (HR, 0.38; P = .037) (Figure 3D). However, this association did not remain significant after multivariate adjustment (adjusted HR, 0.970 per ME; 95% CI, 0.922-1.020; P = .232). For non-AML patients, class II EM in the GVH direction was not significantly associated with a lower incidence of relapse (HR, 0.36; P = .062).
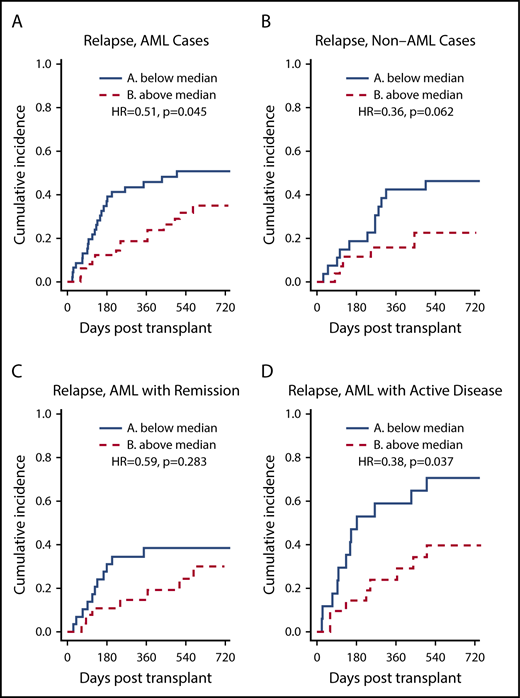
HLA class II EM in the GVH direction, stratified by the median, and relapse: subgroup analyses. (A-B) Greater class II EM in the GVH direction was associated with reduced incidence of relapse in AML patients but not in non-AML patients, and this association remained significant after multivariate analysis. (C-D) Greater class II EM in the GVH direction was associated with reduced incidence of relapse in AML patients with active disease, but this association did not remain significant after multivariate analysis.
HLA class II EM in the GVH direction, stratified by the median, and relapse: subgroup analyses. (A-B) Greater class II EM in the GVH direction was associated with reduced incidence of relapse in AML patients but not in non-AML patients, and this association remained significant after multivariate analysis. (C-D) Greater class II EM in the GVH direction was associated with reduced incidence of relapse in AML patients with active disease, but this association did not remain significant after multivariate analysis.
As with relapse, class II EM in the GVH direction was significantly associated with improved RFS (HR, 0.978 per ME; 95% CI, 0.957-0.999; P = .037) in the univariate analysis (Table 2; Figure 2B) and multivariate analysis (adjusted HR, 0.974 per ME; 95% CI, 0.952-0.996; P = .020) (Table 3). Additionally, DRB1 EM in the GVH direction was associated with significantly improved RFS (HR, 0.956 per ME; 95% CI, 0.920-0.994; P = .023), whereas the improvement in RFS with DQB1 EM in the GVH direction did not reach statistical significance (supplemental Table 2). Similar to incidence of relapse, class II EM in the HVG direction was not significantly associated with RFS. Although class I EM in the HVG direction was weakly associated with worsened RFS (HR, 1.035 per ME; 95% CI, 1.000-1.072; P = .049) (Table 2), this association did not remain significant after adjusting for confounders (adjusted HR, 1.031 per ME; 95% CI, 0.996-1.068; P = .087).
Class II AM in the GVH direction was not significantly associated with RFS (Table 4). Class I AM in the HVG direction was significantly associated with worse RFS (HR, 1.363 per MA; 95% CI, 1.056-1.760; P = .018) (Table 4), but this association did not remain significant after adjustment for confounders (adjusted HR, 1.234 per MA; 95% CI, 0.949-1.606; P = .117).
EM in the HVG direction was associated with delayed neutrophil and platelet engraftment
Total EM in the HVG, but not in the GVH, direction was significantly associated with delayed time to neutrophil and platelet engraftment (Table 2), and this association was largely driven by class II EM in the HVG direction (Figure 2C-D). After adjusting for potential confounders, class II EM in the HVG direction remained significantly associated with delayed time to neutrophil engraftment (adjusted HR, 0.974 per ME; 95% CI, 0.954-0.995; P = .013) and platelet engraftment (adjusted HR, 0.961 per ME; 95% CI, 0.938-0.983; P = .001) (Table 3). Evaluating the individual class II loci, DQB1 EM in the HVG direction was associated with delayed time to neutrophil (HR, 0.957 per ME; 95% CI, 0.926-0.989; P = .010) and platelet (HR, 0.953 per ME; 95% CI, 0.918-0.988; P = .009) engraftment, whereas DRB1 HVG EM was not. Among the 6 patients with graft failure, 4 were above the median of class II EM in the HVG direction. After excluding these 6 cases, class II EM in the HVG direction remained associated with delayed neutrophil (HR = 0.686; P = .027) and platelet engraftment (HR = 0.690; P = .046).
To further quantify the relationship between class II HVG EM and engraftment, we compared rates of engraftment at 30 days between patients with class II HVG EM below the median vs above the median. For neutrophil engraftment, 84.3% of patients (95% CI, 73.2%-91.1%) with class II HVG EM below the median had engrafted compared with 79.5% of patients (95% CI, 68.5%-87.0%) above the median. For platelet engraftment, 48.6% of patients (95% CI, 36.4%-59.7%) with class II HVG EM below the median had engrafted compared with 34.6% (95% CI, 24.2%-45.2%) of patients above the median.
Total AM in the HVG direction was also significantly associated with delayed time to platelet engraftment (Table 4), and this association was again largely driven by class II HVG AM. After adjusting for potential confounders, class II HVG AM remained significantly associated with delayed time to platelet engraftment (adjusted HR, 0.609 per MA; 95% CI, 0.474-0.781; P < .001) (Table 3). Total and class II HVG AM were not associated with neutrophil engraftment.
Six patients had graft failure and these numbers were too small to perform any meaningful statistical analysis.
EM was not significantly associated with OS, TRM, or GVHD outcomes
In the univariate analysis, EM was not associated with OS, TRM, aGVHD, or cGVHD (Table 2).
Discussion
In this study, we evaluated the association between HLA EM and clinical outcomes in patients receiving PTCy-based haplo-HCT. EM offered a potentially more accurate quantification of HLA disparity when compared with AM. Although EM correlated well with AM, significant overlap existed for the ranges of EM at each level of AM. Greater class II EM in the GVH direction was associated with reduced incidence of relapse and improved RFS without affecting GVHD outcomes, suggesting an enhanced GVL effect. DRB1 EM primarily accounted for this association between class II EM and reduced relapse and improved RFS. Furthermore, on subgroup analysis, class II EM in the GVH direction was associated with reduced relapse in AML patients. No association was seen with OS despite the association with relapse and RFS, potentially due to the relatively small sample size. Although greater class II EM in the GVH direction did not affect count recovery, greater class II EM in the HVG direction was associated with both delayed time to neutrophil and platelet engraftment, and DQB1 EM primarily accounted for this association.
Several studies have examined the relationship between HLA disparity and clinical outcome in haplo-HCT.18-22 These studies, however, differ with each other on the significance of HLA disparity in predicting outcomes. Similar to our study, Kasamon et al18 also found an association between class II GVH AM and both decreased relapse and improved RFS. Additionally, Solomon et al22 reported an association between greater total AM in the GVH direction and reduced relapse. HLA EM offers a potentially more accurate quantification of HLA disparity compared with AM (0-51 for combined EM in the GVH direction vs 1-5 for AM in our study). Although HLA EM correlates with HLA AM, significant overlap exists between the ranges of EM among different levels of AM in the total, class I, and class II categories. EM could potentially reconcile conflicting results in the HLA disparity literature by harmonizing the quantification of HLA disparity. EM may also allow more sensitive and coherent detection of the impact of HLA disparity on transplant outcomes. In support of this notion, we detected a significant, reciprocal effect of class II EM on relapse and RFS, as well as a consistent effect on neutrophil and platelet engraftment. AM, however, only detected an association between class II disparity and relapse and platelet engraftment but not RFS or neutrophil engraftment.
Our data support the hypothesis that greater class II EM in the GVH direction is associated with a greater GVL effect, leading to reduced relapse. Although the HLAMatchmaker software identifies epitopes capable of inducing an HLA-specific alloantibody response, Duquesnoy et al reported several examples of alloreactive T cells specific for HLA epitopes that can be structurally defined by the HLAMatchmaker software.39-43 In particular, Hiraiwa et al39 reported that allospecific T cells that can discriminate between HLA-B35 and HLA-Bw53, 2 antigens that differ by a set of public epitopes. Overall, the clinical and immunological significance of individual epitopes quantified by the HLAMatchmaker is not completely understood. Therefore, it remains possible that the load of EM is a surrogate or indirect biomarker for T-cell alloreactivity against leukemia in our patient population. Further studies are needed to test this hypothesis and determine the underlying mechanism.
The rationale for the association of class II but not class I or total EM with reduced relapse remains unclear. A 2003 study by Vollmer et al44 reported that AML blasts express significantly lower levels of HLA class I molecules compared with monocytes from healthy volunteers. In contrast, AML blasts expressed similar levels of HLA class II molecules when compared with healthy volunteer monocytes. Additionally, studies by Masuda et al45 and Brouwer et al46 report reduced HLA class I expression on leukemic cells. Larger, laboratory-based studies are needed to better understand the importance of HLA class II disparity and HLA expression on AML blasts.
In 2008, Duquesnoy et al47 found no association between HLAMatchmaker-defined triplet matching and clinical outcomes in a cohort of 744 patients receiving an unrelated allo-HCT with 1 HLA class I AM. Our study differs from this one in several aspects. The Duquesnoy et al47 study used the first generation of the HLAMatchmaker software, which only accounts for linear amino acid sequences as potential immunogenic epitopes. We have used the updated version of the HLAMatchmaker software, which accounts for discontinuous amino acid sequences in addition to linear amino acid sequences forming an epitope. Second, our study has examined both class I and II disparity and focused on a haplo-HCT patient population.
Consistent with previous work, we have found that class II EM in the HVG direction was independently associated with delayed platelet and also neutrophil engraftment.20 Greater HLA disparity in the HVG direction may lead to greater host alloreactivity against the graft, which will in turn cause poor graft function through direct cytotoxicity. These associations do not appear to impact OS possibly due to the modest effect size and robust supportive care available. Nevertheless, prolonged hospitalization and increased cost may be implicated.
Our study has several limitations. First, due to the retrospective nature of the study, some patients and donors had only intermediate-resolution HLA typing, necessitating the use of Haplostats to infer the high-resolution HLA typing.32 Additionally, our small sample size limited the power of this study and our ability to build a more comprehensive model for multivariate analysis. Our data set also lacked HLA-DP typing, preventing us from analyzing its relationship with patient outcomes. DBP1 mismatch has been associated with patient outcomes in the unrelated donor and haploidentical donor settings.22,28,48,49 Finally, many of our patients receiving a sibling donor haplo-HCT lacked HLA typing for their parents, preventing us from examining the role of noninherited maternal antigen (NIMA) mismatch. Future investigations of EM and haplo-HCT should investigate DP and NIMA mismatch to further our knowledge of their importance.
In summary, HLA EM represents a novel strategy to predict clinical outcome and improve donor selection in haplo-HCT. Increased HLA class II EM in the GVH direction may be beneficial in reducing relapsed disease in haplo-HCT patients without increased GVHD. Additionally, we found that greater HLA class II EM in the HVG direction is associated with longer time to engraftment. Our novel findings, if validated in larger prospective and/or registry-based studies, could help develop donor selection strategies aimed at enhancing GVL in patients undergoing haplo-HCT.
The full-text version of this article contains a data supplement.
Acknowledgments
This work was supported by the Siteman Cancer Center Biostatistics Shared Resource and National Institutes of Health (NIH), National Cancer Institute Cancer Center Support grant P30 CA091842 (Principal Investigator: Timothy Eberlein); NIH, National Center For Advancing Translational Sciences award number TL1TR002344; Washington University Hematology Scholars K12 award (K12-HL087107-07) from the NIH, National Heart, Lung, and Blood Institute (C.L.); and the Mentors in Medicine Program, Division of Medical Education, Department of Internal Medicine, Washington University School of Medicine.
Authorship
Contribution: J.R., C.L., and R.R. created and designed the study; J.R., M.S., J.F.D., P.W., C.L., and R.R. recruited patients and/or collected data; J.R., M.S., F.G., C.L., and R.R. all participated in data analysis, analyzed the data, and wrote the manuscript; and all authors interpreted the data, aided in the development of the study, and approved the final manuscript.
Conflict-of-interest disclosure: The authors declare no competing financial interests.
Correspondence: Chang Liu, Division of Laboratory and Genomic Medicine, Department of Pathology and Immunology, School of Medicine, Washington University in St. Louis, 660 South Euclid Ave, Campus Box 8118, St. Louis, MO 63110; e-mail: cliu32@wustl.edu; and Rizwan Romee, Division of Hematologic Malignancies and Transplantation, Dana-Farber Cancer Institute, Harvard Medical School, 450 Brookline Ave, Dana 2-058, Boston, MA 02215; e-mail: rizwan_romee@dfci.harvard.edu.

