

Key Points
CapTCR-seq permits TCR repertoire profiling at reduced cost using a single capture panel to target all TCR loci in a single reaction.
CapTCR-seq avoids PCR primer sites and multiplexed primer set bias while yielding similar TCR V/J gene usage profiles.

Abstract
Mature T-cell lymphomas consisting of an expanded clonal population of T cells that possess common rearrangements of the T-cell receptor (TCR) encoding genes can be identified and monitored using molecular methods of T-cell repertoire analysis. We have developed a hybrid-capture method that enriches DNA sequencing libraries for fragments encoding rearranged TCR genes from all 4 loci in a single reaction. We use this method to describe the TCR repertoires of 63 putative lymphoma clinical isolates, 7 peripheral blood mononuclear cell (PBMC) populations, and a collection of tumor infiltrating lymphocytes. Dominant Variable (V) and Joining (J) gene pair rearrangements in cancer cells were confirmed by polymerase chain reaction (PCR) amplification and Sanger sequencing; clonality assessment of clinical isolates using BIOMED-2 methods showed agreement for 73% and 77% of samples at the β and γ loci, respectively, whereas β locus V and J allele prevalence in PBMCs were well correlated with results from commercial PCR-based DNA sequencing assays (r2 = 0.94 with Adaptive ImmunoSEQ, 0.77-0.83 with Invivoscribe LymphoTrack TRB Assay). CapTCR-seq allows for rapid, high-throughput and flexible characterization of dominant clones within TCR repertoire that will facilitate quantitative analysis of patient samples and enhance sensitivity of tumor surveillance over time.
Introduction
Mature T-cell lymphomas can be identified by the presence of a clonal population of T cells possessing common T-cell receptor (TCR) rearrangement(s). The heterodimeric TCR protein includes the variable α and β, or γ and δ chains, which are generated by VDJ recombinase mediated recombination of the variable (V), joining (J), and diversity (D) gene segments at the TCR genomic loci.1 The total diversity of a T-cell population is then determined by the structure of the complementarity determining regions (CDRs) of the rearranged and paired α/β or γ/δ chains that interact with the peptide presented in the major histocompatibility complex.2 Individual T cells contribute to immunologic processes through interactions between the TCR, peptide/major histocompatibility complex, and other costimulatory molecules.3 T-cell–mediated responses associated with a particular peptide can be detected and monitored by sequencing of the TCR encoding genomic loci derived from a patient sample followed by TCR profiling.4,5
Current TCR rearrangement profiling assays rely on targeted polymerase chain reaction (PCR) amplification of rearranged TCR genomic loci. The simplest method for assessing clonality of a T-cell population employs multiplexed amplification of the TCR α, β, γ, or δ loci using standardized primer sets and qualitative interpretation of fragment size distributions by capillary electrophoresis according to the BIOMED-2 protocol.6,7 Next-generation sequencing provides a quantitative readout of V(D)J gene usage and CDR3 sequence-level resolution, assessment of the TCR repertoire, including detection of low-abundance rearrangements from bulk immune cells, or even pairing of the heterodimeric chain sequences with single-cell preparation methods.8,9 Hybrid-capture–based library enrichment is an alternative method to PCR-based amplification that can improve coverage uniformity and library complexity when the sample is not limiting and allows for targeted enrichment of genetic loci of interest from individual genes to entire exomes.10
In hybrid-capture methods, the formation of probe-library fragment DNA duplexes are used to recover regions of interest.11-13 A hybrid-capture–based TCR repertoire profiling assay offers several advantages: all 4 loci, representing only 0.07% of the genome, can be interrogated in a single, inexpensive reaction, unhindered by PCR primer multiplexing; greater flexibility in target lengths and the use of fragmented DNA due to the absence of primer-based amplification; capture of regions potentially subject to somatic mutation as is frequent in cancer; and capture of targets that have undergone structural rearrangements where 1 or both ends are unknown, including rearrangements involved in normal T-cell rearrangement, as well as abnormal rearrangement in the context of disease. As a proof of concept, we present here a laboratory and bioinformatic workflow for targeted hybrid-capture enrichment of TCR loci followed by Illumina sequencing to assess the TCR repertoire of a range of specimens with variable T-cell clonal complexity as well as a set of 63 T-cell isolates referred for clinical testing at our institution.
Materials and methods
Probe design
All annotated V, D, J gene segments were retrieved from the International ImMunoGeneTics Information System/Laboratoire d'ImmunoGénétique Moléculaire database (IMGT/LIGM-DB) Web site (www.imgt.org14 ). The 100 bp of annotated 3′ V gene coding regions and up to 100 bp, when available, of annotated 5′ J gene coding regions were selected as baits. Probes with duplicate sequences were not included. The target capture panel consisted of 598 IDT xGen Lockdown probes (supplemental Table 1) targeting the 3′ and 5′ 100 bp of all TCR V gene regions, and 95 probes targeting the 5′ 100 bp of all TCR J gene regions as annotated by IMGT.
Cells
Peripheral blood mononuclear cells (PBMCs) were isolated by Ficoll-Hypaque density centrifugation. CD3+ T cells were isolated from PBMCs by flow sorting. The M36_EZM sample was obtained after enzymatic dissociation of a melanoma tumor specimen using collagenase and DNase. Following tissue dissociation, the cell suspension was washed thoroughly. The M36_TIL2 and OV7_TIL2 samples were generated by expanding tumor-infiltrating lymphocytes (TILs) using interleukin-2.15 The L2D8 cells were derived from TILs and recognize a gp100 peptide (amino acids 209-217) presented by HLA-A*0201 (kind gift from Steven Rosenberg). The STIM1-CY3 sample is a primary T-cell line that was generated by repetitive stimulation of healthy donor PBMC with Melan-A/MART-1 peptide-pulsed HLA-A*0201-positive dendritic cells (amino acids 26-35 [27L substitution]), followed by flow sorting using HLA-A*0201/MART-1 27L multimers and subsequent expansion using a rapid expansion protocol.15 STIM1-CY3 cells were confirmed to recognize HLA-A*0201/MART-1 after the rapid expansion. All T-cell samples were cryopreserved and then thawed and washed before DNA isolation. Donor PBMCs were obtained under the University Health Network Research Ethics Board (UHN REB) protocol 05-0956. The melanoma tumor specimen was obtained under UHN REB 05-0495. The ovarian cancer specimen was obtained under UHN REB 10-0335. Formalin-fixed paraffin-embedded (FFPE) clinical specimens were obtained from the UHN Biospecimen Sciences Program.
DNA isolation
DNA was isolated from cells with a Gentra Puregene kit (Qiagen) or a Qiagen Allprep (Qiagen) kit, according to the manufacturer’s instructions. For FFPE samples, a previously optimized in-house approach was used. First, sample FFPE tissue blocks were cored with a sterilized Tissue-Tek Quick-Ray punch (Sakura) in a preselected area of representative tissue; alternatively, under sterile conditions, 10 × 10 μm DNA curls per unstained slides were obtained for each submitted block of FFPE tissue. In a fume hood, 400 to 1000 μL xylene was aliquoted into each tube (volume increased for larger FFPE fragments), followed by vigorous vortexing for 10 seconds, incubation in a 65°C water bath for 5 minutes, and centrifugation at 13 200 rpm for 2 minutes. The supernatant was then discarded, and an additional xylene treatment step was performed. Subsequently, addition of 400 to 1000 μL ethanol (volume adjusted for larger input tissue volumes) was performed, followed by vigorous vortexing for 10 seconds, and centrifugation at 13 200 rpm for 2 minutes. The supernatant was then discarded, and the ethanol treatment step repeated. The resulting pellet was then dried using a SpeedVac (Thermo Scientific) for 5 minutes, after which 150 μL of QIAamp buffer ATL (Qiagen) was added, followed by 48-hour incubation at 65°C with 50 to 150 μL of proteinase K (volume increased for higher-input volumes). A final ethanol cleanup step was performed, as above, to produce a purified DNA product. Resuspension in Tris and EDTA buffer (Qiagen) was then performed.
Hybrid capture
Genomic DNA was diluted in Tris and EDTA buffer and sheared into fragments using either a Covaris Focused-ultrasonicator, model M220 (50 μL volume, 150-bp target insert size for preliminary PBMC and TIL experiments) or E220 (130 μL volume, 250-bp insert size for clinical isolates and further experiments). Peak incident power was set to 175 W; duty factor was set to 10%, and cycles per burst were set to 200. Treatment time was set to 180 seconds. In addition, temperature and water levels were carefully held to manufacturer’s recommendations. Illumina DNA libraries were generated from 100 to 1550 ng of fragmented DNA (100 ng for all clinical isolates) using the KAPA HyperPrep Kit (Sigma) library preparation kit following the manufacturer’s protocol 1.14 and 5.16, employing 4 cycles of PCR after ligation of Illumina Tru-Seq (PBMC and TIL experiments) or BIOO Scientific NEXTFlex (clinical isolates) sequencing library adapters. Library fragment size distribution was determined using the Agilent TapeStation D1000 kit and quantified by fluorometry using the Invitrogen Qubit. Hybridization with probes specifically targeting V and J loci was performed following the Roche SeqCap (Roche) conditions with xGen blocking oligos (IDT) and human Cot-1 blocking DNA (Invitrogen). Hybridization was performed at 65°C overnight. After hybridization, libraries were amplified using 10 to 14 cycles of PCR, purified, and sequenced using an Illumina NextSeq 500 instrument.
Capture analysis
A custom Bash/Python/R pipeline was employed for analysis of paired read sequencing data from the hybrid-capture products. First, 150 bp of paired reads were merged using PEAR 0.9.6 with a 25-bp overlap parameter.16 This results in a single sequence for each sequenced fragment. Next, specific V, J, and D genes within the fragment sequence were identified by aligning regions against a reference sequence database. Specifically, individual BLAST databases were created using all annotated V, D, J gene segments retrieved from the IMGT/LIGM-DB Web site (www.imgt.org14 ), as these full-length gene sequences were the source of probes used to design the hybrid-capture probe panel. Individual merged reads are iteratively aligned using BLASTn with an e value cutoff of 1 to the V database, J database, and then D database with word size of 5 for D segment queries.17 Trimming of identified V or J segments in the query sequence is performed prior to subsequent alignment. From reads containing V and J sequences, we identified V/J junction position and the antigen specificity determining CDR3 sequences. In order to identify CDR3 sequences, the V/J junction position is extracted from the previous search data for those fragments containing both a V and J search result. Eighty base-pairs of DNA sequence flanking this junction are translated to amino acid sequence in all 6 open reading frames, and sequences lacking stop codons are searched for invariable anchor residues using regular expressions specific for each TCR class as determined by sequence alignments of polyclonal hybrid-captured data from rearranged TCR polypeptides annotated by IMGT.14 Alternatively, the software package MiXCR (version 2.1.1) was run using default settings for RepSeq-enriched libraries where indicated in combination with the R package tcR.18,19
PCR validation and Sanger sequencing
PCR validation was performed for rearrangements occurring in any of the A037, L2D8, cell line, or TIL samples at >10% of total rearrangements (supplemental Table 2). V and J genes were identified for these rearrangements, and the PCR forward primer was set in the V gene and the reverse primer set in the antisense strand of the J gene. Primers were selected from the IMGT primer database, or the anticipated rearrangement sequence was used to derive custom primers (IDT) using the NCBI Primer-Blast tool (supplemental Table 3). PCR was performed in a 384-well plate on an Applied Biosystems Veriti thermal cycler using the Thermo Scientific 2× ReddyMix PCR Master Mix kit according to the manufacturer’s instructions. PCR products were purified using a QIAquick Spin PCR purification kit. Purified PCR products were then quantified by Qubit, and 20 ng was used for single-direction Sanger Sequencing employing the amplification primer with the lowest melting point.
PCR-based ImmunoSEQ, LymphoTrack, and BIOMED-2 assays
For comparison with CapTCR-seq data, we employed 3 commercial, PCR-based assays: ImmunoSEQ (Adaptive BioSciences), LymphoTrack (Invivoscribe), and BIOMED-2 (Euroclonality). For ImmunoSEQ, 6 μg of genomic DNA isolated from PBMC (A037) or 2 μg of genomic DNA isolated from CD3+ sorted T cells (A037 and L2D8) were sent for “Deep TCRB Profiling,” with all analysis performed by the vendor platform. For LymphoTrack profiling, we used the LymphoTrack TRB Assay Panel–MiSeq (Invivoscribe) product using 100 ng of template material. To compare CapTCR-Seq with LymphoTrack, sequencing data were analyzed using MiXCR, and CDR3 overlap as well as V and J gene usage was determined using the tcR package for the R environment.18,19 BIOMED-2 analysis was performed by the UHN Laboratory Medicine and Pathobiology program according to established methods and guidelines.6,7
Results
The CapTCR-seq method employs hybrid capture biotinylated probe sets designed based on all unique V gene and J gene annotations retrieved from the IMGT database, version 1.1, LIGMDB_V12.14 These probe sets target the 3′ regions of V gene coding regions and the 5′ regions of J gene coding regions, adjacent in α and γ T-cell loci, and flanking the D gene fragment in β and δ T-cell loci that together form the antigen specificity conferring CDR3 (Figure 1A). In designing the probe set, diversity regions were not included due to short lengths and high-potential junctional diversity introduced by the recombination process and to permit a single universal probe set for all 4 T-cell loci. These biotinylated probes were hybridized with fragmented DNA sequencing libraries, and probe-target hybrid duplexes were subsequently recovered by way of streptavidin-linked magnetic beads. For targeting fragment size by ultrasonication, we selected a 250-bp fragment size as a balance between the maximum length of a fragment’s merged reads from 150-bp paired-end read sequencing with a 25-bp overlap (275 bp) and a lower limit of 182 bp based on alignments of simulated reads centered at the VJ junction with variable insert sizes that had successful V and J alignment sensitivity of >99%. The enriched libraries were PCR amplified from the bead-purified hybrid-duplex population using a single set of adapter-specific amplification primers, and the resulting libraries were subjected to paired read 150-bp sequencing on an Illumina NextSeq 500 instrument.

An overview of the CapTCR-Seq hybrid-capture method. (A) Hybrid-capture method experimental flow diagram. Fragments are colored based on whether they contain V-region targets (blue), J-region targets (red), D-regions (green), constant regions (yellow), or non-TCR coding regions (black). (B) V(D)J rearrangement and CDR3 sequence detection algorithm flow diagram. (C) Number of unique VJ pairs recovered relative to library DNA input amount for V probe panel capture of replicate libraries from a single PBMC sample (A037). (D) A037 polyclonal human β locus VJ rearrangements determined by CapTCR-seq. (E) A037 polyclonal human β locus VJ rearrangements determined by a PCR-based profiling service. (F) Subtractive comparison between CapTCR-seq and PCR-based profiling service. Red indicates relative enrichment of indicated pair by CapTCR-seq, whereas blue indicates relative enrichment of indicated pair by PCR-based profiling.
An overview of the CapTCR-Seq hybrid-capture method. (A) Hybrid-capture method experimental flow diagram. Fragments are colored based on whether they contain V-region targets (blue), J-region targets (red), D-regions (green), constant regions (yellow), or non-TCR coding regions (black). (B) V(D)J rearrangement and CDR3 sequence detection algorithm flow diagram. (C) Number of unique VJ pairs recovered relative to library DNA input amount for V probe panel capture of replicate libraries from a single PBMC sample (A037). (D) A037 polyclonal human β locus VJ rearrangements determined by CapTCR-seq. (E) A037 polyclonal human β locus VJ rearrangements determined by a PCR-based profiling service. (F) Subtractive comparison between CapTCR-seq and PCR-based profiling service. Red indicates relative enrichment of indicated pair by CapTCR-seq, whereas blue indicates relative enrichment of indicated pair by PCR-based profiling.
To identify V(D)J rearrangements from the pool of captured V and J sequences, we used a computational method that performed: (1) read merging to collapse paired reads in to a single long-read sequence to enhance V(D)J and CDR3 identification, (2) progressive BLASTn-based V, J, and D detection utilizing iterative end trimming, and (3) CDR3 scoring using regular expression pattern matching (Figure 1B).
To establish the clonal diversity measurable by this method, we employed this method to identify V(D)J rearrangements and CDR3 sequences in PBMCs isolated from a healthy human (sample A037). With a single-step hybridization and capture reaction employing the probe panel targeting TCR V genes, we observed a general trend that the number of detected unique VJ rearrangements increased with increasing amount of A037 genomic DNA used to generate the initial library, with up to 52 times more rearrangements detected with an input of 1000 ng compared with 100 ng (1925 vs 37) (Figure 1C). The number of unique VJ rearrangements was dependent on the number of T cells in the original sample with an approximate fourfold increase for CD3+ sorted cells over PBMCs (2475 vs 759) (supplemental Table 4). The single-step capture using a pooled V and J panel demonstrated fivefold greater recovery of unique CDR3 sequences per 1 ng of library input (single-step V capture mean: 1.7, single-step VJ capture mean: 8.56) (supplemental Table 4). This configuration also increased the ratio of on-target reads, effectively decreasing the amount of sequencing needed to obtain the same number of rearranged fragments (single-step V capture mean: 14.4%, single-step VJ capture mean: 42.9%). Overall, we saw a diverse representation of alleles for all 4 loci with 2895 α, 1100 β, 59 γ, and 9 δ unique VJ rearrangements observed when the calls were combined from 16 independent captures of independently generated libraries (supplemental Figure 1A-D). This corresponded to 6257 α, 4950 β, 1802 γ, and 109 δ unique CDR3 sequences. We also submitted a portion of these samples for parallel characterization by a commercial PCR-based TCR profiling service (Adaptive ImmunoSEQ) and found similar V/J gene usage and representation with no more than 2% variation between samples for any V or J gene (Figure 1D-F) and correlation with an r2 value of 0.94 (supplemental Figure 1E). In order to assess captured library complexity, we down-sampled the sequencing data by half, 13 times (using seqtk), and for each level we calculated the number of reads and the number of unique clonotypes using MiXCR19 (supplemental Figure 1F). The number of unique clonotypes recovered appeared to begin to saturate between 1 × 10⁶ and 1 × 10⁷ reads with libraries generated using greater amounts of sample material saturating at a higher number of reads.
To further validate the CapTCR-Seq method, we employed the LymphoTrack PCR-based TRB assay for assessment of TCR rearrangements at the β locus for the A037 PBMC sample (supplemental Table 5) along with 6 additional PBMC samples from individuals without cancer (H128, H129, H130, H131, H132, H133; supplemental Table 6). The fractional representation of each V/J gene pair determined by each method was in overall agreement for the A037 sample (r2= 0.77), and the 6 additional PBMC samples (r2 = 0.82, 0.78, 0.79, 0.78, 0.81, 0.83; supplemental Figure 2). Through this analysis, we observed a subset of CDR3 sequences that were present in nearly every PBMC CapTCR-seq that we suspect are the result of mapping artifacts or structural polymorphisms. Expanding this analysis to all 104 CapTCR-seq libraries in our study (18 A037 libraries, 12 additional PBMC libraries, 63 clinical isolate libraries, 5 cell-line libraries, 4 TIL population libraries, and 2 clonality control libraries), we found 131 such clones present in >30 libraries (average 117 per sample) yet rarely observed in the LymphoTrack data sets (average 3 per sample). We therefore curated these 131 clones as a set of recurrent artifacts and removed these from downstream analyses (supplemental Table 7). The largest difference in TRB V gene prevalence between the samples was for the pseudogene TRBV21-1, which was observed 150-fold less often by LymphoTrack, whereas the TRBV4 and TRBV11 genes were observed with four- and fivefold increased fractional prevalence. These differences were not observed in the Adaptive ImmunoSEQ comparison, suggesting that these differences might be due to differences in the primer sets.
When the LymphoTrack A037 data set was compared against a merged data set of 17 A037 CapTCR runs, 99 of the top 100 prevalent V/J rearrangements in the CapTCR-seq data set were present in the LymphoTrack data set, and 100 of the top 100 prevalent V/J rearrangements in the LympoTrack data set were observed in the CapTCR-seq data set (supplemental Table 8). When a single A037 replicate data set was compared with the LymphoTrack data set, these values were 98 and 81, respectively (supplemental Table 9). These data show that there was no dropout of prevalent functional rearrangements by either method.
To test the ability of CapTCR-seq to profile TCR rearrangement repertoires of samples with a range of population T-cell complexity, we analyzed libraries derived from various T-cell populations (TIL cultures, TIL analyzed directly ex vivo, a TIL-derived population, and an antigen-specific T-cell line), and lymphoblast cell lines (Figure 2A-B; supplemental Figure 3A-B). As expected, the lymphoblast cell lines and antigen-specific samples had fewer prevalent unique rearrangements (12-22 unique VJ rearrangements) than the TIL populations (123-446 unique VJ rearrangements). The predominant α rearrangement represented 40% to 80% of the recovered rearrangements in the cell lines compared with 2.5% to 17.5% for the latter TIL populations. Specifically, we detected 12 unique VJ rearrangements in L2D8, a gp100 antigen-specific TIL population. In OV7_TIL2, an ovarian TIL population expanded in vitro with the T-cell growth factor interleukin-2, we found 311 unique VJ rearrangements. We profiled 2 populations isolated from the same tumor: M36_EZM, a suspension of unsorted cells prepared by enzymatic dissociation of a melanoma tumor specimen with brisk CD3 infiltration harbored 123 unique VJ rearrangements, while M36_TIL2, TILs from the same tumor specimen expanded in IL-2 harbored 446 unique VJ rearrangements, possibly reflecting expansion of low-prevalence T cells and capture of fewer unrearranged locus fragments due to a higher proportion of T cells. STIM1-CY3 is a Melan-A/MART-1 antigen-specific cell line made by Melan-A/MART-1 peptide stimulation of healthy donor PBMCs, fluorescence-activated cell sorting, and expansion of HLA-A*0201/MART-1 multimer-binding cells from which we found 195 unique VJ rearrangements. The lymphoblastoid cell lines were found to encode previously reported gene rearrangements at the TCR β and γ loci, and additional rearrangements not previously reported (supplemental Table 10).20 Targeted PCR amplification of V/J rearrangement pairs, including the most frequently observed for each sample, was performed on these cell populations. We observed expected product for all prevalent rearrangements with some amplification failures for low-prevalence rearrangements (sample: observed bands/expected bands; A037: 9/11; L2D8: 4/5; M36_EZM: 3/4; M36_TIL2: 8/9; OV7_TIL2: 5/9; STIM1-CY3: 7/9; CEM: 4/4; Jurkat: 3/4; MOLT4: 4/4; SUPT1: 4/4) (supplemental Figure 3C). We also submitted the gp100 antigen-specific L2D8 sample for β locus profiling by a PCR-based commercial service (Adaptive ImmunoSEQ) and found VJ repertoire usage to be highly congruent (Figure 2C-E). However, the commercial service also identified extensive low-level VJ gene usage not present in the capture data (Figure 2D) that may represent low-level representation of alternative VJ pair antigen-specific cells, or sample contamination with non-antigen-specific cells such as feeder cells.

T-cell clonality across 5 cell lines and 4 primary T-cell specimens. Boxes represent individual unique VJ pairs, and box size reflects abundance in sample. Samples ordered by decreasing clonality. (A) β chain VJ rearrangements. (B) γ chain VJ rearrangements. (C) L2D8 gp100 antigen-specific β locus VJ rearrangements determined by CapTCR-seq. (D) L2D8 gp100 antigen-specific β locus VJ rearrangements determined by a PCR-based profiling service. (E) Subtractive comparison between CapTCR-seq and PCR-based profiling service. Red indicates relative enrichment of indicated pair by CapTCR-seq, whereas blue indicates relative enrichment of indicated pair by PCR-based profiling.
T-cell clonality across 5 cell lines and 4 primary T-cell specimens. Boxes represent individual unique VJ pairs, and box size reflects abundance in sample. Samples ordered by decreasing clonality. (A) β chain VJ rearrangements. (B) γ chain VJ rearrangements. (C) L2D8 gp100 antigen-specific β locus VJ rearrangements determined by CapTCR-seq. (D) L2D8 gp100 antigen-specific β locus VJ rearrangements determined by a PCR-based profiling service. (E) Subtractive comparison between CapTCR-seq and PCR-based profiling service. Red indicates relative enrichment of indicated pair by CapTCR-seq, whereas blue indicates relative enrichment of indicated pair by PCR-based profiling.
To demonstrate the potential clinical utility of our approach, we generated CapTCR-seq libraries from an unselected cohort of 63 formalin-fixed, paraffin-embedded samples submitted for clinical TCR clonality testing. All libraries were sequenced with at least 1 million reads (range: 2.6e6-8.3e6). Samples had varying degrees of expansion of unique TCR locus rearrangements, with the predominant rearrangement representing up to 40% of the least complex sample (average 12.2%; median 6.3%, range 0.8%-100%; Figure 3; supplemental Figure 4A-B).
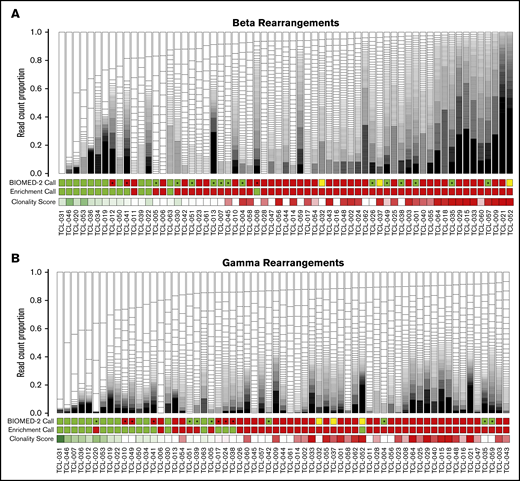
T-cell clonality across 63 samples referred for clinical TCR clonality testing. Boxes represent individual unique VJ rearrangements, and box size reflects abundance in sample. BIOMED-2 clonality assessments are indicated as green (clonal), red (polyclonal), or yellow (not performed). CapTCR-seq binary clonality calls are indicated as green (enriched for a single rearrangement) or red (nonenriched). CapTCR-seq continuous Clonality Scores (supplemental Table 11) are indicated as a gradient from dark green (1) to dark red (0) through white (median), where larger values indicate greater fractional prevalence. Samples are ordered left to right in terms of increasing CapTCR-Seq clonality with an asterisk indicating disagreement between CapTCR-Seq and BIOMED-2 assessments. (A) β chain VJ rearrangements. (B) γ chain VJ rearrangements. Note that samples occur in different orders between the 2 panels to facilitate comparison of CapTCR-seq and BIOMED-2, resulting in the 2 independent loci.
T-cell clonality across 63 samples referred for clinical TCR clonality testing. Boxes represent individual unique VJ rearrangements, and box size reflects abundance in sample. BIOMED-2 clonality assessments are indicated as green (clonal), red (polyclonal), or yellow (not performed). CapTCR-seq binary clonality calls are indicated as green (enriched for a single rearrangement) or red (nonenriched). CapTCR-seq continuous Clonality Scores (supplemental Table 11) are indicated as a gradient from dark green (1) to dark red (0) through white (median), where larger values indicate greater fractional prevalence. Samples are ordered left to right in terms of increasing CapTCR-Seq clonality with an asterisk indicating disagreement between CapTCR-Seq and BIOMED-2 assessments. (A) β chain VJ rearrangements. (B) γ chain VJ rearrangements. Note that samples occur in different orders between the 2 panels to facilitate comparison of CapTCR-seq and BIOMED-2, resulting in the 2 independent loci.
For comparison of repertoire complexity across samples, we defined an “enriched population” as having dominant rearrangements observed at 2 or more times the level of the next most abundant rearrangement. There was 73% agreement at the β locus: 33 in agreement as nonenriched and 11 in agreement as enriched (median VJ rearrangement counts of 101 and 68). In order to further quantify these differences, we calculated a “Clonality Score” defined as the largest difference in fractional prevalence between any 2 subsequent clones (supplemental Table 11). When using these scores, we found that samples scored as clonal by both methods had high average clonality scores and top clone proportions (β: 0.41, 0.49; γ: 0.33, 0.40), and those scored as polyclonal by both methods had low average clonality scores and top clone proportions (β: 0.02, 0.06; γ: 0.01, 0.04). When the methods disagreed, it was for samples with values in the intermediate range (β: 0.06-0.14; 0.12-0.19; γ: 0.04-0.04, 0.08-0.1). Overall, this illustrates the need for continuous scoring of immune repertoire as an alternative to binary scoring methods.
Discussion
The CapTCR-Seq method can assess the TCR repertoire of samples from DNA libraries derived from fresh tissue or from archival sources with high-sensitivity scaling to template input amounts and sequencing depth. We have demonstrated high concordance with commercial PCR-based offerings as well as broad applicability across a diversity of clinically derived specimens. CapTCR-Seq is cost effective and offers flexibility of sensitivity by scaling the amount of input library and, consequently, the number of capture reactions. A strength of the method is its ability to profile existing libraries that have been used for other sequencing applications where initial samples might no longer be available. In addition, the method can be used downstream of any biological methods that generate a DNA molecular library for subsequent TCR-specific library enrichment. This enrichment step is key to overcoming low relative T-cell representation in bulk sequencing libraries, and the high amount of diversity in an individual T-cell repertoire.21
We applied the CapTCR-Seq method to 63 clinical samples that were referred for testing as possible T-cell lymphomas using a BIOMED-2 capillary electrophoresis protocol. We found 73% and 77% agreement in detection of a single expanded rearrangement at the β and γ loci, respectively. We observed concordance in clonality status between the employed methods when the calculated clonality score for the samples was either high or low, with disagreement in classification for intermediate values. This may be due to the limited resolution of the nonquantitative BIOMED-2 protocol and might be improved through the use of higher-resolution amplicon separation and additional analyses.7 We would argue that sequencing-based methods provide a more reliable assessment of clonality based on quantitative assessment and permit sequence-level comparisons between all rearrangements, an advantage of CapTCR-seq over the BIOMED-2 fragment sizing assay.
To assess fidelity of repertoire from highly polyclonal samples, we profiled the TCR repertoires of 7 polyclonal PBMC samples from lymphoma-free individuals using both CapTCR-seq and PCR-based approaches. Of note, we detected all functional V and J genes in different combinations by both PCR and capture-based methods, and fractional prevalence was overall concordant. However, CapTCR-Seq identified over a hundred recurrent clones across multiple samples rarely observed in the LymphoTrack PCR data, suggesting that they may be orphan genes encoded outside of the TCR loci. Differences in observed fractional prevalence of V and J gene rearrangements may be due to differences in read lengths, the extensively polyclonal nature of the samples leading to bottlenecking during library construction, limited read depth, and the limited number of fragments recovered by capture compared with PCR. The TCR β V gene with the greatest discordance between the methods was the pseudogene TRBV21-1, which was rarely seen in the LymphoTrack data and likely not included as a target. Interestingly, TRBV4 and TRBV11 loci were more frequently observed by LymphoTrack but not ImmunoSEQ. Overlap in observed V/J gene rearrangements between the methods was improved in a merged data set of all A037 CapTCR-seq data sets compared with a single sample, suggesting that improved depth of sequencing and improved fragment capture would yield better concordance between the methods. Overall, this points to a need for a gold-standard reference to guide development of immune repertoire assays and open sharing of frequent artifacts or structural polymorphisms inherent to these technologies. Naturally, we are focusing on improving these aspects in subsequent iterations of the CapTCR-seq method to continue to improve the ability to profile low-prevalence clones in polyclonal patient samples through multistep capture, replicate capture of high-input libraries, incorporation of molecular barcoding, and improved bioinformatic techniques.
We employed a BLAST-based sequence alignment approach for its tolerance to nucleotide mismatches that could arise from junctional diversity or the presence of allelic variants not present in the reference database. We acknowledge that numerous alternative V(D)J and CDR3 calling algorithms are available,19,22-26 and these may be used in addition to or in lieu of our pipeline to analyze V(D)J fragments captured by our laboratory approach. A head-to-head comparison of these methods is beyond the scope of this proof-of-principle report; however, processing the data with MiXCR yielded identical dominant rearrangements, and observed rearrangement prevalence was highly correlated with data obtained from the ImmunoSEQ and LymphoTrack platform for polyclonal PBMC human samples.
A major advantage of CapTCR-Seq is the simultaneous single-reaction profiling of all 4 TCR loci, as there has been an increase in interest in the role of T cells of the γ/δ lineage in immunologic processes.27,28 The CapTCR-Seq method includes probes for all 4 loci, and therefore, coincidental data are collected on γ/δ lineage TCR rearrangements as well as the more prevalent α/β class. This is in contrast to many of the existing amplification-based methods that require separate, multiplexed reactions for each locus.6,7 It should be noted, however, that CapTCR-Seq is subject to an imbalance in observed counts of γ (higher than expected relative to δ) and δ (lower than expected relative to γ) locus rearrangements. This imbalance is likely the result of the low prevalence of γ/δ T cells combined with the excision of the δ locus upon α locus rearrangement. Thus, mature α/β lymphocytes may encode γ locus rearrangement(s), yet, by virtue of rearranged α loci, lack an interrogable δ locus; the result will therefore suggest a systematic overrepresentation of γ rearrangements relative to δ rearrangements.
In summary, CapTCR-Seq allows for rapid, inexpensive, quantitative profiling of all 4 loci from next-generation sequencing libraries. Although we have primarily demonstrated use of CapTCR-Seq for clonality assessment in patients with suspected T-cell malignancies, we also show proof of principle for profiling repertoire of peripheral blood cells and tumor infiltrating lymphocytes. The modular nature of hybrid capture enables a combination of our panel with additional baits against somatic mutations to enable simultaneous measurement of tumor and immune systems. In view of modern cancer treatment regimens, we foresee this technique may have broader applicability for on-going monitoring of patients undergoing immune checkpoint blockade, adoptive cell transfer, or other immunotherapies.
Acknowledgments
The authors thank the staff of the Princess Margaret Genomics Centre (Neil Winegarden, Julissa Tsao, and Nick Khuu) and Bioinformatics Services (Carl Virtanen and Zhibin Lu) for their expertise in generating the sequencing data used in this study. They also thank A. Elford, M. Fyrsta, J. Nie, and P. Yen for technical assistance.
This work was funded by grants from the Princess Margaret Cancer Foundation; Canada Research Chairs program; Canada Foundation for Innovation, Leaders Opportunity Fund, CFI #32383; and the Ontario Ministry of Research and Innovation, Ontario Research Fund Small Infrastructure Program (T.J.P.) and was supported by a CIHR Fellowship (D.T.M.), and by a Terry Fox Foundation–CIHR Strategic Health Research Training Fellowship (E.R.M.).
Authorship
Contribution: D.T.M., E.R.M., M.D., and T.J.P. designed research and analyzed and interpreted data; M.D. developed the laboratory methods and protocol used for hybrid capture; E.R.M., D.T.M., M.D., T.L., and Y.H. performed research and collected data; L.T.N., M.O.B., N.H., J.D., and P.S.O. designed research and contributed vital reagents; and D.T.M., E.R.M., and T.J.P. drafted the manuscript.
Conflict-of-interest disclosure: The described method is the subject of a provisional patent filing: T.J.P., D.T.M., E.R.M., and M.D. “Hybrid-capture sequencing for determining immune cell clonality.” Patent Application No. PCT/CA2017/000084. The remaining authors declare no competing financial interests.
Correspondence: Trevor J. Pugh, MaRS Centre, 101 College St, Princess Margaret Cancer Research Tower, Room 9-305, Toronto, ON M5G 1L7, Canada; e-mail: trevor.pugh@utoronto.ca.

