

Key Points
The noncanonical IkB kinase IKBKE is commonly upregulated in AML and promotes MYC expression through phosphorylation of YB-1.
Targeting IKBKE genetically or through drugs such as momelotinib provides a therapeutic benefit in models of AML.

Abstract
To identify novel therapeutic targets in acute myeloid leukemia (AML), we examined kinase expression patterns in primary AML samples. We found that the serine/threonine kinase IKBKE, a noncanonical IkB kinase, is expressed at higher levels in myeloid leukemia cells compared with normal hematopoietic cells. Inhibiting IKBKE, or its close homolog TANK-binding kinase 1 (TBK1), by either short hairpin RNA knockdown or pharmacological compounds, induces apoptosis and reduces the viability of AML cells. Using gene expression profiling and gene set enrichment analysis, we found that IKBKE/TBK1-sensitive AML cells typically possess an MYC oncogenic signature. Consistent with this finding, the MYC oncoprotein was significantly downregulated upon IKBKE/TBK1 inhibition. Using proteomic analysis, we found that the oncogenic gene regulator YB-1 was activated by IKBKE/TBK1 through phosphorylation, and that YB-1 binds to the MYC promoter to enhance MYC gene transcription. Momelotinib (CYT387), a pharmacological inhibitor of IKBKE/TBK1, inhibits MYC expression, reduces viability and clonogenicity of primary AML cells, and demonstrates efficacy in a murine model of AML. Together, these data identify IKBKE/TBK1 as a promising therapeutic target in AML.
Introduction
Despite advances in our molecular understanding of the pathogenesis of acute myeloid leukemia (AML), the core of standard therapy for this disease remains nonspecific cytotoxic chemotherapy. Consequently, treatment is associated with high morbidity, and >10 000 patients die of AML each year in the United States. Identifying novel therapeutic targets and developing corresponding molecular therapies is an urgent need for the treatment of this disease.
ΙκΒ kinase ε (IKBKE) and its close homolog TBK1 (TANK-binding kinase 1) belong to the noncanonical IκB kinase family and participate in the regulation of the immune response.1 These 2 enzymes functionally compensate each other. However, although TBK1 is ubiquitously expressed, expression of IKBKE is restricted to particular tissue compartments, with the highest levels detected in lymphoid tissue and the pancreas.2 Recently, a role for IKBKE/TBK1 in tumor pathogenesis has been recognized. Increased expression of IKBKE has been found in multiple types of cancer, including breast,3 lung,4 ovarian cancer,5 and glioma.6 IKBKE was first recognized as an oncogene in breast cancer by integrative genomic approaches. IKBKE was found to be amplified in 30% of cases and was able to substitute for AKT in transforming mammary epithelial cells.3 In addition, interleukin-1 inflammatory signals are correlated with increased IKBKE expression in triple-negative breast cancers even in the absence of genomic amplification.7 In lung cancer, activation of STAT3 was found to be correlated with IKBKE upregulation.4 Most evidence ties the oncogenic effects of IKBKE/TBK1 to promoting NF-κB pathway activation.3,8-12 As a serine/threonine kinase, several substrates have been identified to be phosphorylated by IKBKE or TBK1, including CYLD,11 FOXO3a,13 TRAF2,10 AKT,14 ERα,15 PLK1,16 and IRF3.17
Given the role that many of these pathways play in the pathogenesis of AML, we characterized the role of IKBKE/TBK1 in AML cell survival and evaluated the potential of pharmacological inhibitors of these kinases for the treatment of AML.
Materials and methods
Analysis of gene expression data from primary AML samples
The expression if IKBKE (probes 204549_at and 214398_s_at) and TBK1 (probe 218520_at) was studied in a publicly available microarray dataset18 containing data on 525 AML samples, 14 CD34+ samples, and 5 normal bone marrow control samples. The Mann-Whitney U test (Graphpad Prism 7) was performed to study whether IKBKE and TBK1 median expression were significantly different between sample groups.
To study whether high IKBKE and TBK1 expression were prognostic factors, AML patients were subdivided into groups of high- and low-/intermediate-expression levels. The overall survival was displayed in Kaplan-Meier plots (Graphpad 7). A 2-tailed log-rank method (SPSS Statistics version 24) was used to test whether survival of patient groups with high (highest 10%) vs low/intermediate (lowest 90%) expression was statistically different. The Cox proportional hazard model was applied for multivariate analysis to study whether high IKBKE expression was an independent prognostic factor (SPSS Statistics version 24). Factors included in the multivariate model were age, white blood cell count, favorable karyotypes (t(8;21), INV(16), and t(15;17)), CEBPA double mutations, FLT3-ITD, and NPM1 mutations.
Cells
The AML cell lines were obtained from James Griffin (Dana-Farber Cancer Institute, Boston, MA) and cultured in RPMI 1640 media supplemented with 10% (for MOLM13, MOLM14, HL60, 31P, NOMO1, and MV411) or 20% fetal bovine serum (FBS; for KASUMI-1 and KG-1a). SKNO1, OCI-AML5, and AML193 were cultured in RPMI 1640 media supplemented with 10% FBS and 5 ng/mL granulocyte-macrophage colony-stimulating factor (GM-CSF).
Bone marrow mononuclear cells from patients with untreated AML and from healthy donors were obtained through a Dana-Farber Cancer Institute Institutional Review Board–approved protocol for which subjects gave written informed consent in accordance with the Declaration of Helsinki. For liquid culture studies, cells were maintained in RPMI 1640 media supplemented with 10% FBS, l-glutamine, sodium pyruvate, essential amino acids and vitamins, β-mercaptoethanol, penicillin, and streptomycin.
Reagents
Momelotinib (CYT387) was obtained from Gilead Sciences (Foster City, CA), and MRT67307 and Ruxolitinib were obtained from Shanghai Haoyuan Chemexpress Co. Ltd. BX-795 was obtained from Selleck Chemicals; BAY-11-7082 was obtained from Calbiochem, and LY294002 was obtained from Santa Cruz Biotechnology (Santa Cruz, CA). All compounds were solubilized in dimethyl sulfoxide (DMSO), which was also used as a vehicle control for all drug treatments. The S102D mutant of YB-1 was kindly provided by Sandra Dunn, University of British Columbia, Vancouver, Canada.
Immunoblots and chromatin immunoprecipitation (ChIP)
Immunoblots and ChIP were performed using the following antibodies: Anti-TBK1 (#3013), Ser102 YB1 (#2900), S473 pAKT (#9271), AKT (#9272), β-Actin (#4970) (Cell Signaling Technologies); YB1 (#17250002; Novus Biologicals); IKBKE (#I4907; Sigma); and, MYC (sc-764; Santa Cruz Biotechnology).
ChIP was performed as described.19 Briefly, leukemia cells were formaldehyde fixed and sonicated, and lysates were immunoprecipitated with anti-YB1 antibody. Quantitative polymerase chain reaction was performed in triplicate on ChIP product or input using SYBR Green PCR Master Mix (Applied Biosystems, Foster City, CA) and region-specific primers for the MYC promoter (forward 5′-TAGGCGCGCGTAGTTAATTC-3′, reverse 5′-AAGGTGGGGAGGAGACTCAG-3′). Values were normalized to input and expressed as mean fold change relative to a negative control DNA binding site.
Colony-forming unit assays
Normal bone marrow CD34+ cells were isolated using the CD34 MicroBead Kit Ultrapure and LS columns according to manufacturer’s instructions (MACS Miltenyi Biotec). Donor CD34+ cells or primary AML samples (>90% blasts) were cultured in StemSpan Serum-Free Expansion Medium supplemented with 100 ng/μL rhTPO (Thermo Fisher Scientific), 100 ng/μL rhFLT3-ligand (Miltenyi Biotec), 100 ng/μL rhSCF (Preprotech), 1% penicillin-streptomycin-glutamine (Life Technologies), and DMSO or indicated concentrations of momelotinib (CYT387) in a humidified incubator at 37°C with 5% CO2. After overnight incubation, cells were harvested, and 1000 to 1500 CD34+ or 8500 to 130 000 AML cells were seeded in triplicate into MethoCult (H4435; StemCell Technologies) supplemented with 1% penicillin-streptomycin-glutamine, and DMSO or momelotinib for colony-forming unit (CFU-GEMM) assays. After 11 to 14 days of incubation, red, white, and mixed colonies were scored, and cells were harvested and counted. If cell numbers allowed, healthy donor and AML cells were replated into new MethoCult (H4435; StemCell Technologies) supplemented with 1% penicillin-streptomycin-glutamine, and DMSO or momelotinib, in triplicate. Colony and cell numbers were assessed another 11 to 14 days later. If possible, replating was repeated again as described before. An unpaired, 2-tailed Student t test was performed on the total colony count to determine statistically significant differences.
Quantitation of viable cell number
Viable cell number was measured by adenosine triphosphate–dependent bioluminescence using the CellTiter-Glo assay (Promega, Madison, WI).
Quantitative RT-PCR
RNA was harvested using an RNeasy Mini Kit from QIAGEN. Complementary DNA was generated using the TaqMan Reverse Transcription kit (Applied Biosystems), and quantitative reverse transcription polymerase chain reaction (qRT-PCR) was performed using primers as indicated (supplemental Table 4). Data are expressed as mean fold change ± standard deviation of at least 2 independent experiments.
Gene expression microarray analysis
RNA was extracted with Trizol and purified by RNeasy Mini Kit from QIAGEN. Gene expression microarray analysis was performed at the DFCI Microarray Core using the “PrimeView” platform.
Apoptosis assays
Cells were stained with annexin V–fluorescein isothiocyanate and propidium iodide (PI) using the annexin V–FLUOS Staining Kit (Roche Applied Science, Penzberg, Germany). Samples were analyzed on the BD FACSCanto II Flow Cytometer (BD Biosciences, San Jose, CA) using negative and single-color controls to adjust compensation. Apoptosis was defined as the sum of both early apoptosis (annexin V positive, PI negative) and late apoptosis (both annexin V and PI positive).
shRNA
Short hairpin RNA (shRNA) constructs targeting IKBKE and TBK1 were kindly provided by Rhine Shen and William Hahn (Dana-Farber Cancer Institute and the Broad Institute, Cambridge, MA).20 shRNA constructs targeting YBX1 (TRCN0000315307 and TRCN0000315309) were from Sigma. Leukemia cells were infected with pLKO-based lentiviruses encoding shRNAs targeting human TBK1 and human IKBKE (shIKBKE#1: TGGGCAGGAGCTAATGTTTCG; shIKBKE#2: GTCCTTAGTCACACACGGCAA) and TBK1 (shTBK1#1: GCAGAACGTAGATTAGCTTAT; shTBK1#2: GCGGCAGAGTTAGGTGAAATT). Infected cells were selected in 3 μg/mL puromycin for 3 days before protein and RNA analysis. Infected cells were also expanded in culture medium without puromycin selection. Apoptosis was evaluated 3 days after lentiviral vector infection and cellular viability 5 days after lentiviral infection using CellTiter-Glo.
Reverse phase protein array (RPPA)
RPPA was carried out by the RPPA core facility at the MD Anderson Cancer Center, as described.21 Briefly, proteins were collected from MOLM14 or OCI-AML5 cells after momelotinib treatment or shRNA knockdown of IKBKE/TBK1. Proteomic analysis of protein expression and phosphorylation states in these samples were evaluated with 218 validated antibodies.
Gene set enrichment analysis (GSEA)
GSEA was performed using GSEA software to determine whether a defined set of genes shows statistically significant difference between given phenotypes. The defined gene set databases used were the c6 oncogenic signature and c1 hallmarks.22,23 Gene set investigation was performed by computing overlaps between the input gene set (the gene set down regulated by momelotinib treatment) and gene set collections in Molecular Signatures Database v6.1 (http://software.broadinstitute.org/gsea/msigdb/).
Mouse studies
Female NSG mice were injected with 1 × 10⁶ MOLM-14-Luc cells in 250 µL phosphate-buffered saline via IV injection. Mice were imaged on days 4 and 8 after cell implantation and randomized into vehicle or treatment groups (n = 8 per group) on day 8. Animals were then treated by either oral gavage with vehicle (10% NMP: 90% [0.5% methylcellulose + 0.4% Tween 80]) or momelotinib at the indicated doses. Bioluminescence imaging was performed once or twice a week for 4 weeks to monitor disease progression, and body weights were measured twice weekly. Spleens were collected 2 hours after the last treatment dose on day 28, photographed, and then flash frozen for further analysis.
Results
IKBKE is highly expressed in AML cells
To identify novel targets for the therapy of AML, we examined kinase expression patterns in publicly available compendia of gene expression data sets. We found that the serine/threonine kinase IKBKE, a noncanonical IκB kinase, is especially highly expressed in hematological malignancies compared with other tumor types (Figure 1A). Although IKBKE transcripts are also present in normal hematopoietic cells, IKBKE is expressed at higher levels in myeloid leukemia cells compared with normal hematopoietic and CD34+ cells (Figure 1B-C; supplemental Figure 1A). Although high expression is found in most genetically defined AML subtypes, the highest IKBKE expression is found in core-binding factor (t(8;21) and INV(16)) and t(15;17) AML (supplemental Figure 1B). These AML subtypes are generally associated with a favorable survival. Consistent with this, patients with the highest 10% IKBKE expression (probe 204549_at) showed a significantly better overall survival compared with other AML patients in a univariate model (supplemental Figure 1C).
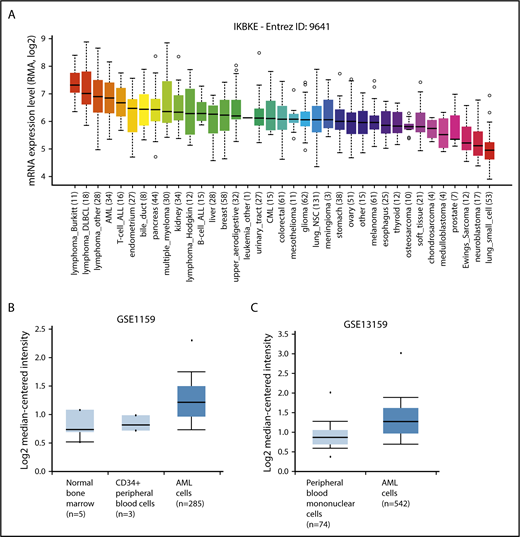
IKBKE is highly expressed in AML. (A) Relative IKBKE expression in human cancer cell lines, derived from the Cancer Cell Line Encyclopedia dataset. (B-C) Relative expression of IKBKE in primary AML cells vs normal cells. Gene expression microarrays from dataset GSE1159. P = 4.83E-5, fold change 1.353 (B). Gene expression microarrays from dataset GSE13159. P = 2.10E-16, fold change 1.303 (C). The IKBKE probe used was ID 204549_a, and graphs were generated from Oncomine. ALL, acute lymphoblastic leukemia; CML, chronic myeloid leukemia; DLBCL, diffuse large B-cell lymphoma; NSC, non–small cell.
IKBKE is highly expressed in AML. (A) Relative IKBKE expression in human cancer cell lines, derived from the Cancer Cell Line Encyclopedia dataset. (B-C) Relative expression of IKBKE in primary AML cells vs normal cells. Gene expression microarrays from dataset GSE1159. P = 4.83E-5, fold change 1.353 (B). Gene expression microarrays from dataset GSE13159. P = 2.10E-16, fold change 1.303 (C). The IKBKE probe used was ID 204549_a, and graphs were generated from Oncomine. ALL, acute lymphoblastic leukemia; CML, chronic myeloid leukemia; DLBCL, diffuse large B-cell lymphoma; NSC, non–small cell.
We also evaluated the transcript level of the close homolog of IKBKE, TANK-binding kinase 1 (TBK1), and found there is no significant difference of expression between tumor types (supplemental Figure 2A). TBK1 expression is higher in AML vs normal CD34+ cells (supplemental Figure 2B left), with the highest expression among AML patients found in NPM1 mutated samples (supplemental Figure 2C). Compared with other genetically defined AML subtypes, TBK1 expression was low in IDH2-mutated AML (supplemental Figure 2C). There was no difference in survival based on TBK1 expression, nor was there a correlation between TBK1 expression and IKBKE expression in individual samples (data not shown).
AML cells depend on IKBKE/TBK1 for survival
To determine the functional significance of this increased expression of IKBKE, we first used RNA interference to deplete IKBKE or TBK1 in AML cells (Figure 2A). We found that most, but not all, AML cell lines show decreased viability in response to IKBKE/TBK1 depletion (Figure 2B). Consistent with this observation, significantly increased apoptosis was observed in AML cells that are sensitive to IKBKE/TBK1 knockdown, but not in cells that are resistant to knockdown (Figure 2C).
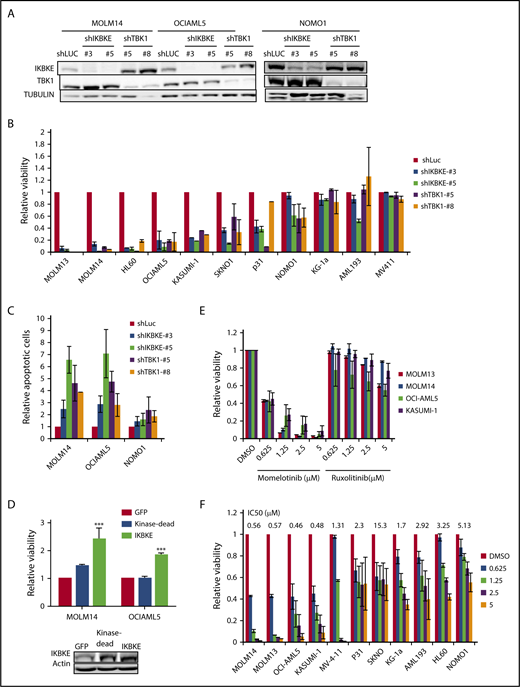
AML cells display differential sensitivity to inhibition of IKBKE and TBK1. (A) AML cell lines were infected with lentiviral vectors containing either shRNA targeting luciferase (shLUC) as a negative control, or the indicated IKBKE or TBK1 shRNA. Following selection in puromycin for 3 days, IKBKE and TBK1 protein levels in whole cell lysates were assessed by immunoblotting. Tubulin serves as a loading control. (B) Relative viability of AML cell lines in which IKBKE or TBK1 was depleted by RNA interference was measured 96 hours after puromycin selection. Error bars represent standard error (SE) of at least 2 independent experiments. (C) AML cell lines were infected with lentiviral vectors containing either control shLuc or the indicated IKBKE or TBK1 shRNA. Seventy-two hours later, apoptosis was quantified by annexin V staining and flow cytometry. Error bars represent SE of at least 2 independent experiments. (D) AML cells were infected overnight with lentiviral vectors containing either green fluorescent protein (GFP), kinase dead IKBKE (K38A), or wild-type IKBKE. Relative viable cell number was evaluated 72 hours after infection. Expression of IKBKE was measured by immunoblotting (inset). (E) The indicated AML cell lines were treated with momelotinib or ruxolitinib at the indicated concentrations. Relative viability was measured 72 hours after drug treatment. Error bars represent SE of at least 2 independent experiments. (F) The indicated AML cell lines were treated with momelotinib at the indicated concentration. Relative viability was measured 72 hours after drug treatment. ***P < .001. IC50, 50% inhibitory concentration.
AML cells display differential sensitivity to inhibition of IKBKE and TBK1. (A) AML cell lines were infected with lentiviral vectors containing either shRNA targeting luciferase (shLUC) as a negative control, or the indicated IKBKE or TBK1 shRNA. Following selection in puromycin for 3 days, IKBKE and TBK1 protein levels in whole cell lysates were assessed by immunoblotting. Tubulin serves as a loading control. (B) Relative viability of AML cell lines in which IKBKE or TBK1 was depleted by RNA interference was measured 96 hours after puromycin selection. Error bars represent standard error (SE) of at least 2 independent experiments. (C) AML cell lines were infected with lentiviral vectors containing either control shLuc or the indicated IKBKE or TBK1 shRNA. Seventy-two hours later, apoptosis was quantified by annexin V staining and flow cytometry. Error bars represent SE of at least 2 independent experiments. (D) AML cells were infected overnight with lentiviral vectors containing either green fluorescent protein (GFP), kinase dead IKBKE (K38A), or wild-type IKBKE. Relative viable cell number was evaluated 72 hours after infection. Expression of IKBKE was measured by immunoblotting (inset). (E) The indicated AML cell lines were treated with momelotinib or ruxolitinib at the indicated concentrations. Relative viability was measured 72 hours after drug treatment. Error bars represent SE of at least 2 independent experiments. (F) The indicated AML cell lines were treated with momelotinib at the indicated concentration. Relative viability was measured 72 hours after drug treatment. ***P < .001. IC50, 50% inhibitory concentration.
Next, we overexpressed IKBKE in AML cells and found that exogenous overexpression of IKBKE leads to an enhancement of viable cell number. This effect of IKBKE is dependent on its kinase activity, as a mutant form lacking kinase activity does not support this effect (Figure 2D). Given this finding, we then evaluated the effects of small molecular inhibitors of IKBKE/TBK1 on AML cell viability. Because a selective, clinically applicable IKBKE/TBK1 inhibitor is not available, we used momelotinib (CYT387), which inhibits JAK kinases as well as IKBKE/TBK1.20 As a comparison, we used ruxolitinib, which only inhibits JAK1 and JAK2 with no activity against IKBKE/TBK1.20 We first examined AML cell lines that require JAK/STAT signaling for proliferation, including OCI-AML5 and SKNO, which require culture in GM-CSF, and HEL, which contains a JAK2 V617F mutation. In these cells, both momelotinib and ruxolitinib inhibit viability with similar potency (supplemental Figure 3). By contrast, in AML cell lines in which JAK/STAT signaling is not required for survival, momelotinib potently inhibits AML cell viability, whereas ruxolitinib has no effect (Figure 2E). These findings suggest that the reduction of viability seen in these cell lines in response to momelotinib is likely due to IKBKE/TBK1 inhibition. There is a range of sensitivities of AML cells to momelotinib (Figure 2F), and this shows a strong correlation with sensitivity to shRNA mediated knockdown of IKBKE/TBK1 (supplemental Figure 4). It should also be noted that momelotinib inhibits TBK1 with a 50% inhibitory concentration in the high nanomolar range in in vitro assays.24 This matches the effective concentrations of momelotinib in the IKBKE-sensitive AML cells. In addition, concentrations in the range of 2 μM can be achieved in humans,25 so again, the concentrations used have the potential for clinical relevance.
IKBKE/TBK1 modulates the MYC signaling pathway in AML cells
We next focused on understanding the key molecular pathways downstream of IKBKE/TBK1 in AML. To do this, we used 2 complementary approaches. We first made use of the fact that AML cell lines could be segregated based on their sensitivity to IKBKE/TBK1 inhibition. We then used the Cancer Cell Line Encyclopedia (http://www.broadinstitute.org/ccle) to obtain the transcriptome profiles of each AML cell line analyzed and then performed GSEA comparing the IKBKE/TBK1 inhibition-sensitive (MOLM14, OCIAML5, HL60, and KASUMI-1) vs -insensitive (MV4-11, KG-1a, MONO-1, and AML193) lines. This analysis revealed a small number of gene sets that are particularly enriched in AML cells sensitive to IKBKE/TBK1 inhibition (Table 1). To further narrow down the gene sets and corresponding signaling pathways that are modulated by IKBKE, we then carried out gene expression profiling to determine global transcriptome changes upon IKBKE/TBK1 inhibition induced by momelotinib in 2 sensitive AML cell lines. We identified 241 genes that were upregulated and 312 genes that were downregulated in both MOLM14 and OCIAML5 cells after 6 hours of treatment with momelotinib (supplemental Tables 1 and 2). Next, we used the 312 downregulated genes as a gene set and computed overlap with Molecular Signature Database 6.1 through Gene Set Investigation. This method allowed us to identify pathways that are inhibited by momelotinib treatment (Table 2). In integrating these 2 analyses, it became clear that gene sets representing the MYC transcriptional program were specifically enriched in cell lines that are sensitive to IKBKE/TBK1 inhibition (Figure 3A) and that the MYC transcriptional program was inhibited by momelotinib. This raised the possibility that a key downstream target of IKBKE/TBK1 in AML cells is the MYC signaling pathway, and AML cells with an activated MYC transcriptional program are more likely to be sensitive to IKBKE/TBK1 inhibition.
Gene sets enriched in IKBKE/TBK1-knockdown–sensitive AML cells
| Gene set | NES | FDR q value |
|---|---|---|
| ALK_DN.V1_UP | 1.530436 | 0.05621 |
| PRC2_SUZ12_UP.V1_DN | 1.546459 | 0.063283 |
| PTEN_DN.V1_DN | 1.489504 | 0.069137 |
| MYC_UP.V1_UP | 1.461089 | 0.069305 |
| LTE2_UP.V1_DN | 1.447226 | 0.070641 |
| KRAS.KIDNEY_UP.V1_UP | 1.462204 | 0.079712 |
| CAHOY_ASTROCYTIC | 1.556317 | 0.084935 |
FDR, false discovery rate; NES, normalized enrichment score.
Gene sets downregulated following momelotinib treatment
| Gene set name | P | FDR q value |
|---|---|---|
| IL15_UP.V1_UP | 3.89E-14 | 3.20E-12 |
| HOXA9_DN.V1_DN | 4.74E-14 | 3.20E-12 |
| MTOR_UP.N4.V1_UP | 5.07E-14 | 3.20E-12 |
| MTOR_UP.V1_UP | 2.34E-13 | 1.10E-11 |
| IL2_UP.V1_UP | 9.96E-13 | 3.76E-11 |
| MYC_UP.V1_UP | 7.09E-09 | 2.23E-07 |
| MEL18_DN.V1_UP | 2.96E-07 | 7.27E-06 |
| STK33_DN | 3.08E-07 | 7.27E-06 |
| BMI1_DN.V1_UP | 3.92E-07 | 8.23E-06 |
| RPS14_DN.V1_DN | 1.97E-06 | 3.72E-05 |
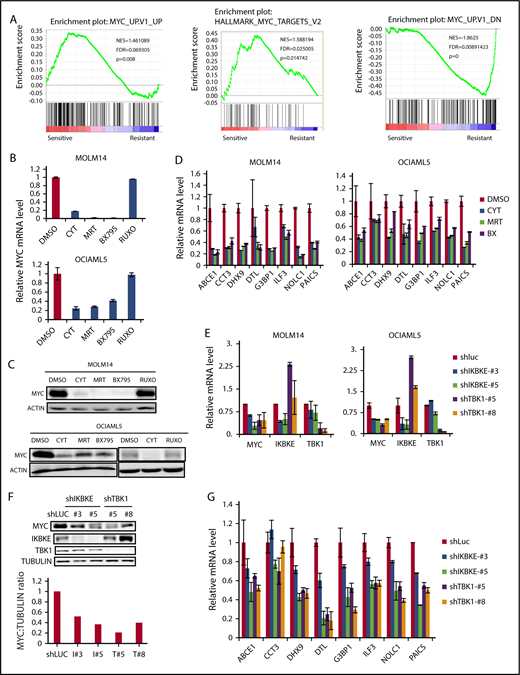
IKBKE/TBK1 inhibition modulates MYC signaling pathway. (A) GSEA of shIKBKE/TBK1-sensitive vs -resistant AML cell lines. Gene set databases used are c6 oncogenic signature and c1 hallmarks. (B-D) MOLM14 or OCIAML5 cells were treated with momelotinib (CYT; 2.5 µM), MRT (2.5 µM), BX795 (2.5 µM), or ruxolitinib (10 µM) for 6 hours, after which RNA or protein was isolated. 18S RNA was used as an internal control for RNA quantification. For OCIAML5, cells were cultured without GM-CSF for 24 hours before drug treatment. (E-G) MOLM14 or OCIAML5 cells were infected with lentiviral vectors expressing shRNA targeting IKBKE, TBK1, or luciferase (as nontargeting control). After 54 hours of puromycin selection, RNA or protein was isolated. For RT-PCR, 18S RNA was used as an internal control. Data are mean ± SE of 2 independent experiments. Quantitation of MYC:tubulin ratio (F) was performed using ImageJ software. RUXO, ruxolitinib.
IKBKE/TBK1 inhibition modulates MYC signaling pathway. (A) GSEA of shIKBKE/TBK1-sensitive vs -resistant AML cell lines. Gene set databases used are c6 oncogenic signature and c1 hallmarks. (B-D) MOLM14 or OCIAML5 cells were treated with momelotinib (CYT; 2.5 µM), MRT (2.5 µM), BX795 (2.5 µM), or ruxolitinib (10 µM) for 6 hours, after which RNA or protein was isolated. 18S RNA was used as an internal control for RNA quantification. For OCIAML5, cells were cultured without GM-CSF for 24 hours before drug treatment. (E-G) MOLM14 or OCIAML5 cells were infected with lentiviral vectors expressing shRNA targeting IKBKE, TBK1, or luciferase (as nontargeting control). After 54 hours of puromycin selection, RNA or protein was isolated. For RT-PCR, 18S RNA was used as an internal control. Data are mean ± SE of 2 independent experiments. Quantitation of MYC:tubulin ratio (F) was performed using ImageJ software. RUXO, ruxolitinib.
To further validate these findings, we used 2 additional IKBKE/TBK1 inhibitors, MRT6730720 and BX795,26 to determine their effect on MYC expression. All 3 pharmacologic inhibitors of IKBKE/TBK1 decreased MYC messenger RNA (mRNA) and protein expression, whereas the Jak inhibitor ruxolitinib showed no effect on MYC expression (Figure 3B-C). Using an MYC mini-signature gene list,27 we also directly validated that the MYC transcriptional program was inhibited by momelotinib treatment (Figure 3D). This did not reflect a general inhibition of transcription, as a panel of NF-κB target genes was not inhibited by momelotinib (supplemental Figure 5). We also wished to evaluate the effect of these IKBKE/TBK1 inhibitors on MYC expression in cells that were resistant to IKBKE/TBK1 inhibition. In KG-1α and MV411 cells, both of which are resistant to IKBKE/TBK1 inhibition, none of the 3 drugs affected MYC levels (supplemental Figure 6). Furthermore, we evaluated a panel of MYC target genes in KG-1α cells, and these were also not significantly affected by treatment with these inhibitors. Taken together, these results show that the MYC pathway is inhibited by IKBKE/TBK1 inhibition only in AML cells sensitive to the cytotoxic effects of these drugs, and that MYC pathway inhibition correlates with the sensitivity of AML cells.
To further confirm that MYC inhibition by momelotinib is mediated through inhibition of IKBKE, we knocked down IKBKE or TBK1 in AML cells using RNA interference. We found reduced MYC mRNA and protein levels following knockdown of either IKBKE or TBK1 (Figure 3E-F), with concurrent reduction in the MYC transcriptional profile, as well (Figure 3G). These results demonstrate that inhibition of IKBKE/TBK1 downregulates the MYC oncogenic pathway in AML cell lines.
IKBKE/TBK1 modulates MYC through phosphorylation of YB-1
To understand the mechanism of MYC regulation by IKBKE/TBK1, we first considered effects on the NF-κB pathway, which is known to be regulated by these kinases. However, neither NF-κB nuclear translocation nor NF-κB–dependent luciferase reporter activity was inhibited by momelotinib (supplemental Figure 7). Furthermore, Gene Set Investigation of mRNA profiles from leukemia cell lines treated with momelotinib did not show evidence of NF-κB pathway inhibition (Table 2). Finally, expression of a panel of NF-κB target genes was not inhibited by momelotinib in sensitive AML cell lines (supplemental Figure 5). Thus, although NF-κB may be a key target of IKBKE/TBK1 inhibitors in solid tumors, it does not appear to be inhibited in AML cells.
In considering other mechanisms by which IKBKE/TBK1 could modulate MYC expression, we hypothesized that IKBKE/TBK1 phosphorylated other proteins that possess transcriptional or translational modulatory functions. To examine this possibility in an unbiased fashion, we carried out RPPA21 in MOLM14 and OCIAML5 cell lines treated with either momelotinib or shRNA knockdown of IKBKE/TBK1. With momelotinib treatment, we selected a short treatment duration of 2 and 6 hours in each cell line to focus on proteins that are more likely to be direct substrates of IKBKE/TBK1. As an internal control, we first verified that inhibition of IKBKE/TBK1 by either shRNA knockdown or pharmacologic inhibitors led to a decrease in MYC protein levels (supplemental Table 3). We then found significant and consistent reduction in the serine phosphorylated form of the oncogenic transcription/translation factor YB-1 upon IKBKE/TBK1 inhibition (Figure 4A). We validated this observation by showing that all 3 small molecule inhibitors of IKBKE/TBK1 reduced phosphorylation of YB1 (Ser102), without affecting total YB1 protein levels. Reduction of YB1 phosphorylation occurs in a dose-dependent manner and as early as 15 minutes following treatment with a pharmacologic inhibitor of IKBKE/TBK1 (Figure 4B). This rapid inhibition of YB-1 phosphorylation suggests that this could be a direct mediator of the effect of IKBKE/TBK1 on MYC expression.
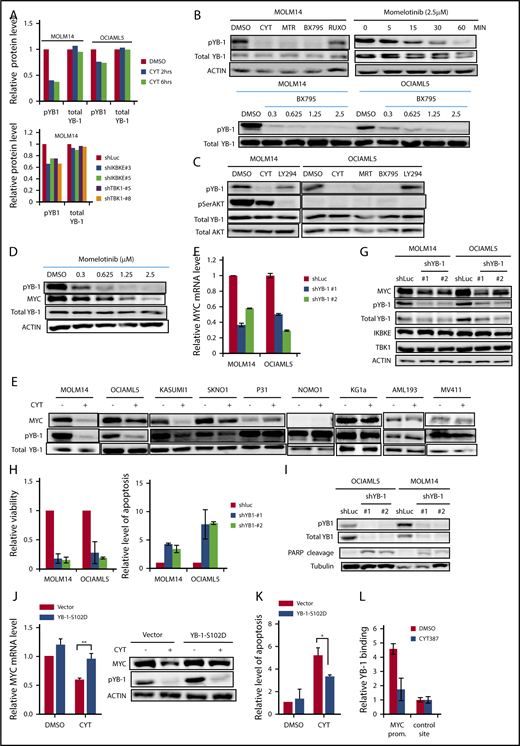
IKBKE/TBK1 modulates MYC through phosphorylation of YB-1. (A) Phosphorylated YB-1 is decreased in AML cells following either treatment with momelotinib or shRNA-mediated knockdown of IKBKE or TBK1, as determined by RPPA. MOLM14 or OCIAML5 cells were treated with momelotinib (CYT; 2.5 µM) for 2 or 6 hours before whole cell extracts were prepared for RPPA analysis. For shRNA experiments, cells were infected with lentiviral vectors containing either shRNA targeting luciferase (shLUC) as a negative control or the indicated IKBKE/TBK1 shRNA. Cells were selected under puromycin for 54 hours before whole cell extracts were collected for RPPA analysis. (B) MOLM14 cells were treated with momelotinib (CYT; 2.5 µM), MRT (2.5 µM), BX795 (2.5 µM), or ruxolitinib (10 µM) for 6 hours, after which protein was isolated for the indicated immunoblots (top left). MOLM14 cells were treated with momelotinib (1.25 µM) for the indicated times, and then immunoblots were performed (top right). MOLM14 or OCIAML5 cells were treated with the indicated dose of BX795 for 2 hours of treatment, after which immunoblots were performed. (C) MOLM14 cells were treated with momelotinib (CYT; 0.625 µM) or LY294002 (10 µM) for 2 hours, and OCIAML5 cells were treated with CYT (2.5 µM), MRT (2.5 µM), BX795 (2.5 µM), or LY294002 (10 µM) for 2 hours, after which protein was isolated for the indicated immunoblots. (D) MOLM14 cells were treated with the indicated concentration of momelotinib for 2 hours, after which protein was isolated for the indicated immunoblots. (E) AML cell lines were treated with vehicle control or momelotinib (CYT; 1.25 µM for 6 hours), and then the indicated immunoblots were performed. (F-G) MOLM14 or OCIAML5 cells were infected overnight with lentiviral vectors containing shLuc (control) or shRNAs targeting YB-1. After 30 hours of puromycin selection, RNA and protein were isolated for analysis. Results are representative of 3 replicates. (H-I) MOLM14 or OCIAML5 cells were infected overnight with lentiviral vectors containing shLuc or shRNAs targeting YB-1. Cells were then further expanded to low density. Relative viability was evaluated 4 days after lentiviral infection, and apoptosis was evaluated 3 days after infection by annexin V/PI staining (H). Apoptosis was also evaluated 3 days after lentiviral infection by PARP cleavage (I). (J) MOLM14 cells were infected with an empty lentiviral vector or a vector expressing constitutively activated YB-1 (YB-1-S102D). Cells were selected in puromycin for 48 hours and then treated with vehicle (DMSO) or momelotinib (CYT; 0.625 µM) for 6 hours, after which RNA and protein were isolated for analysis. (K) OCIAML5 cells were infected overnight with an empty lentiviral vector or a vector expressing YB-1-S102D. Cells were then treated with vehicle (DMSO) or momelotinib (CYT; 0.625 µM) for 48 hours and then analyzed by flow cytometry for apoptosis by annexin V/PI staining. (L) MOLM14 cells were treated with vehicle (DMSO) or momelotinib (CYT; 1.25 µM) for 6 hours, after which the cells were fixed, and chromatin was isolated for ChIP to evaluate YB-1 binding at the MYC promoter site. Results are means ± standard deviation of 4 replicates.
IKBKE/TBK1 modulates MYC through phosphorylation of YB-1. (A) Phosphorylated YB-1 is decreased in AML cells following either treatment with momelotinib or shRNA-mediated knockdown of IKBKE or TBK1, as determined by RPPA. MOLM14 or OCIAML5 cells were treated with momelotinib (CYT; 2.5 µM) for 2 or 6 hours before whole cell extracts were prepared for RPPA analysis. For shRNA experiments, cells were infected with lentiviral vectors containing either shRNA targeting luciferase (shLUC) as a negative control or the indicated IKBKE/TBK1 shRNA. Cells were selected under puromycin for 54 hours before whole cell extracts were collected for RPPA analysis. (B) MOLM14 cells were treated with momelotinib (CYT; 2.5 µM), MRT (2.5 µM), BX795 (2.5 µM), or ruxolitinib (10 µM) for 6 hours, after which protein was isolated for the indicated immunoblots (top left). MOLM14 cells were treated with momelotinib (1.25 µM) for the indicated times, and then immunoblots were performed (top right). MOLM14 or OCIAML5 cells were treated with the indicated dose of BX795 for 2 hours of treatment, after which immunoblots were performed. (C) MOLM14 cells were treated with momelotinib (CYT; 0.625 µM) or LY294002 (10 µM) for 2 hours, and OCIAML5 cells were treated with CYT (2.5 µM), MRT (2.5 µM), BX795 (2.5 µM), or LY294002 (10 µM) for 2 hours, after which protein was isolated for the indicated immunoblots. (D) MOLM14 cells were treated with the indicated concentration of momelotinib for 2 hours, after which protein was isolated for the indicated immunoblots. (E) AML cell lines were treated with vehicle control or momelotinib (CYT; 1.25 µM for 6 hours), and then the indicated immunoblots were performed. (F-G) MOLM14 or OCIAML5 cells were infected overnight with lentiviral vectors containing shLuc (control) or shRNAs targeting YB-1. After 30 hours of puromycin selection, RNA and protein were isolated for analysis. Results are representative of 3 replicates. (H-I) MOLM14 or OCIAML5 cells were infected overnight with lentiviral vectors containing shLuc or shRNAs targeting YB-1. Cells were then further expanded to low density. Relative viability was evaluated 4 days after lentiviral infection, and apoptosis was evaluated 3 days after infection by annexin V/PI staining (H). Apoptosis was also evaluated 3 days after lentiviral infection by PARP cleavage (I). (J) MOLM14 cells were infected with an empty lentiviral vector or a vector expressing constitutively activated YB-1 (YB-1-S102D). Cells were selected in puromycin for 48 hours and then treated with vehicle (DMSO) or momelotinib (CYT; 0.625 µM) for 6 hours, after which RNA and protein were isolated for analysis. (K) OCIAML5 cells were infected overnight with an empty lentiviral vector or a vector expressing YB-1-S102D. Cells were then treated with vehicle (DMSO) or momelotinib (CYT; 0.625 µM) for 48 hours and then analyzed by flow cytometry for apoptosis by annexin V/PI staining. (L) MOLM14 cells were treated with vehicle (DMSO) or momelotinib (CYT; 1.25 µM) for 6 hours, after which the cells were fixed, and chromatin was isolated for ChIP to evaluate YB-1 binding at the MYC promoter site. Results are means ± standard deviation of 4 replicates.
We then considered whether IKBKE/TBK1 directly phosphorylates YB-1. To examine this possibility, we used Kinase-specific Phosphorylation Site Prediction software (GPS 3.0; http://gps.biocuckoo.org). Based on substrate sequence preference, it was predicted that IKBKE/TBK1 would not directly phosphorylate YB-1 on Ser102. This suggested that another kinase that is activated by IKBKE/TBK1 is directly phosphorylating YB-1. It has been shown that YB-1 can be directly phosphorylated by AKT28-30 in epithelial systems, and AKT is a substrate for IKBK/TBK1. Therefore, we considered whether AKT is phosphorylating YB-1 in AML cells. We treated MOLM14 cells with the PI3 kinase inhibitor LY294002, to block the activating phosphorylation of AKT. We found that LY294002 completely inhibited AKT phosphorylation, but had almost no effect on YB-1 phosphorylation; by contrast, momelotinib completely abolished YB-1 phosphorylation whereas having minimal effects on AKT phosphorylation (Figure 4C). Furthermore, in OCIAML5 cells, all 3 IKBKE/TBK1 inhibitors reduced YB1 phosphorylation. However, no AKT phosphorylation could be detected in these cells, and YB1 phosphorylation was completely unaffected by LY294002 (Figure 4C). Thus, AKT does not appear to mediate the signal from IKBKE/TBK1 to phosphorylate YB-1 in AML cells.
We next investigated whether the effect of IKBKE/TBK1 on MYC expression is mediated through YB-1. First, we found that phosphorylation of YB-1 and expression of MYC decreased in a parallel, dose-dependent manner in MOLM14 cells treated with momelotinib (Figure 4D), making a direct effect plausible. We then examined the relationship between YB-1 phosphorylation and MYC protein expression in a panel of 9 AML cell lines upon momelotinib treatment. Again, there was a strong correlation between inhibition of YB-1 phosphorylation and reduction of MYC among these cell lines (Figure 4E). In addition, knocking down YB-1 reduced MYC mRNA and protein expression (Figure 4F-G) and significantly reduced viability through induction of apoptosis in AML cells (Figure 4H-I). To determine if YB-1 is the key intermediate between IKBKE/TBK1 and MYC expression, we made use of a constitutively active form of YB-1 in which serine-102 has been replaced with an aspartate residue (S102D),31 mimicking the negative charge of phosphorylation at this site. Expression of this construct rescued the inhibition of MYC expression induced by momelotinib treatment (Figure 4J) and largely rescued the induction of apoptosis mediated by this drug (Figure 4K). Taken together, these results indicate that IKBKE/TBK1 modulates MYC expression in AML cells through phosphorylation of YB-1.
Because YB-1 has been reported to act through both transcriptional and translational mechanisms, we next investigated how phosphorylated YB-1 modulates MYC expression. As noted, YB-1 inhibition by either momelotinib treatment or RNA interference leads to reduction of MYC mRNA levels, suggesting that YB-1 modulates MYC transcription. We further analyzed the dynamics of MYC mRNA levels in MOLM14 cells treated with momelotinib and compared it with cells treated with actinomycin D or the bromodomain inhibitor JQ1, both of which inhibit MYC transcription. We found that the rate of decay of MYC mRNA was identical in cells treated with momelotinib, actinomycin D, or JQ1 (supplemental Figure 8). Combined treatment with actinomycin D and momelotinib did not further accelerate the reduction of MYC mRNA levels, suggesting that MYC mRNA stability is unaffected by these treatments. These observations support the hypothesis that phosphorylation of YB-1 modulates MYC at the transcriptional level. Therefore, we determined whether YB-1 could directly bind to the MYC promoter, which contains a cytidine-thymidine–rich promoter element to which YB-1 can bind.32 We performed ChIP, which confirmed that YB-1 binds directly to this site (Figure 4L). Furthermore, this binding of YB-1 was lost when cells were pretreated with momelotinib. Taken together, these data provide evidence that YB-1 modulates MYC transcription.
Inhibition of IKBKE/TBK1 shows therapeutic benefit in in vitro and in vivo models of AML
To determine whether these effects of IKBKE/TBK1 inhibition extended to primary AML cells, we next determined the effect of pharmacologic inhibitors on AML cells isolated from bone marrow aspirates. Interestingly, the AML samples segregated into 2 groups according to their sensitivity to momelotinib and ruxolitinib (Figure 5A). Three of the 8 AML samples demonstrated similar sensitivity to both momelotinib and ruxolitinib, suggesting that Jak activity may play a major role in cell viability in these samples. However, in the other 5 samples, only momelotinib reduced viability significantly, and the cells showed little response to ruxolitinib. We next examined the effect of these drugs on MYC mRNA expression. In the first group of patients, MYC was reduced by both momelotinib and ruxolitinib to similar extents, indicating that MYC expression is most likely modulated by Jak-mediated signaling in those samples (Figure 5B). In the second group, momelotinib decreased MYC expression to a much greater extent than ruxolitinib, suggesting that MYC is likely modulated largely by IKBKE/TBK1 in these samples. These observations suggest that IKBKE/TBK1 is an important driver of MYC expression in a significant fraction of primary AML cells.

Momelotinib inhibits MYC expression and reduces viability and colony formation of primary AML samples. (A) Bone marrow mononuclear cells harvested from 8 untreated patients with AML were treated with momelotinib (CYT) at the indicated concentrations for 72 hours, at which point relative viable cell number was determined by adenosine triphosphate–dependent bioluminescence. (B) Primary AML samples were treated with vehicle, momelotinib (CYT; 2.5 µM), or ruxolitinib (2.5 µM) for 6 hours, after which RNA was harvested for c-MYC quantitation by RT-PCR. (C) CFU-GEMM assays were performed on 4 primary AML samples and CD34+ bone marrow cells from 3 healthy donors, each performed in triplicate. Momelotinib treatment caused a dose-dependent decrease in colony formation in both AML samples and CD34+ controls, with a more pronounced effect on AML samples. Data are normalized to the DMSO-treated control, and the number of input cells. Statistically significant differences between AML and control samples treated with the same concentration of momelotinib are indicated. ***P < .001, **P < .01.
Momelotinib inhibits MYC expression and reduces viability and colony formation of primary AML samples. (A) Bone marrow mononuclear cells harvested from 8 untreated patients with AML were treated with momelotinib (CYT) at the indicated concentrations for 72 hours, at which point relative viable cell number was determined by adenosine triphosphate–dependent bioluminescence. (B) Primary AML samples were treated with vehicle, momelotinib (CYT; 2.5 µM), or ruxolitinib (2.5 µM) for 6 hours, after which RNA was harvested for c-MYC quantitation by RT-PCR. (C) CFU-GEMM assays were performed on 4 primary AML samples and CD34+ bone marrow cells from 3 healthy donors, each performed in triplicate. Momelotinib treatment caused a dose-dependent decrease in colony formation in both AML samples and CD34+ controls, with a more pronounced effect on AML samples. Data are normalized to the DMSO-treated control, and the number of input cells. Statistically significant differences between AML and control samples treated with the same concentration of momelotinib are indicated. ***P < .001, **P < .01.
To further understand the role of IKBKE/TBK1 on the biology of primary AML cells, we studied the effects of momelotinib on growth and self-renewal of AML cells and normal hematopoietic stem and progenitor cells by CFU assays. Momelotinib treatment caused a dose-dependent reduction in colony numbers in CFU assays in all AML samples (Figure 5C; supplemental Figure 9). A decrease in colony numbers was also seen in control CD34+ cells, particularly at high momelotinib concentrations, although this effect was less prominent than that seen in the leukemic cells. With replating, a similar decrease in colony number and cell number was seen with both AML cells and CD34+ cells from healthy subjects (supplemental Figure 9). Thus, although the anti–leukemic effect of momelotinib is apparent in these colony-forming assays, it is possible that inhibition of IKBKE/TBK1 could also have deleterious effects on normal CD34+ cells with prolonged use.
To assess the therapeutic effect of momelotinib in vivo, we evaluated its efficacy in an aggressive mouse model of human AML. MOLM14 cells engineered to express firefly luciferase were injected IV into NSG mice, after which disseminated leukemia was visualized and quantified by bioluminescence imaging. In this model, leukemic cells primarily populate the bone marrow, recapitulating the human disease. Mice were treated with vehicle or 1 of 2 doses of momelotinib (10 mg/kg or 100 mg/kg) administered by gavage for 28 days. Both regimens were well tolerated, and the weight and appearance of the mice remained stable in both treatment groups and controls. Although treatment with the 10-mg/kg dose showed a modest effect in reducing total disease burden, treatment at 100 mg/kg significantly decreased the tumor burden (Figure 6A-B). To determine the pharmacodynamic effects of momelotinib, mice were euthanized 2 hours after the last dose of treatment on day 28, and spleens were harvested. Momelotinib showed a dose-dependent decrease in spleen size in treated mice (Figure 6C). Furthermore, momelotinib showed a dose-dependent inhibition of total IKBKE (a surrogate for kinase inhibition), YB-1 phosphorylation, and MYC mRNA and protein (Figure 6D-F). Consistent with findings in other cancer models,7 prolonged treatment with momelotinib also reduced the total level of IKBKE as well (Figure 6G). These findings indicate that inhibition of IKBKE, and decreased YB-1 phosphorylation and MYC expression, correlates with decreased leukemia burden in an in vivo model of human AML.
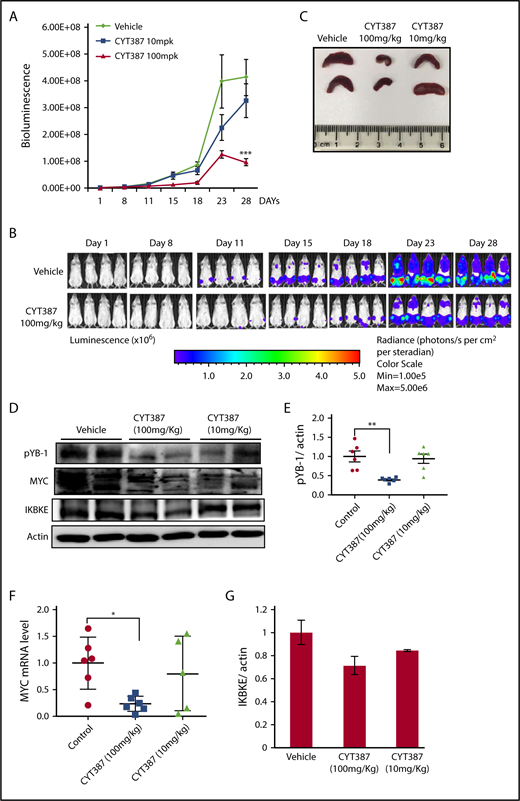
Momelotinib shows on-target therapeutic efficacy in a human AML xenograft model. (A) Tumor burden of NSG mice quantitated by whole-body bioluminescence imaging following IV injection of MOLM14-luc+ cells. Mice were randomly assigned to receive momelotinib (CYT) 100 mg/kg orally daily, 10 mg/kg orally daily, or vehicle control. Data are presented as mean ± standard error of the mean (n = 8/group). ***P = .0004 by unpaired Student t test. (B) Representative whole-body bioluminescent images of mice orthotopically xenografted with MOLM14-luc+ cells and treated with momelotinib (CYT; 100 mg/kg oral daily) or vehicle control. (C) Mice were euthanized 2 hours after the last treatment on day 28. Representative spleens from each treatment group are shown. (D) Protein extracts were made from spleens from each treatment group. Representative immunoblots from 2 spleens from each treatment group are shown. (E) Band intensity for immunoblots from all spleen samples were quantified by ImageJ. **P = .0059 by Welch t test. (F) mRNA was harvested from spleens from each treatment group, and c-MYC was quantitated by RT-PCR. *P = .0108 by Welch t test. (G) IKBKE expression (normalized to actin) was quantitated from the immunoblot in panel D using ImageJ.
Momelotinib shows on-target therapeutic efficacy in a human AML xenograft model. (A) Tumor burden of NSG mice quantitated by whole-body bioluminescence imaging following IV injection of MOLM14-luc+ cells. Mice were randomly assigned to receive momelotinib (CYT) 100 mg/kg orally daily, 10 mg/kg orally daily, or vehicle control. Data are presented as mean ± standard error of the mean (n = 8/group). ***P = .0004 by unpaired Student t test. (B) Representative whole-body bioluminescent images of mice orthotopically xenografted with MOLM14-luc+ cells and treated with momelotinib (CYT; 100 mg/kg oral daily) or vehicle control. (C) Mice were euthanized 2 hours after the last treatment on day 28. Representative spleens from each treatment group are shown. (D) Protein extracts were made from spleens from each treatment group. Representative immunoblots from 2 spleens from each treatment group are shown. (E) Band intensity for immunoblots from all spleen samples were quantified by ImageJ. **P = .0059 by Welch t test. (F) mRNA was harvested from spleens from each treatment group, and c-MYC was quantitated by RT-PCR. *P = .0108 by Welch t test. (G) IKBKE expression (normalized to actin) was quantitated from the immunoblot in panel D using ImageJ.
Discussion
In this study, we have characterized a distinct IKBKE-dependent survival pathway in AML. Inhibition of IKBKE induces apoptosis and significantly reduces viability of a majority of AML cell lines and primary cells. Conversely, overexpressing IKBKE promotes leukemia cell survival. IKBKE knockout mice are viable, with only impaired initiation of a productive interferon-β response.33 Thus, although IKBKE may be essential for leukemia cell survival, it is dispensable for normal hematopoiesis, suggesting that IKBKE is a therapeutic target with a potentially high therapeutic index in AML.
Our efforts to understand the characteristics of AML cells that define sensitivity to IKBKE/TBK1 inhibition and to decipher the molecular pathways downstream of IKBKE/TBK1 both converged on the MYC transcriptional program. MYC inhibition appears essential in mediating the cytotoxicity of IKBKE inhibitors in AML cells, and AML cells that are dependent on the MYC transcriptional program are most likely sensitive to IKBKE/TBK1 inhibition. In AML cells lacking MYC expression, or in which MYC is not inhibited by momelotinib, there is little viability change upon momelotinib treatment. A small number of AML cell lines and primary AML samples showed no change in viability in response to momelotinib despite displaying a decrease in MYC expression. It is possible that in those cells, other survival pathways may be able to substitute in the setting of MYC inhibition, or those cells may not depend on MYC for survival.
In understanding the mechanism of MYC downregulation upon IKBKE inhibition, we identified phosphorylated YB-1 as a key intermediate. YB-1 is a central regulator of gene expression and is subject to posttranslational modifications, such as phosphorylation, ubiquitination, and acetylation.34 Although the role of ubiquitination and acetylation in the functional activity of YB-1 is less understood, phosphorylation of YB-1 has been shown to promote its nuclear translocation and oncogenic activity.30 Although a functional relation between YB-1 and MYC expression has been suggested previously,31,35,37 the present study indicates that it is the phosphorylated form of YB-1 that is crucial in mediating MYC expression in AML. We observed a very high correlation between the inhibition of YB-1 phosphorylation by momelotinib and reduction in MYC expression. Importantly, a constitutively active form of YB-1 rescues MYC expression with momelotinib treatment. All of these observations support a central role for the phosphorylation of serine 102 of YB-1 in modulating MYC expression in AML cells.
As a DNA and RNA binding protein, YB-1 can bind DNA to regulate transcription or it can bind RNA to modulate its stability or translation. YB-1 has been suggested to modulate MYC transcription by binding to a promoter region of MYC,32,35 which leads to docking of core transcription factors and RNA polymerase II.34 On the other hand, YB-1 has also been shown to modulate MYC protein translation in multiple myeloma cells without influencing transcription.36,37 Our data show that either YB-1 knockdown or pharmacologic inhibition of YB-1 phosphorylation reduces MYC mRNA in parallel with MYC protein levels. Furthermore, the kinetics of the decrease in MYC mRNA induced by IKBKE inhibitors overlaps with the changes induced by compounds that inhibit MYC transcription, such as JQ1 and actinomycin D. Finally, ChIP analysis demonstrated that YB-1 binds directly to the MYC promoter, and this binding is disrupted upon inhibition of YB-1 phosphorylation by momelotinib treatment. Together, these observations support the notion that YB-1, particularly the serine-phosphorylated form, modulates MYC transcription in AML cells.
Bromodomain inhibitors, such as JQ1, have been shown to inhibit MYC expression in certain tumor systems and are being evaluated in clinical trials. However, by inhibiting transcription at so-called superenhancers, they may have much broader effects on nonmalignant cells. Because YB-1–driven MYC expression may be a less common cellular mechanism, blocking this pathway specifically may hold the promise of having a higher therapeutic index for treating cancers commonly driven by this mechanism, such as AML. It is also possible that combinations of IKBKE/TBK1 and bromodomain inhibitors may have beneficial effects, including a decrease in the emergence of resistance. However, further studies will be needed to define the potential utility of this approach.
YB-1 clearly sits at a convergence point of a number of kinase pathways. For example, there is evidence that AKT28 can phosphorylate this protein. Nevertheless, our studies show that YB-1 is a key downstream target of IKBKE, independent of these other kinases, in a majority of AML cell lines. However, it remains to be determined whether IKBKE is phosphorylating this protein directly or is acting through an intermediary kinase.
In conclusion, IKBKE/TBK1 modulates MYC through phosphorylation of YB-1 in a significant subset of AML cells. Importantly, it is the activation state of the IKBKE/YB-1/MYC pathway in AML cells, rather than IKBKE or TBK1 expression alone, that determines the sensitivity of AML cells to IKBKE/TBK1 inhibition. The dual JAK and IKBKE/TBK1 inhibitor momelotinib, which has shown a good safety profile in a clinical trial for myelofibrosis,38 may have therapeutic benefits in AML patients whose leukemia is dependent on IKBKE. In addition, the identification of phosphorylated YB-1 as a key downstream mediator leading to MYC expression provides a potential biomarker to select patients and predict and monitor therapeutic effects of IKBKE/TBK1 inhibitors in the treatment of AML.
The full-text version of this article contains a data supplement.
Acknowledgments
The authors thank David Dornan and Susanna Stinson for helpful experimental advice.
This work was supported by National Institutes of Health (NIH), National Cancer Institute grant R01-CA160979, the Gabrielle's Angel Foundation (New York, NY), and the Brent Leahey Fund (Dana-Farber Cancer Institute) (D.A.F.); NIH, National Heart, Lung, and Blood Institute training grant T32HL116324 (S.L.); EMBO fellowship ALTF 268-2017 (A.E.M.); and a Leukemia and Lymphoma Society Scholar Award, NIH, National Cancer Institute grant R35CA210030, and a St. Baldrick’s Cancer Foundation Robert J. Arceci Innovation Award (K.S.). This research was also supported by a generous gift from Stephen P. Koster.
Authorship
Contribution: S.L. designed and performed experiments, analyzed data, and wrote the paper; A.E.M., G.A., S.R.W., H.I.G., D.Q.Y., K.L., R.M., P.A.T., and M.T. performed experiments and analyzed data; P.C.G., D.B., A.M., and K.S. designed experiments and analyzed data; and D.A.F. designed experiments, analyzed data, and provided editorial input.
Conflict-of-interest disclosure: D.B. is a consultant for N of One. D.A.F. has received research funding from Gilead Sciences. The remaining authors declare no competing financial interests.
Correspondence: David A. Frank, Department of Medical Oncology, Dana-Farber Cancer Institute, 450 Brookline Ave, Boston, MA 02215; e-mail: david_frank@dfci.harvard.edu.

