

Key Points
Absolute quantification of proteins expressed in erythrocytes and in reticulocytes with their level of association with the membrane.
Comprehensive analysis of kinases expressed in mature erythrocytes.

Abstract
Reticulocytes produced in the bone marrow undergo maturation in the bloodstream to give rise to erythrocytes. Although the proteome of circulating red cells has been the subject of several reports, the cellular populations used for these studies were never completely devoid of reticulocytes. In our current study, we used highly purified erythrocyte and reticulocyte populations to quantify the absolute expression levels of the proteins in each cell population. Erythrocytes and reticulocytes were purified in a multistep process involving cellulose chromatography, Percoll gradient centrifugation, and fluorescence cell sorting after thiazole orange labeling. Proteins were analyzed by mass spectrometry from whole cells and erythrocyte plasma membrane (ghosts), leading to the identification and quantification of 2077 proteins, including 654 that were reticulocyte-specific. Absolute quantifications of these proteins were made using the mean corpuscular hemoglobin content of the cells as a standard. For each protein, we calculated the percentage loss during the terminal stages of reticulocyte maturation and the percentage of association with the plasma membrane. In addition, we used modified adenosine triphosphate and adenosine diphosphate molecules that enable the transfer of a biotin molecule to the catalytic sites of kinases to isolate active kinases in the erythrocytes and determined the absolute expression of 75 protein kinases and the modification of their expression during reticulocyte maturation. Our findings represent the first absolute quantification of proteins that are specifically expressed in normal erythrocytes with no detectable contamination by reticulocytes. Our findings thus represent a reference database for the future proteomic analysis of pathological erythrocytes.
Introduction
Erythrocytes are the most numerous cells of the human body.1 Their lifespan in the bloodstream is ∼120 days and a healthy human produces 2 million reticulocytes each second to replace senescent cells. The transformation of immature reticulocytes into mature red cells takes 2 to 3, days first in the bone marrow and subsequently in the spleen and circulation. During this short time, important modifications occur such as membrane remodeling, removal of remaining organelles, and specific elimination of proteins such as the transferrin receptor (TFRC) and adhesive proteins. This remodeling ensures that erythrocytes can optimally fulfill their main gas transport functions both by maintaining optimal cell hemoglobin concentration and by bestowing a high degree of deformability that allows these cells to transit the smallest capillaries.
Recent developments in proteomic technologies have enabled the absolute quantification of thousands of proteins from small amounts of cells.2 This represents a considerable advance because it permits a valid comparison of the cellular expression of many proteins and a determination of their stoichiometry inside complexes.3 These analyses require the presence of reference proteins that have already been quantified in independent experiments.4,5 Histones, whose cellular levels are roughly constant, are frequently used for this referencing purpose in nucleated cells.5,6
Several reports on proteomic analysis of erythrocytes have been previously published, although only 1 prior study has presented absolute quantitative analysis.7 Overall, >2000 proteins have been identified in circulating erythrocytes and these data have been reviewed by Goodman et al.7 The major flaw of these analyses is that insufficient attention was paid to the purity of the analyzed erythrocyte populations. Current proteomics methods enable the identification and quantification of proteins with an expression ratio >6 logs. Consequently, the use of routine erythrocyte purification, although acceptable for most classical biochemical or functional studies, is not appropriate for comprehensive and accurate analysis of the erythrocyte proteome. In this context, the previously studied red cell proteome contains proteins that originate from leukocytes or platelets such as CD14, Elane, DFEA1, ITGA2B, or ITGB3. Moreover, efficient methods to completely eliminate reticulocytes from erythrocytes were not used in the prior analyses. Accordingly, the identification of TFRC and many ribosomal proteins reflects the presence of reticulocytes in all of the analyzed blood cell populations to date. Hence, the true erythrocyte proteome still remains to be established.
Proteomic analysis of circulating reticulocytes has been rarely performed. A recent study used isobaric tag for relative and absolute quantification labeling to compare the proteomes of immature reticulocytes from cord blood.8 Although the authors used anti-CD71–conjugated beads to enrich for reticulocytes, subsequent analysis showed contamination of the reticulocyte preparations by erythrocytes and vice versa. Wilson et al generated reticulocytes in vitro using CD34+ erythroid progenitors from cord blood or adult peripheral blood and compared their respective proteomes with those of adult or cord blood erythrocytes after tandem mass tag labeling.9 These reticulocyte populations were younger than the circulating reticulocytes. Moreover, the labeling strategies used for analysis did not allow the absolute protein quantification.
In our current study, we used highly purified populations of erythrocytes and circulating reticulocytes to analyze their protein composition. We used the mean corpuscular hemoglobin (MCH) content of these cells to quantify the copy number per cell of each protein. Overall, we quantified 2077 proteins in these cells, among which 654 proteins were only detected in reticulocytes.
Material and methods
Reticulocyte and erythrocyte preparation
Blood samples were obtained from healthy donors who gave their informed consent. The preparation procedure for reticulocytes and erythrocytes is summarized in Figure 1. Four milliliters of venous blood were sampled into EDTA and centrifuged. The pelleted crude erythrocyte populations were then chromatographed through cellulose fibers (Sigma-Aldrich) to remove leukocytes. The pass-through material was diluted with phosphate-buffered saline and separated into 2 fractions. Fraction 1 was used for erythrocyte purification and was separated through 62% and 72.5% Percoll layers. After centrifugation, the cell pellets (erythrocyte-enriched population [EEP]) were used either for direct analysis or for further erythrocyte enrichment by cell sorting. Fraction 2 was centrifuged through 62% and 70% Percoll layers. Cells at the interface between the Percoll layers and inside the 70% Percoll layer (“P4”) were used for subsequent reticulocyte purification by fluorescence-activated cell sorting (FACS). For cell sorting, the P3 and P4 populations were labeled with thiazole orange. Thiazole orange–negative cells from P3 or positive cells from P4 were selected as erythrocyte-purified erythrocytes (EPPs) and purified reticulocytes (Retic), respectively.
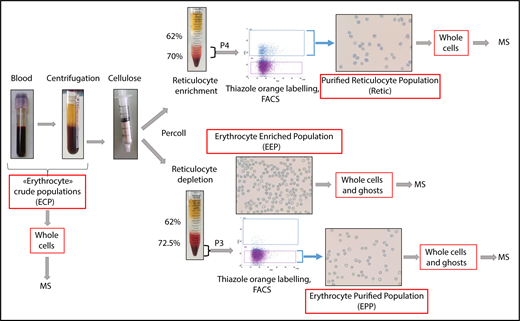
Peripheral blood cell purification flowchart. Reticulocytes and erythrocytes were purified from the peripheral blood of healthy donors. Blood was centrifuged for 10 minutes at 150g to remove plasma and a portion of the leukocytes and platelets. During this step, crude cell populations were sampled for MS analysis. The remaining leukocytes and platelets were removed by passing the cells through a cellulose column packed in 2-mL plastic syringes. Cells not retained in the column were separated into 2 fractions that were centrifuged through Percoll layers of different concentrations to obtain fractions depleted (P3) or enriched (P4) in reticulocytes. A cell sample from P3 (EEP) was used for MS analysis. In the experiment reported, the EEP cell population contained 0.62% of reticulocytes. Cells were labeled with thiazole orange (TO), and erythrocytes (EPP; TO− cells) and reticulocytes (Retic; TO+) were purified by FACS from P3 and P4 fractions, respectively, using a FACSJazz cell sorter (BD Biosciences). Between 750 000 and 2 million purified reticulocytes and between 6 and 15 million erythrocytes were obtained from each purification procedure and used for subsequent analyses. The purity of isolated cell populations was controlled by cytocentrifuged cells stained with New Methylene Blue (reticulocyte stain; Sigma-Aldrich).
Peripheral blood cell purification flowchart. Reticulocytes and erythrocytes were purified from the peripheral blood of healthy donors. Blood was centrifuged for 10 minutes at 150g to remove plasma and a portion of the leukocytes and platelets. During this step, crude cell populations were sampled for MS analysis. The remaining leukocytes and platelets were removed by passing the cells through a cellulose column packed in 2-mL plastic syringes. Cells not retained in the column were separated into 2 fractions that were centrifuged through Percoll layers of different concentrations to obtain fractions depleted (P3) or enriched (P4) in reticulocytes. A cell sample from P3 (EEP) was used for MS analysis. In the experiment reported, the EEP cell population contained 0.62% of reticulocytes. Cells were labeled with thiazole orange (TO), and erythrocytes (EPP; TO− cells) and reticulocytes (Retic; TO+) were purified by FACS from P3 and P4 fractions, respectively, using a FACSJazz cell sorter (BD Biosciences). Between 750 000 and 2 million purified reticulocytes and between 6 and 15 million erythrocytes were obtained from each purification procedure and used for subsequent analyses. The purity of isolated cell populations was controlled by cytocentrifuged cells stained with New Methylene Blue (reticulocyte stain; Sigma-Aldrich).
Ghost preparation
Erythrocytes from EEPs and from EPPs were incubated for 20 minutes at 4°C in hypotonic buffer (5 mM Na2HPO4, pH 8, 0.3 mM EDTA, 1 mM phenylmethylsulfonyl fluoride). The membranes were pelleted by centrifugation for 15 minutes at 22 000g. The ghost pellet was washed several times with hypotonic buffer to obtain a white pellet which was solubilized in lysis buffer (Tris/HCl 200 mM, pH 8.5, 2% sodium dodecyl sulfate).
Kinome analysis
Kinases were purified using the kinase enrichment kit from Pierce in accordance with the manufacturer’s instructions using both adenosine 5′-triphosphate (ATP) and adenosine 5′-diphosphate (ADP) probes. One milligram of proteins from the EEP was used in each purification, after which the proteins were digested using the filtered-aided-sample-preparation method and peptides were analyzed by mass spectrometry.
Label-free sample preparation for proteomic analysis
Three million erythrocytes and 750 000 to 2 million reticulocytes were boiled for 5 minutes at 95°C in 150 µL of lysis buffer (Tris/HCl 200 mM, pH 8.5, 2% sodium dodecyl sulfate). Protein concentrations were determined using a bicinchoninic acid assay (BCA kit; Pierce). Thirty-microgram samples of these proteins were digested using the filtered-aided-sample-preparation method as described previously.10 Peptides were desalted on C18 StageTips and fractionated using strong cation exchange (SCX) StageTips in 5 fractions.
Nanoscale liquid chromatography coupled to tandem mass spectrometry analysis
Mass spectrometry (MS) analyses were performed on a Dionex U3000 RSLC nano-LC system coupled to an Orbitrap Fusion mass spectrometer (Thermo Fisher Scientific). Peptides from each SCX fraction were solubilized in 0.1% trifluoracetic acid containing 10% acetonitrile and separated on a C18 column (2-µm particle size, 75-µm inner diameter, 25-cm length; Thermo Fisher Scientific) with a 3-hour gradient starting from 99% solvent A (0.1% formic acid) and ending with 55% solvent B (80% acetonitrile, 0.085% formic acid). The mass spectrometer operated in a data-dependent manner with full MS scans acquired with the Orbitrap, followed by higher-energy collisional dissociation fragmentations of the most abundant ions with detection in the ion trap for 3 seconds.
Analyses of MS/MS data
The MS data were analyzed using MaxQuant software using the Uniprot-Swissprot reviewed database (Uniprot-Swissprot, release 2017-05).11,12 Carbamidomethylation of cysteines was set as a constant modification and variable modifications were restricted to acetylation of protein N termini and oxidation of methionines. Label-free protein quantification (LFQ) was done using both unique and razor peptides with at least 2 ratio counts.11 Data from all experiments were analyzed simultaneously using the match between runs (MBR) option. Functional analyses of data from MaxQuant were done with Perseus software.
Absolute quantification
Absolute quantification of cell proteins was done according to Wiśniewski et al using the LFQ values from MaxQuant.5,13 The MCH was used as a reference for whole-cell lysates. The LFQ value for hemoglobin corresponded to the sum of LFQ for all identified globin chains. Quantification of BAND3 protein was retrieved from these whole-cell lysate quantifications in each sample and used as a reference for the quantification of ghost proteins in the corresponding sample.
Results
Preparation of highly purified erythrocyte and mature reticulocyte populations
We established a method to obtain highly purified EPPs and Retic. The Retic populations contained 5.4% ± 1.2% erythrocytes and no reticulocyte was detected in the EPP cell populations (Figure 1). We also used the EEP fraction for kinase purifications that required higher amounts of material, although this fraction still contained between 0.2% and 1.6% reticulocytes (Figure 1). Ghosts were prepared from semipurified (EEPs) and purified erythrocytes (EPPs). Overall, 6 blood samples from 6 different donors were used. EEPs and Retics were obtained for each of these samples and EPPs were prepared from 4 of them. Ghosts were purified from 5 EEP fractions and from 3 EPP fractions. Moreover, 2 crude erythrocyte populations corresponding to whole blood, or obtained after plasma and leukocyte removal by centrifugation only, were also analyzed by MS.
Determination of erythrocyte and reticulocyte proteomes
Because the whole-cell content must be analyzed to perform an absolute quantification of reticulocyte and erythrocyte proteins, it was necessary to manage the very large proportion of globins in these cells. We decided to lengthen the analysis times to increase the periods dedicated to the analysis of nonglobin peptides. Overall, 2438 proteins were identified with a false discovery rate below 1% for both peptides and proteins (supplemental Excel file 1 “MaxQuant Export” sheet). Reverse, contaminating, and serum proteins were first removed leading to a cleaned list of 2191 proteins. We used the 2 samples corresponding to crude erythrocyte populations and the MBR function of MaxQuant to ascertain the purity of the cell populations. As expected, these crude populations were contaminated by platelets and leukocytes, as indicated by the presence of proteins specific for these cells (eg, PF4, thrombospondin, PPBP, VWF, MPO, LCN2, etc). The MBR function of MaxQuant considerably increases the sensitivity of detection by allowing the identification of peptides at minute levels in samples using only their retention times and m/z values (provided that these peptides have been correctly identified by fragmentation in another sample). Despite the strong increase in sensitivity, specific proteins from leukocytes or platelets were not detected in the EEP, Retic, and EPP, thus confirming the high purity of these populations. Ghost preparations allowed the identification of 537 additional proteins. Proteins only present in the crude fractions were removed, leading to the identification of 2077 proteins belonging to the erythrocytes and/or reticulocytes (supplemental Excel file 1 “Red cell proteome” sheet). TFRC, a canonical reticulocyte marker, was identified in the reticulocyte samples and in the ghosts prepared from EEP but not in the whole cell or in the ghost preparations of EPP samples.
Absolute quantification of red cell proteins
Wiśniewski et al have demonstrated that the relative mass proportion for a protein in a complex mixture is correctly reflected by the ratio of its MS signal to the total MS signal.5,13 Thus, using either spiked reference proteins or an internal standard allows the absolute quantification of the sample proteins. Histones that are frequently used for these quantifications5,6 are not usable for protein quantification in erythrocytes but the MCH content of these cells can be used for this purpose. This value is readily obtained from the complete blood count of each blood sample including for pathological erythrocytes. The minimum number of total peptides that should be taken into account in the quantification process to get a robust readout was first determined by calculating the relative contribution of hemoglobin peptides after ranking the peptides by intensity. The fraction of hemoglobin is roughly constant when at least 2000 peptides have been used for quantification regardless of the cell population under consideration. This is well below the total number of quantified peptides (Figure 2A). Overall, 1717 proteins were quantified with a median sequence coverage of 31.5% (supplemental Excel file 1 “Abs Quant WC preparations” sheet). A total of 1073, 1658, and 992 proteins were quantified in the EEP, Retic, and EPP whole-cell preparations, respectively (Figure 2B). We quantified 908 proteins in all 3 populations and 562 proteins were exclusively quantified in reticulocytes (Figure 2C-D). The dynamic range of protein expression encompassed 7 logs and included protein copy numbers from a few hundreds per cell, such as PIEZO1, up to several hundreds of millions per cell for the globins (Figure 2E). The reproducibility of these quantifications was confirmed by correlation analyses (Figure 2F-H). The same analysis showed a strong similarity between the proteome of EEP and that of EPP, whereas these 2 proteomes were more distantly related to the proteome of Retic as expected (Figure 2I). The same absolute quantification values were obtained after dilution of the cell sample (Figure 2J), demonstrating that the mass spectrometer detectors were not saturated by high amounts of globin peptides.
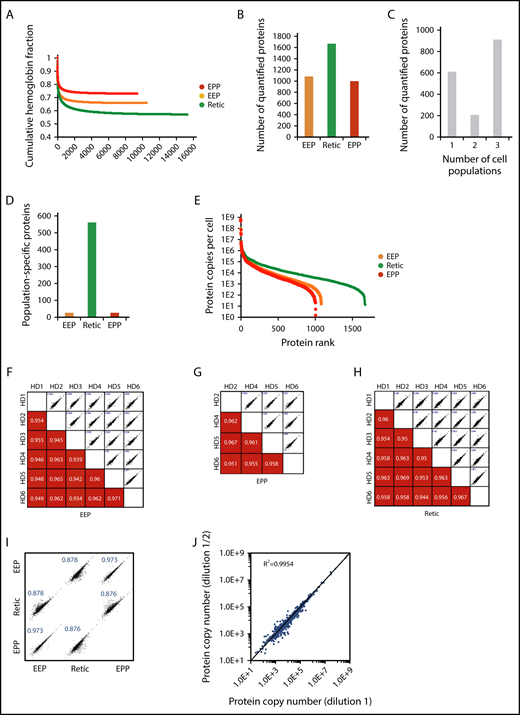
Overall analysis of the proteomic data for whole-cell preparations. (A) Contribution of globin MS signal to the MS signal of all identified proteins. Identified peptides were ranked according to their intensity and the contribution of globin peptides to the sum of the intensities of all identified peptides was calculated at each point. (B) Number of proteins quantified in the EEP, EPP, and Retic populations. (C) Number of proteins quantified in single-cell, 2-cell, or 3-cell populations. (D) Number of proteins only quantified in the EEP, Retic, or EPP cell population. (E) Dynamic range of protein quantification in the EEP, EPP, and Retic cell populations. Proteins were ranked according to their expression level. (F-H) Reproducibility of the quantifications in the different experiments. The numbers in the bottom panels indicate Pearson correlation coefficients. (I) Relationship between protein expression levels in the EEP, EPP, and Retic cell populations. Numbers are Pearson correlation coefficients. (J) The absolute quantification is not affected by dilution of the analyzed peptides. SCX fractions were analyzed directly and after a twofold dilution.
Overall analysis of the proteomic data for whole-cell preparations. (A) Contribution of globin MS signal to the MS signal of all identified proteins. Identified peptides were ranked according to their intensity and the contribution of globin peptides to the sum of the intensities of all identified peptides was calculated at each point. (B) Number of proteins quantified in the EEP, EPP, and Retic populations. (C) Number of proteins quantified in single-cell, 2-cell, or 3-cell populations. (D) Number of proteins only quantified in the EEP, Retic, or EPP cell population. (E) Dynamic range of protein quantification in the EEP, EPP, and Retic cell populations. Proteins were ranked according to their expression level. (F-H) Reproducibility of the quantifications in the different experiments. The numbers in the bottom panels indicate Pearson correlation coefficients. (I) Relationship between protein expression levels in the EEP, EPP, and Retic cell populations. Numbers are Pearson correlation coefficients. (J) The absolute quantification is not affected by dilution of the analyzed peptides. SCX fractions were analyzed directly and after a twofold dilution.
BAND3 quantification values were subsequently used for the quantification of ghost proteins. Thirty-two unique peptides were used for the quantification of this integral membrane protein, allowing the good reliability of its absolute quantification. Accordingly, quantification values obtained for BAND3 in the EPP samples (1.5 × 10⁶ copies per cell) were very similar to the expression level previously determined using biochemical methods (1.2 × 10⁶ copies per cell, reviewed in Burton and Bruce14 ). All proteins detected in the ghost preparations were quantified (supplemental Excel file 1 “Abs Quant Ghosts preparations” sheet). Overall, 276 proteins with a transmembrane domain were quantified in the ghost samples. Very similar quantification values were obtained for most of these transmembrane proteins detected in both ghost and whole-cell preparations (Figure 3A), although some membrane proteins expressed at low levels that were barely quantified in the whole-cell preparations, such as PIEZO1, SLC30A1, or ATP2B1, showed significantly higher expression values in the ghost preparations. In contrast, proteins that are mainly cytoplasmic, such as SOD1, carbonic anhydrases, or globins were detected at much lower quantities in ghost fractions (Figure 3B). The strong agreement between most of the membrane protein quantifications from the ghost preparations with those obtained from whole-cell preparations confirmed that the huge amounts of globins present in the latter preparations did not significantly impair this analysis. Two proteins with a transmembrane helix, CLIC1 and STX4, appeared to be largely excluded from the ghosts (Figure 3A). CLIC1 is a chloride ion channel that can adopt a cytosolic soluble form or a membrane-bound form. Interconversion between the cytoplasmic and the membrane-bound form involves the exposure of hydrophobic surfaces of the N-terminal domain and is regulated by a redox environment and a low pH. After membrane insertion, CLIC1 oligomerizes and forms a chloride channel.15 Syntaxin4 (STX4) is a SNARE protein involved in vesicular trafficking and the regulation of GLUT4 expression at the plasma membrane in fat and muscle cells.16 Erythrocytes express only tiny amounts of GLUT4 and the role of STX4 as well as that of CLIC1 in erythrocytes remain to be determined.
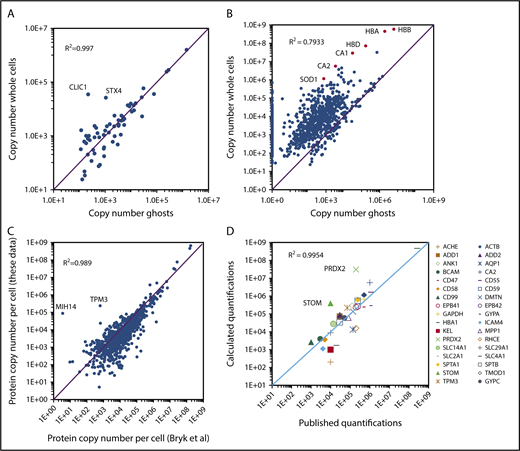
Absolute protein quantification in whole-cell and in ghost preparations. (A) Comparison of the quantification values for transmembrane proteins. Proteins with transmembrane domains were selected using the keyword annotations in Uniprot. Proteins quantified in both whole-cell and ghost preparations were selected and the quantification values were compared. (B) Comparison of the quantification values for all proteins quantified in the whole-cell preparations. (C) Comparison of the quantification values obtained in the present study with those reported previously by Bryk and Wiśniewski.19 (D) Comparison of the present study quantification values with those obtained by biochemical methods and compiled by Burton and Bruce14 except for HBA1, which was calculated starting from a hemoglobin content of 30 pg per erythrocyte and CA2 that was obtained from Sterling et al.27
Absolute protein quantification in whole-cell and in ghost preparations. (A) Comparison of the quantification values for transmembrane proteins. Proteins with transmembrane domains were selected using the keyword annotations in Uniprot. Proteins quantified in both whole-cell and ghost preparations were selected and the quantification values were compared. (B) Comparison of the quantification values for all proteins quantified in the whole-cell preparations. (C) Comparison of the quantification values obtained in the present study with those reported previously by Bryk and Wiśniewski.19 (D) Comparison of the present study quantification values with those obtained by biochemical methods and compiled by Burton and Bruce14 except for HBA1, which was calculated starting from a hemoglobin content of 30 pg per erythrocyte and CA2 that was obtained from Sterling et al.27
For each protein, the ratio of its expression in the ghost preparations to that in the whole cells (ghost expression ratio [GER]) offers a good estimation of its level of association with the plasma membrane. Interestingly, erythrocytes still contain some histone molecules that appear to be associated with the plasma membrane (supplemental Excel file 1 “EPP copy numbers” sheet). A metabolic complex that brings together several glycolytic enzymes including glyceraldehyde-3-phosphate dehydrogenase (GAPDH), phosphofructokinase, aldolase, and pyruvate kinase has been identified. This complex associates with the NH2 terminus of BAND3 and several other proteins of the red cell membrane including β-spectrin, ankyrin, actin, and protein 4.2.17,18 The GER of GAPDH is very high, showing that at least 50% of the GAPDH molecules firmly associate with the red cell plasma membrane. The GERs of other proteins of this metabolic complex are lower, ranging from 10% for phosphofructokinase to <1% for aldolase. Moreover, the expression levels of phosphofructokinase and pyruvate kinase are much lower than those of aldolase or GAPDH. This suggests that the composition of these complexes should be heterogeneous and dynamic.
The absolute quantifications for EPP proteins were compared with those obtained previously by Bryk and Wiśniewski who used a similar label-free proteomic strategy, whereas they used the estimated total protein content of the red cell instead of the determined MCH value as the standard for absolute quantification.19 The quantification values obtained in both analyses showed strong similarity, with a correlation coefficient (R2) of 0.989 (Figure 3C). Nevertheless, some discrepancies were observed. Overall, several proteins that are poorly expressed appear to be quantified at lower levels whereas the globins were quantified at higher levels in our experiments. The accuracy of the absolute quantifications was tested by comparing the obtained values for EPP proteins with those obtained previously using biochemical methods and compiled by Burton and Bruce.14 Overall, the quantifications obtained from our global analysis were in agreement with the previously reported values with a correlation coefficient above 0.99 (Figure 3D). Some notable differences could still be observed, however. Among the most important of these, also noted by Bryk and Wiśniewski,19 the expression levels of PRDX2 and STOM (Band7) appear to have been previously strongly underestimated.
Kinases and phosphatases in erythrocytes and reticulocytes
We identified 114 kinases in the global analysis of erythrocytes and reticulocytes (supplemental Excel file 2). To identify additional kinases, we adopted a targeted approach using modified ATP or ADP molecules that could covalently link the catalytic site and thereby transfer a biotin moiety to the kinases, thus enabling their purification. Because the efficiency of purification is likely to be different depending on the kinase, we did not include these data to the absolute quantification of the red cell proteome. Sixty-seven kinases were identified using this method, including 11 kinases that were not identified in the global analyses, leading to the identification of a panel of 125 kinases expressed in circulating reticulocytes and/or erythrocytes, including 75 proteins with protein kinase activity. Seven tyrosine kinases, 2 putative histidine kinases, 5 dual kinases, and 61 serine/threonine kinases were identified in red cells (supplemental Excel file 2). The NME1 histidine kinase is highly expressed in erythrocytes, and NME1 and NME2 are required for efficient erythropoiesis.20 These proteins also possess nucleoside diphosphate kinase, Ser/Thr protein kinase, and 3′-5′ exonuclease activities. The role of these proteins in erythrocytes and the catalytic specificity involved are currently unknown. The most heavily expressed Ser/Thr kinase in red cells is OXSR1 (Figure 4A,C). WNK1, its upstream activator, is also present in reticulocytes and in mature erythrocytes (Figure 4A). The kinase activity of WNK1 is sensitive to osmotic stress and WNK1 is genetically linked to a rare type of hypertension (PHA2).21 OXSR1 phosphorylates several cation-chloride cotransporters that belong to the SLC12A family and this phosphorylation inhibits their transport activity.22 Two potassium chloride symporters (SLC12A6 and SLC12A7) are expressed in EPP and/or EEP cell samples (supplemental Excel file 1). Thus, all the players of a putative regulatory pathway linking osmotic and oxidative stresses to ion exchange are present in erythrocytes through the WNK1/OXSR1/SLC12A6-7 proteins. Several proteins of the MAPK pathways are well expressed including ERK1, ERK2 and JNK2, 5 MAP2Ks (MEK), and 3 MAP4Ks. A significant portion of ERK2 and MEK2 (MAP2K2) was present in the ghost preparations implying that a functional ERK pathway is associated with the plasma membrane in erythrocytes.
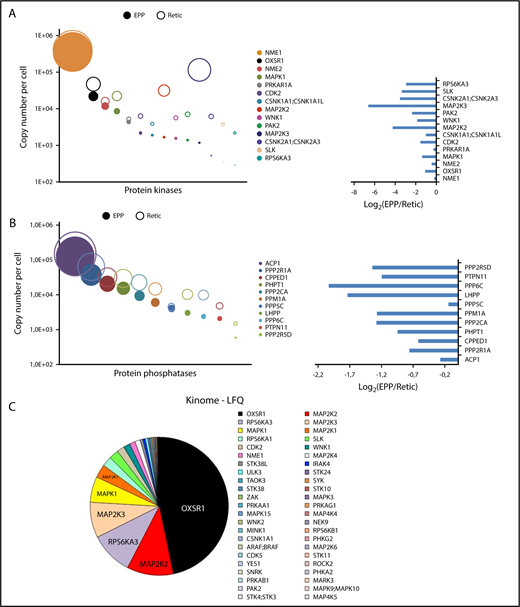
Protein kinases and phosphatases of the red cell proteome. Protein kinases (A) or phosphatases (B) quantified from whole-cell and/or ghost preparations were ranked according to their expression levels in erythrocytes. Absolute quantifications in erythrocytes (EPP) and in reticulocytes (Retic) are indicated (right panel). Left panels, The expression ratio of these proteins in erythrocytes vs reticulocytes. (C) Protein kinases identified by the kinome-targeted approach using modified ATP or ADP probes. The pie chart is in proportion to the LFQ value of each identified kinase.
Protein kinases and phosphatases of the red cell proteome. Protein kinases (A) or phosphatases (B) quantified from whole-cell and/or ghost preparations were ranked according to their expression levels in erythrocytes. Absolute quantifications in erythrocytes (EPP) and in reticulocytes (Retic) are indicated (right panel). Left panels, The expression ratio of these proteins in erythrocytes vs reticulocytes. (C) Protein kinases identified by the kinome-targeted approach using modified ATP or ADP probes. The pie chart is in proportion to the LFQ value of each identified kinase.
In addition to these kinases, erythrocytes also express protein phosphatases, and, interestingly, the most heavily expressed protein phosphatase that we detected, ACP1, is an acid phosphatase that also possesses tyrosine phosphatase activity. It is essentially excluded from ghosts (GER < 1%; supplemental Excel file 1) and it is predominantly retained with the erythrocytes during reticulocyte maturation.
Comparison of the erythrocyte and reticulocyte proteomes
We quantified 1658 proteins in our reticulocyte preparations. As expected, the expression of these proteins was similar or more frequently higher in reticulocytes than in erythrocytes (Figure 5A). Reticulocyte-specific proteins were selected according to their absence of detection in EPP. When a protein was absent from EPP but present in the EEP population, it was considered a reticulocyte-specific protein only if its expression was higher in the reticulocytes. A total of 654 proteins were thus considered reticulocyte-specific and should correspond to the proteins that are removed during the late stages of reticulocyte maturation (supplemental Excel file 1 “Only in reticulocytes” sheet). This set of proteins is strongly enriched for factors involved in protein translation. In contrast, proteasomes are quantitatively retained in the erythrocytes (Figure 5B-D). Most proteins of the glycolysis pathway are also quantitatively retained in erythrocytes whereas a significant portion of pyruvate kinase is lost during reticulocyte maturation (Figure 5E). Surprisingly, a significant portion of BAND3 (SLC4A1) is also removed during the maturation of reticulocytes. This is also true for SLC29A1 (ENT1), an equilibrative nucleotide transporter, whereas other specific erythroid membrane proteins are mainly conserved during maturation (Figure 6).
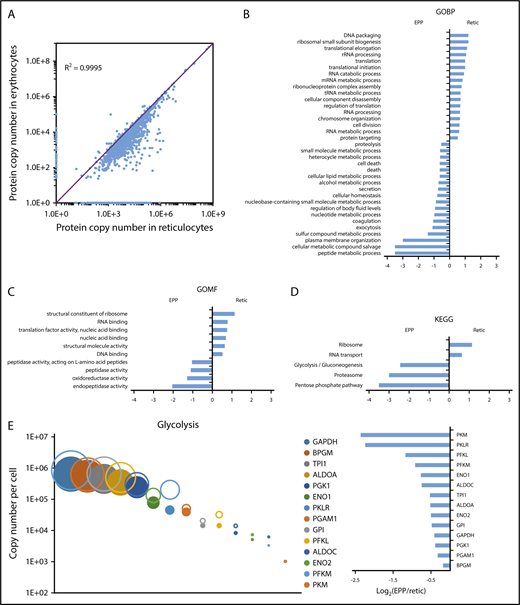
Modifications of the red cell proteome during reticulocyte maturation. (A) Comparison of the expression level of each quantified protein in reticulocytes and erythrocytes. (B-D) Proteins whose expression decreased by at least 90% during reticulocyte maturation, including proteins that were no longer detected in erythrocytes, were compared with the proteins quantified in erythrocytes that did not present such a decrease during reticulocyte maturation. Term enrichment analysis in these 2 sets of proteins was done with Perseus software using annotations from the Kyoto Encyclopedia of Genes and Genomes (KEGG), from the Gene Ontology Biological Process (GOBP), or from the Gene Ontology Molecular Functions (GOMF) databases. (E) Modification of the expression level of glycolysis pathway proteins during reticulocyte maturation. Expression level (as copy number per cell) of each protein in the reticulocytes (open circles) and in the erythrocytes (closed circles) is indicated (right panel), the expression ratio in erythrocyte vs reticulocyte is indicated (left panel).
Modifications of the red cell proteome during reticulocyte maturation. (A) Comparison of the expression level of each quantified protein in reticulocytes and erythrocytes. (B-D) Proteins whose expression decreased by at least 90% during reticulocyte maturation, including proteins that were no longer detected in erythrocytes, were compared with the proteins quantified in erythrocytes that did not present such a decrease during reticulocyte maturation. Term enrichment analysis in these 2 sets of proteins was done with Perseus software using annotations from the Kyoto Encyclopedia of Genes and Genomes (KEGG), from the Gene Ontology Biological Process (GOBP), or from the Gene Ontology Molecular Functions (GOMF) databases. (E) Modification of the expression level of glycolysis pathway proteins during reticulocyte maturation. Expression level (as copy number per cell) of each protein in the reticulocytes (open circles) and in the erythrocytes (closed circles) is indicated (right panel), the expression ratio in erythrocyte vs reticulocyte is indicated (left panel).
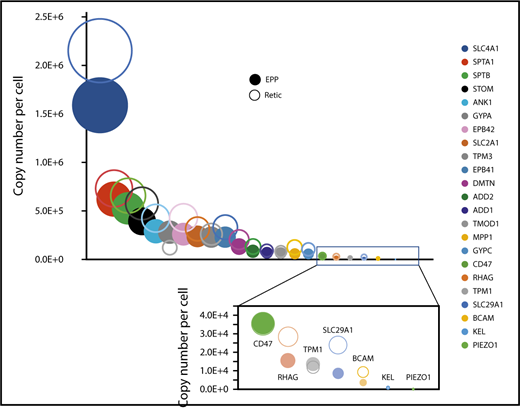
Expression of specific proteins on the red cell membrane during erythrocyte maturation. Proteins known to play a specific role in erythrocyte membrane organization and/or function were selected. Their expression levels in reticulocytes (open circles) and in erythrocytes (filled circles) are indicated.
Expression of specific proteins on the red cell membrane during erythrocyte maturation. Proteins known to play a specific role in erythrocyte membrane organization and/or function were selected. Their expression levels in reticulocytes (open circles) and in erythrocytes (filled circles) are indicated.
Discussion
Although several global analyses of the erythrocyte proteome have been published previously (see Wilson et al9 for a detailed review of the erythrocyte proteomic studies), the cellular populations used for these studies were never depleted of reticulocytes and were also frequently contaminated by leukocytes and platelets. Accordingly, TFRC, and many ribosomal and histone proteins, were detected in these preparations. We therefore designed a protocol to obtain highly purified populations of reticulocytes and erythrocytes for proteomic study. The absence of detectable leukocytes and platelets in all of our analyzed populations and the absence of reticulocytes in the erythrocyte populations was controlled using microscopy and flow cytometry but also by searching for specific markers of these cell populations among the identified proteins. To this end, we took advantage of the high dynamic range of detection that is possible with proteomic analyses (Figure 2E). Thus, our present data provide the first true quantification of proteins expressed in erythrocytes with no detectable contribution from reticulocyte proteins.
The simultaneous determination of the reticulocyte proteome allowed for identification of the modifications that occur during the last stages of red cell maturation. For each identified protein, we calculated the percentage that is lost during the maturation of reticulocytes to erythrocytes (supplemental Excel file 1). These data extend the proteomic analysis of human erythropoiesis that we recently published. In that previous study, we quantified the repartition of proteins between the pyrenocytes and the reticulocytes during the enucleation process.6 We examined the relationship between protein exclusion during enucleation and during reticulocyte maturation. Six hundred eighty proteins whose repartition between pyrenocytes and reticulocytes had been quantified were also quantified in circulating reticulocytes. For each of these 680 proteins, we compared the percentage transferred to the pyrenocyte during enucleation with the percentage that is lost during terminal reticulocyte maturation. There was no correlation found between these 2 values (R2 = 0.0153; supplemental Figure 1), indicating that reticulocyte maturation cannot be reduced simply to the completeness of the protein removal process initiated by enucleation. Recently, Wilson et al compared the proteome of reticulocytes and erythrocytes using a relative quantification process.9 The reticulocytes used in this study were obtained from in vitro cultures of CD34+ circulating progenitors and thus are less mature that the circulating reticulocytes used in our study. Moreover, no step to eliminate the reticulocytes from the erythrocyte populations was used by Wilson et al and, accordingly, the erythrocyte populations contained TFRC and many ribosome proteins implying contamination by reticulocytes. Nevertheless, the authors observed that the amount of most proteins decreased during reticulocyte maturation, a result in agreement with our data (see Figure 5A). They report that the amount of some proteins including GYPA and proteins of the proteasome subunits increased during reticulocyte maturation. We also observed that the amount of GYPA increased during reticulocyte maturation (Figure 6) but we did not notice such an increase for the other proteins, possibly because our reticulocyte populations were more mature than those used by Wilson et al. Nevertheless, we observed that the proteasome proteins were among the more retained proteins during the last steps of reticulocyte maturation (Figure 5D). Chu et al purified reticulocytes from cord blood according to the cell surface expression of TFRC.8 The negative cell population was considered as erythrocytes although it still contained 4.1% of cells positive for thiazole orange staining, a feature of reticulocytes. Our results confirm the strong decrease of tubulin and talin isoforms reported by these authors during reticulocyte maturation (see supplemental Excel file 1) as well as the decrease of proteins of the translation machinery (Figure 5B).
Many red cell pathologies such as sickle cell disease lead frequently to reticulocytosis. Our data could help to distinguish proteins that are truly overexpressed in pathological erythrocytes from those that are downregulated during reticulocyte maturation. For example, it has been reported that Erk proteins remain active in sickle cell disease erythrocytes but not in normal erythrocytes.23 The real significance of these results is questionable because our data show that MEK expression is 20-fold higher in reticulocytes than in erythrocytes. Our current analysis further shows that a complex purification process, which includes a step with cell sorting by FACS, is mandatory to obtain erythrocyte populations devoid of any detectable contamination by reticulocytes.
A single high-throughput absolute quantification of erythrocyte proteins has been previously reported.19 The authors used the total cellular protein amount that was estimated to be 20% of the total cellular mass as reference for quantification. It can be calculated using these reported values that erythrocytes would contain <10 pg of hemoglobin per cell, a value that strongly underestimates the hemoglobin content of red cells. Most likely, the reference for quantification is not accurate and the MS signals for globin peptides have been underestimated. In our current analyses, we used the determined MCH value that is easily obtained from clinical laboratories for each blood sample and is also usable for pathological erythrocytes. Importantly, we verified that sample dilution did not change the quantification values (Figure 2J). Absolute quantification of proteins in the ghost fraction was done using the BAND3 quantification value obtained from the whole-cell extract. We determined that the expression value of Glut1 or spectrins can also be used for this purpose (data not shown). Thus, our quantification method is specific to each analyzed erythrocyte population. It only requires the MCH value for the analyzed blood sample and is usable for normal or pathological erythrocyte populations.
Many regulatory proteins including 75 protein kinases have been quantified. The physiological role of most of these factors is, however, unknown. This is the case for OXSR1 that we identified as the most heavily expressed protein kinase in erythrocytes. OXSR1 was also the most abundant protein kinase identified by ATP binding, strongly suggesting that this kinase is indeed active in erythrocytes. Whether it is involved in the control of ionic channels as reported in other cell types is an attractive hypothesis that remains be tested. Interestingly, erythrocytes also possess proteins that could allow functional regulation through histidine phosphorylation. This includes not only the 2 histidine kinases NME1 and NME2,24 but also the histidine phosphatases PHPT125 and LHPP.26 Obviously, a phosphoproteomic analysis in different physiological conditions would help to determine the specific involvement of these kinases in the regulation of erythrocyte functions.
Overall, our current proteomic analysis provides absolute quantification data for ∼1000 proteins expressed in human erythrocytes and the quantification of >600 other proteins that are removed during the last stages of reticulocyte maturation. This data set will be a major asset for the future study of various red cell disorders and of the mechanisms involved in the last steps of erythrocyte maturation, as well as in the regulation of erythrocyte functions.
The mass spectrometry proteomics data reported in this article have been deposited in the ProteomeXchange Consortium via the PRIDE partner repository (data set identifiers PXD009258 [whole cell extracts and ghosts] and PXD009396 [kinome data]).
The full-text version of this article contains a data supplement.
Acknowledgments
The authors thank Cédric Broussard, Evangeline Bennana, and David Rombaut (all from 3P5) for their contribution to the proteomic analyses.
This work was supported by grants from Laboratory of Excellence GR-Ex (reference ANR-11-LABX-0051). The labex GR-Ex is funded by the Investissements d’avenir program of the French National Research Agency (reference ANR-11-IDEX-0005-02). The Orbitrap Fusion mass spectrometer was acquired with funds from Fonds Européen de Développement Régional (FEDER) through the Operational Program for Competitiveness Factors and Employment 2007-2013 and from the Canceropole Ile de France.
Authorship
Contribution: E.-F.G., N.M., and P.M. designed the study; E.-F.G., K.B., and P.M. set up and realized the erythrocyte and reticulocyte purification protocols; E.-F.G., S.C., and W.E.N. set up and realized the ghost purifications; E.-F.G., F.G., and M.L. realized the MS analyses; E.-F.G., F.G., M.L., and P.M. analyzed the proteomic data; C.L., E.-F.G., N.M., and P.M. wrote the article; and all authors critically reviewed the manuscript.
Conflict-of-interest disclosure: The authors declare no competing financial interests.
Correspondence: Patrick Mayeux, Institut Cochin, INSERM U1016, 27 rue du Faubourg Saint-Jacques, 75014 Paris, France; e-mail: patrick.mayeux@inserm.fr.

