

Key Points
MYC plays a key role in driving ibrutinib resistance in mantle cell lymphoma.
MYC, a bona fide client of HSP90, is inhibited by PU-H71, which overcomes intrinsic ibrutinib resistance in lymphoma cells.

Abstract
The BTK inhibitor ibrutinib has demonstrated a remarkable therapeutic effect in mantle cell lymphoma (MCL). However, approximately one-third of patients do not respond to the drug initially. To identify the mechanisms underlying primary ibrutinib resistance in MCL, we analyzed the transcriptome changes in ibrutinib-sensitive and ibrutinib-resistant cell lines on ibrutinib treatment. We found that MYC gene signature was suppressed by ibrutinib in sensitive but not resistant cell lines. We demonstrated that MYC gene was structurally abnormal and MYC protein was overexpressed in MCL cells. Further, MYC knockdown with RNA interference inhibited cell growth in ibrutinib-sensitive as well as ibrutinib-resistant cells. We explored the possibility of inhibiting MYC through HSP90 inhibition. The chaperon protein is overexpressed in both cell lines and primary MCL cells from the patients. We demonstrated that MYC is a bona fide client of HSP90 in the context of MCL by both immunoprecipitation and chemical precipitation. Furthermore, inhibition of HSP90 using PU-H71 induced apoptosis and caused cell cycle arrest. PU-H71 also demonstrates strong and relatively specific inhibition of the MYC transcriptional program compared with other oncogenic pathways. In a MCL patient-derived xenograft model, the HSP90 inhibitor retards tumor growth and prolongs survival. Last, we showed that PU-H71 induced apoptosis and downregulated MYC protein in MCL cells derived from patients who were clinically resistant to ibrutinib. In conclusion, MYC activity underlies intrinsic resistance to ibrutinib in MCL. As a client protein of HSP90, MYC can be inhibited via PU-H71 to overcome primary ibrutinib resistance.
Introduction
Mantle cell lymphoma (MCL) is an aggressive B-cell malignancy that represents approximately 6% of non-Hodgkin lymphomas.1 The B-cell receptor (BCR) signaling pathway plays an important role in the pathogenesis of MCL. MCL cell lines and primary tumors show active BCR signaling, which leads to activation of BTK and downstream NF-κB or the PI3K-AKT pathway that drive cell proliferation and survival.2-6 BCR-targeting agents have been tested in preclinical and clinical settings and demonstrated success in controlling MCL.7,8 Remarkably, the BTK inhibitor, ibrutinib (ibr), has achieved an overall response rate of 68% and median progression-free survival of 13.9 months in relapsed and refractory patients with MCL,9 and the drug has been approved for the treatment of MCL in this particular setting. Despite the efficacy of ibr, primary resistance presents in approximately one third of patients, and acquired resistance occurs in nearly all patients.9,10 Moreover, patients who develop ibr resistance have a dismal outcome with a median overall survival of only 2.9 months after ibr cessation.10 Thus, there is an urgent need to better understand the resistance mechanisms and identify specific targets that may prevent or overcome such resistance.
Thus far, several mechanisms of ibr resistance have been identified in MCL.11 Primary resistance has been linked to sustained activation of PI3K-AKT pathway as well as activation of the alternative NF-κB pathway, both of which act downstream of the BCR pathway and thus provide a bypass of the upstream BCR blockade.12-14 Secondary resistance occurs in almost all patients that may be mediated through point mutations involving the C481 residual of BTK, which significantly reduces the binding affinity between the drug and the BTK kinase.15-18 However, these mechanisms do not account for the full spectrum of clinically observed ibr resistance.
Resistance to ibr may be prevented and overcome by targeting other BCR pathway components. We recently demonstrated that many of the components of the BCR pathway are bona fide clients of the oncogenic HSP90 in CLL.19 HSP90 chaperon stabilizes BCR kinases including LYN, SYK, BTK, and AKT in a multiclient interatome. Inhibition of HSP90 by either knock-down or PU-H71-induced CLL tumor cell apoptosis in a cytoprotective microenvironment.19 HSP90 inhibitors are also effective in several other B-cell malignancies including diffuse large B-cell lymphoma,20 Burkitt lymphoma,21 and multiple myeloma,22 as well as MCL.23-25
In this study, we aim to explore mechanisms of primary ibr resistance in MCL by comparing RNA profiles of the sensitive and resistant MCL cell lines after ibr exposure. We identified that MYC-controlled gene expression program underlies primary resistance to ibr. We showed that MYC DNA is disarranged and protein is overexpressed in MCL cell lines, and genetic knockdown of MYC decelerates the cellular growth. In the cellular context of MCL, MYC is a bona fide client of HSP90, and the chaperon is overexpressed in both MCL cell lines and primary MCL patient samples. We then explored the therapeutic potential of HSP90 inhibition in MCL using PU-H71, a purine scaffold inhibitor.
Materials and methods
Cell culture, reagents, and antibodies
See supplemental Materials and methods for details.
RNA-seq and gene expression profiling analysis
The RNA-seq experiments were conducted on the basis of published recommendations with 3 biological triplicates.26 JEKO cells were treated with dimethyl sulfoxide (DMSO) or 0.4 μM ibrutinib. MAVER cells were treated with DMSO, 0.4 μM ibrutinib, or 0.5 μM PU-H71. Cell extracts were isolated at 0 (baseline control), 6, or 16 hours after treatment. Total RNA was isolated from cells using RNA mini kit (Qiagen) after the manufacturer’s instructions. QuBit RNA assay was used to quantify the extracted RNA. Agilent Bioanalyzer was then used to assess RNA quality. An Illumina TruSeq Stranded RNA Sample Preparation Kit was used for library preparation, followed by sequencing on the Illumina HiSeq 2500 platform with single-end 50 cycles at an average depth coverage ranging from 11 to 26 M reads.
The quality of raw sequencing reads was assessed using FastQC v0.11.2 (https://www.bioinformatics.babraham.ac.uk/projects/fastqc/). Reads were mapped to University of California Santa Cruz human genome model (hg19), using STAR_2.5.3a.27 Gene transcripts were assembled and quantified using the count-based HTSeq,28 as well as featureCounts29 methods. These 2 methods correlated with a correlation coefficient of 1. The summarized gene expression results from featureCounts were then normalized with edgeR.30 Gene Set Enrichment Analysis (GSEA) was used to identify specific gene sets associated with the differentially expressed genes between DMSO and drug-treated conditions.31 Seven curated lymphoma gene set signatures, previously defined by Staudt’s group and others,13,32 were analyzed for enrichment significance in 4-group comparison (shown in Figure 5C) with 1000 random permutation of gene sets and weighted enrichment statistic (P = 2). In addition, the leading genes enriched in ibrutinib-treated JEKO were used to generate heat maps and were used as a baseline to compare with other treatment conditions.
Fluorescence in situ hybridization
See supplemental Materials and methods for details.
Cell block preparation and immunohistochemistry for MYC
MYC-positive Burkitt lymphoma tissue was used as positive control and normal tonsil as negative control. See supplemental Materials and methods for details.
Primary MCL cells and normal B cells
Frozen primary MCL cells were obtained from the Department of Pathology at the University of Chicago and MD Anderson Cancer Institute, with Institutional Review Board review and approval. See supplemental Materials and methods for details.
Immunoblot analysis
See supplemental Materials and methods for details.
PU-H71 chemical precipitation and HSP90 immunoprecipitation
Chemical precipitation and immunoprecipitation were conducted as described.19 See supplemental Materials and methods for details.
Cell metabolic activity, cell growth, cell cycle and viability, and apoptosis analyses
See supplemental Materials and methods for details.
siRNA nucleofection
siRNA against human MYC (2 µg) were transfected into CLL cells using Amaxa Nucleofector II device (Amaxa, Cologne, Germany) and Solution V. Nucleofector program U-15 was applied according to the manufacturer's instructions. Cell numbers were followed from days 1 to 8 after the nucleofection.
MCL PDX model
The MCL patient-derived xenograft (PDX) model was established as described previously.33 All experimental protocols were approved by the Institutional Animal Care and Use Committee of the MD Anderson Cancer Center and performed in accordance with the Declaration of Helsinki. In essence, 6- to 8-week-old male NSG mice (Jackson Laboratory) were housed and monitored in the animal research facility. After the mice were anesthetized with 5% isoflurane vaporizer, 5 × 10⁶ fresh lymphoma cells, isolated from a patient with MCL with partial response to ibr, were directly injected into human fetal bone implants within NSG-hu hosts. Once tumor growth was detected in the first generation, tumor masses were tested for human anti-CD20 expression and then passaged to 5 mice in the second generation. When the tumor mass equally grew in the second generation, it was passed into the third generation of mice for in vivo treatment (5 mice/group). Five days after tumor implantation, the animals were administered vehicle control, ibr (50 mg/kg, oral gavage daily) or PU-H71 (75 mg/kg, intraperitoneal injection, 3 times/week) until the endpoint, defined as when 1 diameter of tumor mass reaches 15 mm or when mouse become moribund. The dose of PU-H71 was selected according to the previous study.34 The dose of ibrutinib was selected according to the pharmacology review published by the US Food and Drug Administration Center for Drug Evaluation and Research.35
During treatment with vehicle control or indicated agents, tumor volume was measured with a caliper. Overall survival was measured using the Kaplan-Meier method. P < .05 was considered significant.
Statistical analysis
Indicated in individual figure legends (Figures 3F, 5E, 6A-B, and 7B-C).
Results
MYC is suppressed by ibr in drug-sensitive but not drug-resistant MCL cells
We and others have shown previously that MCL cell line JEKO is intrinsically sensitive and MAVER is intrinsically resistant to ibr.12,13 To identify additional mechanisms that may contribute to primary ibr resistance in MCL, we performed RNA sequencing on these 2 cell lines with or without ibr treatment and compared the changes in gene expression profiles. We analyzed common gene sets from the publicly available database, KEGG pathway gene sets, and lymphoma-specific gene sets curated by Shaffer et al,32 using GSEA. As expected, our results showed that the BCR gene signature was inhibited by ibr in the sensitive cell line JEKO, but not in the resistant cell line MAVER (supplemental Figure 1A).
In addition to BCR signature, we also uncovered that a MYC gene signature, annotated previously by Staudt’s group,36 was significantly suppressed by ibr treatment in sensitive JEKO compared with the vehicle control (Figure 1A-B; P < .0001 and FDR, 9%). In contrast, this response to ibr was absent in the resistant MAVER cells (P = .20 and FDR, 30%). These findings were further verified by using a MYC gene set derived from a different source for evaluation,37 with similar P values and FDRs (Figure 1C; P < .0001 and FDR, 10% for JEKO vs P = .20 and FDR, 29% for MAVER). Figure 1D summarized the relationships between cellular response and changes in MYC gene signature. Overall, by RNA-seq screening, we show that MYC suppression correlates with primary ibr sensitivity in these 2 MCL cell lines. We then performed additional experiments to validate the role of MYC in MCL.

MYC suppression correlates with primary ibr sensitivity. (A) GSEA of MYC gene signature33 in JEKO and MAVER cells after treatment with either 0.4 µM of ibr for 6 hours or DMSO. False discovery rate (FDR) and P values are indicated. (B) Heat map showing differential gene expression in top-ranked genes from MYC signature in JEKO and MAVER cells after treatment with either 0.4 µM of ibr for 6 hours or DMSO. Biological triplicate experiments were conducted and represented by 3 columns for each condition. (C) Table summarizing the changes in MYC signature in relation to cellular response to ibr. (D) Confirmatory GSEA using a different set of MYC signature genes.34
MYC suppression correlates with primary ibr sensitivity. (A) GSEA of MYC gene signature33 in JEKO and MAVER cells after treatment with either 0.4 µM of ibr for 6 hours or DMSO. False discovery rate (FDR) and P values are indicated. (B) Heat map showing differential gene expression in top-ranked genes from MYC signature in JEKO and MAVER cells after treatment with either 0.4 µM of ibr for 6 hours or DMSO. Biological triplicate experiments were conducted and represented by 3 columns for each condition. (C) Table summarizing the changes in MYC signature in relation to cellular response to ibr. (D) Confirmatory GSEA using a different set of MYC signature genes.34
MYC DNA is structurally abnormal and MYC protein is overexpressed in MCL cell lines
We investigated whether MCL have structural rearrangements of the MYC gene by fluorescence in situ hybridization (FISH), using MYC dual-color break-apart probe (Figure 2A). We also performed immunohistochemical (IHC) staining for MYC on cell blocks made from 4 MCL cell lines to correlate the DNA study with protein expression (Figure 2B). Normal cells, by FISH, display a 2-yellow fusion signal pattern. Among 4 cell lines tested, only GRANTA showed a normal pattern of 2 fusion signals. JEKO, MINO, and MAVER all demonstrated abnormal signal patterns (Figure 2A). FISH analysis of JEKO line revealed a gain of 3 extra 5′ regions of MYC (red). MINO, in contrast, was characterized by a gain of several extra copies of the MYC locus (3∼4 fusion signal pattern with 2 additional 5′MYC regions). MYC signal pattern in the MAVER cells was consistent with a MYC translocation, with a gain of an extra 5′ MYC region. Further, IHC examinations demonstrated that MYC protein is overexpressed in the nuclei of all 4 lines of cells including GRANTA, in which gain of MYC expression may be a result of epigenetic dysregulation (Figure 2B in comparison with the tonsil control in Figure 2C). Taken together, these data show that the MYC DNA is structurally abnormal and MYC protein is highly expressed in MCL cell lines. These data are consistent with the immunoblotting results by Dai et al showing that MYC is overexpressed in MCL cell lines compared with a multiple myeloma cell line.38 Thus, MYC may play an important role in MCL.
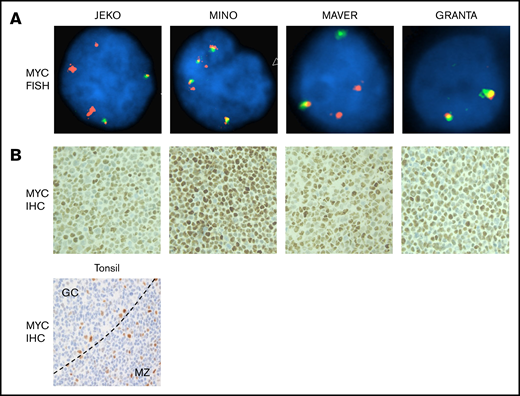
MYC DNA is structurally abnormal and MYC protein is overexpressed in MCL cells. (A) FISH was conducted using directly labeled dual-color break-apart Vysis MYC probes (5′ labeled in spectrum orange and 3′ in spectrum green), and images were captured using the Zeiss Axio Imager.Z2 Microscope with CytoVision Software. Magnification ×1000. (B) IHC staining in cell blocks from the 4 MCL cell lines and tonsil (bottom) as control. Moderately strong nuclear staining is seen in all 4 cell lines. In tonsil, most of small lymphoid cells including lymphocytes in mantle zone (MZ) and paracortical T-cell areas stain negative for MYC. Occasional large proliferative cells stain positive and are scattered within or outside the germinal centers (GC). The pattern is expected and shows specificity of the MYC immune stain. The dotted line denotes the border between the GC and the MZ. Magnification ×200.
MYC DNA is structurally abnormal and MYC protein is overexpressed in MCL cells. (A) FISH was conducted using directly labeled dual-color break-apart Vysis MYC probes (5′ labeled in spectrum orange and 3′ in spectrum green), and images were captured using the Zeiss Axio Imager.Z2 Microscope with CytoVision Software. Magnification ×1000. (B) IHC staining in cell blocks from the 4 MCL cell lines and tonsil (bottom) as control. Moderately strong nuclear staining is seen in all 4 cell lines. In tonsil, most of small lymphoid cells including lymphocytes in mantle zone (MZ) and paracortical T-cell areas stain negative for MYC. Occasional large proliferative cells stain positive and are scattered within or outside the germinal centers (GC). The pattern is expected and shows specificity of the MYC immune stain. The dotted line denotes the border between the GC and the MZ. Magnification ×200.
MYC knock-down inhibits cell growth: MYC, a bona fide client of HSP90 chaperon, is overexpressed in samples from patients with MCL
To demonstrate that MYC is directly involved in MCL tumor growth, we then reduced the amount of MYC by transfecting MCL cells with short interference RNA against MYC (siMYC). Shown by immunoblotting, siMYC effectively reduced the abundance of MYC protein in all 4 MCL cell lines (Figure 3A and quantified in Figure 3B). MYC reduction subsequently resulted in significantly slower cell growth in both ibr-sensitive (JEKO and MINO) and ibr-resistant (MAVER and GRANTA) cell lines (Figure 3C). These results support the notion that MYC is vital for MCL and suggest that targeting MYC in MCL may be more effective than targeting BTK with ibrutinib.

MYC knock-down inhibits cell growth: MYC, a bona fide client of HSP90 chaperon, is overexpressed in MCL patient samples. (A) Immunoblot showing reduction in MYC expression 4 days after transfection with siMYC or control (CTRL, pmaxGFP Vector provided by Amaxa) in MCL cell lines. GAPDH, loading control. (B) MYC protein levels determined by immunoblotting in panel A were quantified and normalized to GAPDH. (C) Growth of siMYC or GFP-transfected MCL cells over the course of 8 days postnucleofection. (D) Immunoblot of MYC in MCL whole-cell lysates (lane1s), chemical precipitates with PU-H71-conjugated beads (lane 2s), immunoprecipitates with anti-HSP90-conjugated beads (lane 3s) or control beads (lane 4s). GAPDH, loading control. (E) Immunoblot of HSP90 in primary MCL cells (Pt 1-11, n = 11), in normal B cells from 5 healthy donors (N1-N5), or from MCL cell lines. b-actin, loading control. (F) Levels of HSP90 protein in each groups shown in panel B were quantified and normalized to b-actin. One-way analysis of variance was used for statistical analysis. Bars represent means ± standard error of the mean. P values are indicated.
MYC knock-down inhibits cell growth: MYC, a bona fide client of HSP90 chaperon, is overexpressed in MCL patient samples. (A) Immunoblot showing reduction in MYC expression 4 days after transfection with siMYC or control (CTRL, pmaxGFP Vector provided by Amaxa) in MCL cell lines. GAPDH, loading control. (B) MYC protein levels determined by immunoblotting in panel A were quantified and normalized to GAPDH. (C) Growth of siMYC or GFP-transfected MCL cells over the course of 8 days postnucleofection. (D) Immunoblot of MYC in MCL whole-cell lysates (lane1s), chemical precipitates with PU-H71-conjugated beads (lane 2s), immunoprecipitates with anti-HSP90-conjugated beads (lane 3s) or control beads (lane 4s). GAPDH, loading control. (E) Immunoblot of HSP90 in primary MCL cells (Pt 1-11, n = 11), in normal B cells from 5 healthy donors (N1-N5), or from MCL cell lines. b-actin, loading control. (F) Levels of HSP90 protein in each groups shown in panel B were quantified and normalized to b-actin. One-way analysis of variance was used for statistical analysis. Bars represent means ± standard error of the mean. P values are indicated.
We then set out to test the hypothesis that pharmacologically targeting MYC would produce antitumor effects. However, there are no drugs currently available that specifically target MYC, a DNA-binding transcriptional factor. Nonetheless, the oncoprotein is a known client protein chaperoned by HSP90,39 which prevents its proteolytic degradation.40-42
We next explored whether MYC is a client protein of HSP90 in the cellular context of MCL. To demonstrate that MYC is physically associated with HSP90 chaperon, we performed both immunoprecipitation using anti-HSP90 and chemical precipitation using PU-H71-conjugated beads. PU-H71 is an HSP90 inhibitor that binds specifically to the tumor-enriched form of HSP90.19,43 In Figure 3D, we demonstrate that in all 4 MCL cell lines, MYC was present in whole-cell lysates (lane 1s) in complex with drug-bound tumor-enriched HSP90 (lane 2s) and HSP90 per se (lane 3s). Meanwhile, MYC protein was absent in the precipitates pulled down with the control agarose beads (lane 4s). Interestingly, HSP90 is overexpressed in primary MCL samples as well as MCL cell lines compared with normal B cells (Figure 3E and quantified in Figure 3F). These findings demonstrate that MYC is a bona fide client protein in MCL, and the overexpression of HSP90 explains, in part, why MYC is highly expressed in MCL (Figure 2B). The results further suggest that MYC may be targeted through HSP90 inhibition.
PU-H71 inhibits cell growth, induces apoptosis and cell cycle arrest in both ibr-sensitive and ibr-resistant MCL cells
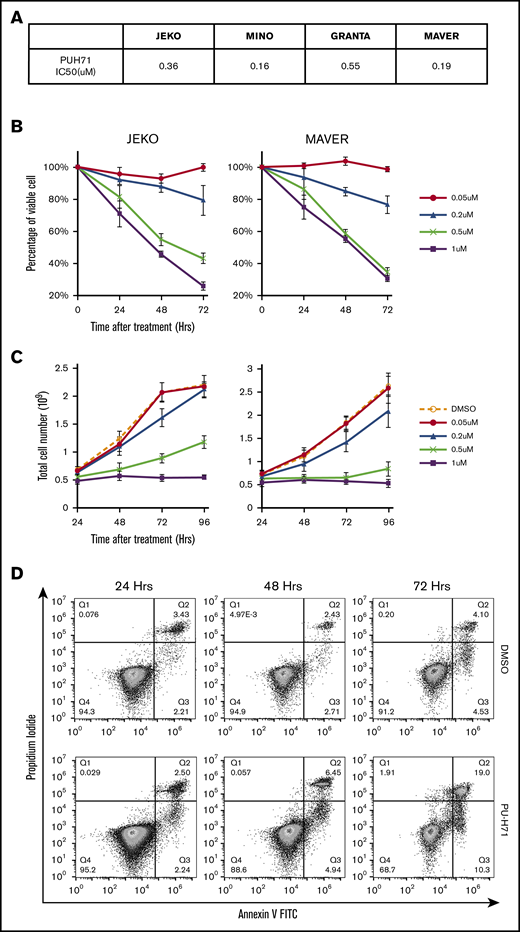
We next evaluated the effects of HSP90 inhibition in both ibr-sensitive (JEKO and MINO) and ibr-resistant (MAVER and GRANTA) MCL cell lines, using the HSP90 inhibitor PU-H71. An MTT dose-response assay was first performed, which showed that all 4 MCL cell lines were sensitive to PU-H71 with 50% infective dose ranging from 0.16 to 0.55 μM (Figure 4A). This range of concentrations is well below intratumor concentrations measured clinically in patients’ tumors (0.5-8 μM at 24 hours after a single dose of PU-H71).44 Both cell viability (Figure 4B) and cell growth (Figure 4C) were effectively inhibited by PU-H71 in a dose- and time-dependent fashion not only in ibr-sensitive JEKO and MINO cells but also in ibr-resistant MAVER and GRANTA cells (also see supplemental Figure 3). Inhibition of cell growth in MCL cells (Figure 4C; supplemental Figure 3B) was a combinatorial result of both apoptosis induction (Figure 4D-E) and cell cycle deceleration (Figure 4F-G), as evidenced by increased annexin-V/PI double-positive populations (Figure 4D), and decreased S-phase fraction (Figure 4G). Overall, our results demonstrate that HSP90 inhibition can overcome intrinsic ibr resistance in MCL, presumably through suppression of MYC.
PU-H71 inhibits cell growth, induces apoptosis and caused cell cycle arrest in both ibr-sensitive and ibr-resistant MCL cells. (A) Table summarizing 50% infective dose of PU-H71 in 4 MCL cell lines. Cells were treated with various concentrations of PU-H71 for 72 hours. (B) Time course of cell viability of JEKO and MAVER cells treated with indicated doses of PU-H71 normalized to time 0 and DMSO control. (C) Time course of cell growth of JEKO and MAVER cells treated with indicated doses of PU-H71. Cell numbers were counted with Muse Cell Analyzer. (D) Apoptosis measured by PI/annexin V double staining in JEKO cells treated with either DMSO (top) or 0.5 µM PU-H71 (lower) for 24 to 72 hours. (E) Apoptotic cell death in JEKO and MAVER cells 24 to 48 hours after PU-H71 treatment. (F) Changes in cell cycle distribution measured by DNA content in JEKO and MAVER cells after 0.5 µM PU-H71 treatment of 24 to 72 hours. (G) Bar graphs showing cell cycle distribution of JEKO and MAVER cells post-72-hour treatment with increasing concentrations of PU-H71.

MYC and MYC-controlled genes are effectively targeted by HSP90 inhibition through PU-H71
To demonstrate that HSP90 inhibition of MCL is mediated through MYC downregulation, we exposed the ibr-resistant MAVER cells to PU-H71, ibr, or DMSO. We then analyzed the subsequent changes in the MYC gene expression profile, using RNA-Seq. As shown in Figure 5, the MYC gene signature in MAVER was significantly downregulated by PU-H71 compared with DMSO or ibrutinib (Figure 5A-B; P < .0001 and FDR, 0.10).

MYC and MYC-controlled genes are effectively targeted by HSP90 inhibition through PU-H71. (A) GSEA enrichment analyses show MYC gene signature was downregulated by 0.5 µM PU-H71 treatment in ibrutinib-resistant MAVER cells. FDR and P values are indicated. (B) Heat map representation of top-ranked MYC signature genes that are downregulated by PU-H71 in comparison with DMSO or ibrutinib. Biological triplicate experiments, represented by 3 columns for each condition, were shown. (C) Summary of the transcriptomic response of JEKO and MAVER cells to ibrutinib and PU-H71 across multiple oncogenic gene signatures. (D) Protein levels of MYC in 4 MCL cell lines were also downregulated at 24 hours by increasing concentrations of PU-H71. GAPDH, loading control. (E) 50% infective dose values of PU-H71 is significantly decreased (P < .05) in 4 MCL cell lines after MYC knock down. One-way analysis of variance test was used for statistical analysis.
MYC and MYC-controlled genes are effectively targeted by HSP90 inhibition through PU-H71. (A) GSEA enrichment analyses show MYC gene signature was downregulated by 0.5 µM PU-H71 treatment in ibrutinib-resistant MAVER cells. FDR and P values are indicated. (B) Heat map representation of top-ranked MYC signature genes that are downregulated by PU-H71 in comparison with DMSO or ibrutinib. Biological triplicate experiments, represented by 3 columns for each condition, were shown. (C) Summary of the transcriptomic response of JEKO and MAVER cells to ibrutinib and PU-H71 across multiple oncogenic gene signatures. (D) Protein levels of MYC in 4 MCL cell lines were also downregulated at 24 hours by increasing concentrations of PU-H71. GAPDH, loading control. (E) 50% infective dose values of PU-H71 is significantly decreased (P < .05) in 4 MCL cell lines after MYC knock down. One-way analysis of variance test was used for statistical analysis.
Downregulation of MYC signature by PU-H71 treatment is relatively specific. In addition to MYC, we analyzed several other oncogenic pathways in the sensitive JEKO and resistant MAVER cells in response to ibr or PU-H71. The enrichment plots and heat maps are shown in supplemental Figure 2A-G, and the result summary in Figure 5C. Among MYC, BCR, NF-κB, non-canonical NF-κB, PI3K, RAS, and STAT3 pathways,13,32 MYC is the only signature (Figure 5C, row MYC) that is downregulated by ibr in JEKO, unchanged by ibr in MAVER, and downregulated by PU-H71 in MAVER (Figure 5C). With the exception of MYC, all other pathways showed no response or even upregulation to PU-H71 in MAVER (Figure 5C, third and fourth columns, gray or red). These data together support the notion that cellular sensitivity to PU-H71 is mainly mediated through MYC downregulation.
In addition to MYC-controlled gene expression, PU-H71 also decreased the abundance of MYC, at the protein level in all 4 cell lines in a dose-dependent fashion, corroborating the transcriptional findings by RNA-seq (Figure 5D). Thus, our data demonstrate that HSP90 inhibition through PU-H71 reduces the abundance of MYC and MYC-controlled gene expression.
If PU-H71 reduces the amount of MYC, then MYC depletion would further increase the sensitivity of cells to PU-H71 treatment. To test this hypothesis, we exposed cells with or without MYC siRNA (Figure 3A) to the inhibitor. Figure 5E shows that in all lines tested, cells became more sensitive to PU-H71 treatment when MYC is reduced. These data further strengthen the notion that MYC mediates the effects of PU-H71, and MYC inhibition can be achieved using the HSP90 inhibitor.
PU-H71 retards tumor growth in a MCL PDX model
To examine whether PU-H71 exhibits anti-MCL effects in vivo, we applied the drug in a MCL PDX model in comparison with ibrutinib and vehicle. Five mice were placed in each of the 3 treatment groups (see “Materials and methods”). As shown in Figure 6A, single-agent PU-H71 at 75 mg/kg inhibited tumor growth more effectively than ibr at 50 mg/kg, as demonstrated by the tumor volume (n = 5; PU-H71 vs ibr, P < .0001). There was no observed difference in body weight or condition between mice treated with PU-H71 and vehicle. In addition, PU-H71 significantly prolonged the survival of mice compared with vehicle control, but not compared with ibr (Figure 7B; n = 5, PU-H71 vs vehicle, P < .0001; PU-H71 vs ibr, P = .088).

PU-H71 inhibits tumor growth in MCL PDX models. (A) Tumor volume was measured weekly (length × width2 × 0.5) after animals were treated with control, PU-H71 (75 mg/kg, intraperitoneal injection), and ibrutinib (50 mg/kg, oral daily) on days 0, 7, 14, and 21 after treatment initiation. *P < .0001 (B) Survival curve analyzed with Graphpad Prism 6.0 software.
PU-H71 inhibits tumor growth in MCL PDX models. (A) Tumor volume was measured weekly (length × width2 × 0.5) after animals were treated with control, PU-H71 (75 mg/kg, intraperitoneal injection), and ibrutinib (50 mg/kg, oral daily) on days 0, 7, 14, and 21 after treatment initiation. *P < .0001 (B) Survival curve analyzed with Graphpad Prism 6.0 software.
PU-H71 induces apoptosis in primary MCL cells. (A) Apoptosis measured by PI/annexin V double staining after 0.5 μM PU-H71 treatment in a representative tumor sample. (B) Line graphs showing increased apoptosis in 10 MCL tumor samples after 24 to 48 hours of PU-H71 treatment at 0.5 μM. (C) Line graph showing decreased cell viability in 6 additional MCL tumor samples after 24 and 48 hours of PU-H71 treatment. Student t test was used for statistical analysis for panels B-C. (D) Immunoblot showing reduced MYC expression after PU-H71 treatment for 24 hours in the 6 samples from panel C. (E) MYC protein levels determined by immunoblotting in panel D were quantified and normalized to GAPDH.
PU-H71 induces apoptosis in primary MCL cells. (A) Apoptosis measured by PI/annexin V double staining after 0.5 μM PU-H71 treatment in a representative tumor sample. (B) Line graphs showing increased apoptosis in 10 MCL tumor samples after 24 to 48 hours of PU-H71 treatment at 0.5 μM. (C) Line graph showing decreased cell viability in 6 additional MCL tumor samples after 24 and 48 hours of PU-H71 treatment. Student t test was used for statistical analysis for panels B-C. (D) Immunoblot showing reduced MYC expression after PU-H71 treatment for 24 hours in the 6 samples from panel C. (E) MYC protein levels determined by immunoblotting in panel D were quantified and normalized to GAPDH.
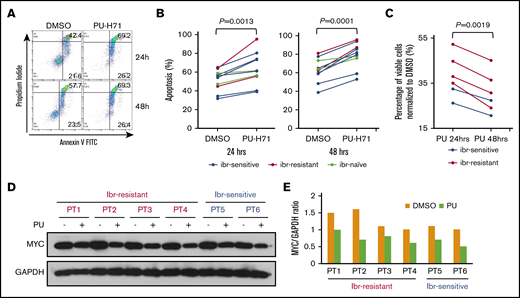
PU-H71 induces apoptosis and downregulates MYC in primary MCL cells from ibr-resistant patients
We then tested whether the inhibitory effects of PU-H71 in MCL cell lines and PDX models can be recapitulated in patient-derived primary MCL cells. We first treated 10 patient samples with or without PU-H71. Figure 7A showed that PU-H71 induced apoptotic cell death at 24 and 48 hours after the drug treatment in a patient sample. The aggregate data for all 10 patient samples at both points are shown in Figure 7B. Although there were patient-to-patient variations, increased apoptosis was apparent in all patients. Of these 10 patients, 2 patients were not exposed to ibr treatment clinically (Figure 7B, gray). Of the remaining 8 primary samples, 6 were from ibrutinib-sensitive patients (Figure 7B, blue), and the other 2 were from patients who had up-front clinical resistance to ibr (red). Notably, apoptosis can be induced by PU-H71, even in these 2 ibr-resistant patients.
To corroborate these findings, we tested the effect of PU-H71 on cell viability, using a separate cohort of 6 MCL samples that contained sufficient numbers of cells for additional immunoblot analyses. Figure 7C shows that PU-H71 markedly reduced cell viability in all 6 samples, including 4 ibr-resistant ones. Immunoblot analysis demonstrated in all 6 samples that reduction of MYC protein levels occurred when cells were exposed to PU-H71 (Figure 7D-E). Taking these results together with the cell line and animal studies, we conclude that PU-H71 inhibits both ibr-sensitive and ibr-resistant MCL through downregulation of MYC and MYC-controlled transcriptional program.
Discussion
Ibrutinib has shown promising results in treating various B-cell malignancies, including MCL. However drug resistance remains a major obstacle. Several mechanisms have been implicated in MCL primary resistance, including the activation of alternative NF-κB and PI3K-AKT-mTOR signaling pathways.11-14 In this study, we first used RNA sequencing and GSEA to identify that MYC pathway may also play an important role in primary ibr resistance. We further showed with FISH and IHC that MYC is overexpressed in the majority of the MCL cell lines and MYC knockdown attenuated cell growth. These results suggest that at least some MCL cells are addicted to MYC for growth and survival. To explore the therapeutic potential of reducing MYC activity via HSP90 inhibition, we demonstrated that MYC protein is a bona fide HSP90 client that could be pulled down by either anti-HSP90- or PU-H71-conjugated beads. We demonstrated that the chaperon is overexpressed in primary MCL tumor cells and MCL cell lines compared with normal B cells. By inhibiting HSP90 using PU-H71, we showed that MYC signature was effectively suppressed and accompanied with induction of apoptosis and cell cycle arrest even in ibr-resistant MCL cells. Comparing responses of several known oncogenic pathways to ibr and to PU-H71, we demonstrated that downregulation of MYC gene signature by PU-H71 was relatively specific. Moreover, MYC protein levels were reduced by PU-H71, and depletion of MYC with siRNA further sensitized cells to PU-H71’s toxicity. We next demonstrated that PU-H71 retards tumor growth in the in vivo setting in a MCL PDX model. Last, we demonstrated that PU-H71 also induced apoptosis and downregulated MYC in primary human MCL cells, including those resistant to ibr, providing evidence for its potential application in a clinical setting.
MYC is a known oncogenic driver in lymphomagenesis, and dysregulation of the oncogene is a central event in aggressive lymphomas including diffuse large B-cell lymphoma and Burkitt lymphoma.45 In mantle cell lymphoma, although chromosomal translocation involving MYC is uncommon, intermediate and high expression of the MYC protein is seen in up to 55% of 234 primary MCL samples, and MYC activity is upregulated through BCR pathway via MALT1.38 In addition, MYC overexpression or amplification through IHC or FISH analyses has been found to predict poor survival in patients.46-48 The published studies, together with the current investigation, demonstrate that MYC oncoprotein plays an important role in the pathogenesis of MCL.
The role of MYC in ibr resistance was also addressed by others in a different setting. Moyo et al recently reported that MYC-overexpression in premalignant B cells confers ibr resistance through enhanced BCR signaling.49 However, Moyo et al used an Eu-MYC mouse model to demonstrate the effect of MYC overexpression in precancerous B lymphocytes. Our study reinforced the findings of Moyo et al and showed evidence that MYC-driven ibr resistance is also relevant in the context of human lymphomas.
HSP90 inhibition is known to destabilize MYC in many cancer cell types.40-42 We demonstrated that MYC is a bona fide client of HSP90 in MCL, and HSP90 inhibition via knock-down or PU-H71 impairs MCL cellular growth. This rationalizes the use of HSP90 inhibitor in treating primary ibr-resistant MCL. Recently, Jacobson et al also demonstrated that HSP90 inhibitors could overcome ibr resistance in MCL.25 Intriguingly, using a proteomic approach on whole-cell lysates, they identified noncanonical NFκB, BCR signaling, JAK-STAT and DNA damage repair as the major pathways downregulated by HSP90 inhibitor AUY922, but the MYC program was not identified as 1 of the pathways targeted by HSP90 inhibition. The difference between our study and that of Jacobson et al may stem from a different compound and methodology used. First, Jacobson et al used AUY922, a structurally different HSP90 inhibitor, to treat MCL cell lines. Although both drugs bind and inhibit HSP90, PU-H71 has been shown to bind specifically to the oncogenic form of HSP90,50,51 whereas AUY922 may be less tumor specific.52 Second, the approaches are different between the 2 studies. Jacobson et al employed an agnostic mass spectrometry-based proteomic approach on whole cell extracts to interrogate 7000 proteins. Ingenuity Pathway Analysis software was then applied to identify statistically significant signaling pathways. We, in contrast, examined pathways using RNA sequencing and GSEA of 22 000 genes. Because GSEA considers all gene expression data points, the analysis has higher sensitivity, but also higher risk for generating false-positive findings. We first identified that the MYC program was downregulated in ibr-sensitive cells and unaltered in ibr-resistant cells. For validation, we used both chemical precipitation and immunoprecipitation to demonstrate that MYC is, indeed, an authentic client of HSP90’s (Figure 3D). Further, the significant role of MYC in mediating PU-H71 toxicity was validated through MYC knock-down experiments (Figure 3C), multipathway analyses (Figure 5C), and MYC protein analyses in both cell lines and primary samples (Figures 5D and 7D). Collectively, these results provide strong evidence that PU-H71 produces anti-MCL activities through downregulation of MYC. The potential therapeutic application of PU-H71 was further strengthened with both animal studies and studies with MCL primary samples, including those from patients with upfront resistance to ibr.
With several lines of evidence, we still cannot rule out the possibility that other HSP90 client proteins are also important drivers in ibr-resistant MCL. The MYC program contributes but may not be the sole mechanism of ibr-resistance. HSP90 inhibition may affect the abundance of many other oncogenic drivers in addition to MYC. We addressed this question by performing multipathway analyses that showed downregulation of the MYC gene signature was a relatively specific response to PU-H71 inhibition. Further investigation will be required to determine whether other HSP90 oncogenic clients not tested here also play a role. Regardless, our results highlight MYC as an important therapeutic target and support the development of HSP90 inhibitors in treating MCL, in particular, to overcome intrinsic ibr resistance.
Acknowledgment
The study is partially funded by a Leukemia and Lymphoma Society grant (Y.L.W.).
Authorship
Contribution: Y.L.W. formed the hypothesis and directed the project; J.L., L.L.Z., W.W., H.G., M.S., G.V., S.H., H.Z., P.L., A.G., and N.G. developed the assays, designed and performed the experiments, solved technical problems, and analyzed the data; M.A. participated in IHC review and data presentation; L.L.Z., M.S., G.V., and M.L.W. contributed useful patient materials and patient pathological and treatment information; L.L.Z. and M.L.W. designed and performed the PDX study; Y.L. and J.A. performed bioinformatics analyses on the RNA-Seq data; J.L. L.L.Z., P.L., and J.A. participated in the manuscript writing; and Y.L.W. directed and coordinated the project, designed the experiments, analyzed the data, and wrote the manuscript.
Conflict-of-interest disclosure: The authors declare no competing financial interests.
Correspondence: Y. Lynn Wang, Lymphoma Translational Pathology, Department of Pathology, University of Chicago, 5841 S. Maryland Ave, Chicago, IL 60637; e-mail: ylwang@bsd.uchicago.edu.

