Key Points
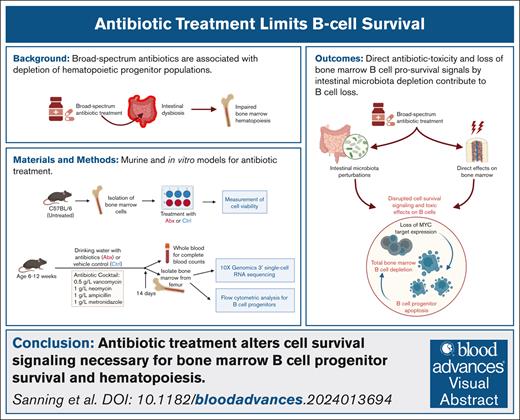
A substantial depletion of bone marrow B-cell progenitor populations occurs after long-term, broad-spectrum antibiotic therapy.
Direct antibiotic toxicity and loss of bone marrow B-cell prosurvival signals by intestinal microbiota depletion contribute to B-cell loss.
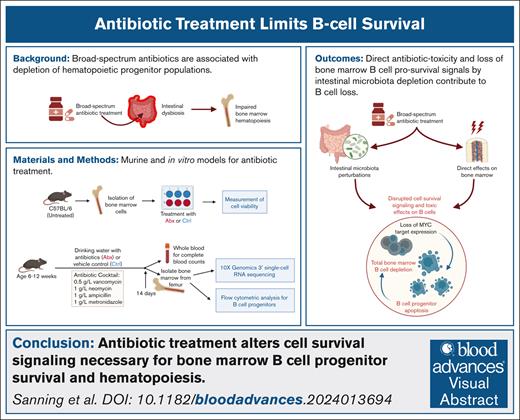
Visual Abstract
Prolonged or broad-spectrum antibiotic courses are associated with intestinal dysbiosis and cytopenias, and depletion of hematopoietic progenitor populations after antibiotics is associated with loss of peripheral immune cells, leading to increased susceptibility to systemic infections. We evaluated the bone marrow hematopoietic compartment in a murine model of antibiotic exposure. Single-cell RNA sequencing revealed a substantial and previously unrecognized depletion of bone marrow B cells at all stages of development in antibiotic-treated mice, further confirmed by flow cytometric analysis. Depletion of the microbiota was associated with rapid changes in the peripheral B-cell compartment, yet fecal microbiota transfer did not rescue either peripheral or bone marrow B cells to a greater degree than natural recovery from antibiotic treatment. Antibiotic-mediated loss of B-cell progenitors was secondary to enhanced apoptosis and occurred independent of disrupted systemic type I and II interferon signaling, previously implicated in the maintenance of other hematopoietic compartments. Instead, the depletion of prosurvival MYC signaling was implicated in the depletion of circulating lymphocytes and bone marrow B-cell progenitor populations during antibiotic treatment. Furthermore, in vitro exposure of bone marrow cells to antibiotics demonstrated significantly decreased viability of B cells. We conclude that both microbiota depletion and cytotoxic effects of prolonged broad-spectrum antibiotic treatment disrupt cytokine and cell survival signaling critical for B-cell progenitor maintenance. These results contribute to our understanding of the compartment-specific mechanisms by which the microbiota maintains the hematopoietic system and suggest critical pathways for maintenance of bone marrow progenitors during prolonged antibiotic treatment.
Introduction
Optimization of antimicrobial use is critical to improving infection cure rates, preventing the spread of resistant pathogens, and minimizing harm.1 Prolonged or broad-spectrum antibiotic (Abx) courses are associated with intestinal dysbiosis and cytopenias,2 and Abx-associated bone marrow (BM) suppression can occur after administration of many Abx classes, including β-lactams,3 such as cephalosporins,4,5 and linezolid.6,7 Although cytopenias were once thought to be a byproduct of direct Abx-mediated hematopoietic cell cytotoxicity, recent studies also support a critical role for gut microbes, which are altered by Abx treatment, in promoting healthy steady-state hematopoiesis.8-14
In murine models, intestinal dysbiosis by Abx exposure dramatically modulates hematopoiesis, affecting differentiation of hematopoietic lineages at both primitive and mature stages.8,9,12,15 Depletion of hematopoietic progenitor populations after antibiotics is associated with loss of peripheral immune cells, leading to increased susceptibility to systemic infections.8,9 Antibiotic treatment of mice thus recapitulates the adverse effects observed in human patients exposed to long-term Abx courses, providing a useful model for interrogating mechanisms contributing to altered hematopoiesis during Abx exposure.9,12,16
Here, we sought to better understand the effects of broad-spectrum Abx administration on BM hematopoietic cells. We used single-cell RNA sequencing (scRNAseq) and flow cytometric analyses of murine BM cells after Abx treatment to discover widespread loss of BM B cells at multiple stages of differentiation, as early as 7 days after the start of Abx treatment. Although we have previously reported depletion of BM common lymphoid progenitors (CLPs) and peripheral B cells after exposure to 14 days of antibiotics,12 the loss of other BM B-cell progenitor populations during Abx treatment has, to our knowledge, not been identified previously. This loss was associated with enhanced cell death of B-cell progenitors, implicating the microbiota as critical to supporting the survival of these B-cell populations but also revealing a role for direct Abx-mediated toxicity. Our studies indicate that a combination of direct effects of antibiotics on B cells, and loss of microbiota-maintained c-MYC signaling but not type I or II interferon (IFN) signaling, limits the survival of these progenitor populations.
Materials and methods
Mouse lines
Experiments were conducted using 6- to 12-week-old mice in accordance with protocols approved by the respective institutional animal care and use committees at Washington University in St. Louis (WUSTL; 20190162, 22-0140) and Baylor College of Medicine (AN-4802).
Wild-type (WT) C57BL/6J mice were originally purchased from The Jackson Laboratory (JAX stock no. 000664) and bred and housed in specific-pathogen–free (SPF) animal facilities at WUSTL and Baylor College of Medicine. Knockout mice on the C57BL/6J background were maintained in the same conditions and included the following strains: Ifnar1−/−,17Ifngr1−/− (JAX stock no. 003288),18 and Stat1−/− (JAX stock no. 012606). Ifnar1−/−Ifngr1−/− were generated by crossing Ifnar1−/− and Ifngr1−/− mice. Germ-free (GF) WT mice were bred and maintained at the WUSTL Gnotobiotic Core Facility. Experiments used equal numbers of male and female mice, as well as littermate controls (Ctrls) when available.
Antibiotic treatment
For Abx treatment experiments, mice were administered either a vehicle Ctrl of Kool-Aid (grape-flavored Kool-Aid drink, 20 g/L; Kraft Foods Global, Inc) or an Abx cocktail of VNAM (vancomycin [0.5 g/L], neomycin [1 g/L], ampicillin [1 g/L], and metronidazole [1 g/L; Sigma]) in Kool-Aid in drinking water. Animals were treated for 2 to 30 days. Throughout Abx administration, mice were supplemented with HydroGel (ClearH2O) or Nutragel (Bio-Serv) as needed for hydration.
scRNAseq and analysis
After 14 days of Abx or vehicle treatment, mice were euthanized, and hind legs were collected. Femurs were isolated and placed in a perforated 0.65-mL microcentrifuge tube within a 1.5-mL microcentrifuge tube for marrow removal by centrifugation at room temperature. After red blood cell (RBC) lysis using ammonium-chloride-potassium lysis buffer (Gibco), samples were spun and resuspended in phosphate-buffered saline (PBS) with 0.04% bovine serum albumin (BSA). Cell concentration was determined using the TC20 Automated Cell Counter (Bio-Rad). Cells were resuspended in PBS with 0.04% BSA at a concentration of 1000 cells per μL, and 100 μL of this solution was provided to the Genome Technology Access Center at the WUSTL McDonnell Genome Institute for 10x Genomics 3′ version 3.1 scRNAseq, according to the manufacturer’s instructions, using the NovaSeq S4 (Illumina).
Demultiplexed reads were processed using Cell Ranger (10x Genomics) and aligned against the Mus musculus reference genome (GRCm39/mm39). Cell Ranger output files were then imported into R and further analyzed using the package “Seurat,” version 4.19,20 Low-quality cells with high or low numbers of observed genes (>5000 or <300, respectively), or high proportions of mitochondrial genes (>10%), were filtered out, leaving ∼37 000 cells of the original 58 000 from the 6 samples. Expression was normalized, and variable features identified following standard protocols. Clusters were identified using principal components 1 to 50, with a resolution of 1.8. Cellular identities of clusters were defined by comparison to 2 databases: bulk RNAseq data from sorted murine BM populations in Haemosphere21 and scRNAseq data from Tabula Muris, detailed in the supplemental Methods.22,23
CBCs
Mice were bled on the indicated days by submandibular bleed into EDTA-coated Microtainer blood collection tubes (BD Biosciences). Complete blood cell counts (CBCs) were acquired with an Element HT5 veterinary hematology analyzer (Heska).
Flow cytometry
Whole BM samples were isolated as for scRNAseq; and after RBC lysis, samples were resuspended in flow buffer (0.1% BSA, 2 mM EDTA in PBS) and filtered through a 70-μm filter (Fisher Scientific). Cell counts were acquired using the TC20 Automated Cell Counter (Bio-Rad). B-cell progenitors were defined as CLPs (lineage− [Lin−; B220−; CD3e−, Ter-119−, Gr-1−], CD27+, Flk2+, CD127+, Ly-6D+); pre–pro-B cells (CD11b−, NK1.1−, B220+, immunoglobulin M–negative [IgM−], CD19−, CD43+); pro–B cells (CD11b−, NK1.1−, B220+, IgM−, CD19+, CD43+); pre–B cells (CD11b–, NK1.1−, B220+, IgM−, CD19+, CD43low); immature B cells (CD11b−, NK1.1−, B220low, IgMhigh); and mature B cells (CD11b−, NK1.1−, B220high, IgMhigh; supplemental Tables 1-4), using established gating methods (supplemental Figure 2A-E).24,25
For splenic cell isolation, fresh whole mouse spleens were collected and pressed through a 70-μm filter. After incubation in RBC lysis buffer for 5 minutes, cells were washed with cold flow buffer, spun, and resuspended in flow buffer for cell surface staining of B220, Gr-1, and CD3e to broadly identify B cells, myeloid cells, and T cells, respectively (supplemental Table 5; supplemental Figure 2F). All flow cytometry was performed on an LSR Fortessa (BD Biosciences) or Canto (BD Biosciences). Data analysis was performed using FlowJo 10 (BD Biosciences).
Proliferation and apoptosis flow cytometry assays
Cell proliferation was assessed using bromodeoxyuridine (BrdU) incorporation. We injected 100 μL of BrdU solution (10 mg/mL) intraperitoneally into mice 24 hours before euthanasia for collection of BM cells. After RBC lysis and cell surface staining, cells were assessed for BrdU incorporation using the BD Pharmingen allophycocyanin BrdU flow kit (BD Pharmingen), according to the manufacturer’s instructions (supplemental Table 2).
Apoptosis was assessed with the allophycocyanin-conjugated annexin V staining kit (ThermoFisher Scientific) and live/dead staining using DAPI (4′,6-diamidino-2-phenylindole; supplemental Table 3). Apoptosis was validated by measuring activated polycaspases using the Vybrant FAM (carboxyfluorescein)–FLICA (fluorochrome-labeled inhibitors of caspases) caspase apoptosis assay kit (ThermoFisher), according to the manufacturer’s instructions. Extracellular staining was performed on whole BM cells followed by incubation with FLICA solution at 37°C protected from light for 1 hour with live/dead staining using propidium iodide (supplemental Table 4). After each assay, cells were immediately analyzed for the FAM reporter.
16S rRNA qPCR
Fecal pellets were collected and stored at −80°C. DNA was extracted using an established phenol-chloroform–based bead-beating method.26 SYBR green quantitative polymerase chain reaction (qPCR) was performed using the QuantStudio3 (ThermoFisher) with 515F (5ʹ-GTGCCAGCMGCCGCGGTAA-3ʹ) and 805R (5ʹ-GACTACCAGGGTATCTAATCC-3ʹ) primers to detect the V4 hypervariable region of the 16S ribosomal RNA (rRNA) gene. A plasmid containing the 16S rRNA gene from Blautia was used as a standard.
B-cell viability assays
BM cells were isolated as described earlier from WT mice for RBC lysis. For B220+ B-cell–specific assays, B-cell enrichment was first performed using anti-CD45R (B220)–conjugated microbeads and LS columns on a MACS separator (Miltenyi Biotec). Enriched B220+ B cells pooled from 3 mice were cultured in RPMI 1640 with L-glutamine supplemented with 2% heat-inactivated fetal bovine serum, and 1% HEPES (N-2-hydroxyethylpiperazine-N′-2-ethanesulfonic acid [RPMI+]) with 100 ng/mL recombinant mouse CD40-L (rCD40-L; BioLegend) and 2 ng/mL recombinant mouse interleukin-4 (rIL-4; BioLegend). For 10058-F4 (Sellekchem) treatment, a 10 mM stock solution was prepared by dissolving 10058-F4 in 100% dimethyl sulfoxide. Enriched B220+ BM cells (1 × 10⁵) in RPMI+ with rCD40-L and rIL-4 were seeded in a 96-well plate and exposed to the indicated concentrations of 10058-F4. After 4 hours at 37°C, 5% CO2, cells were collected and analyzed by acridine orange/propidium iodide (AO/PI) staining.
For analysis of whole BM exposure to antibiotics in vitro, BM cells were isolated as described earlier and pooled from 5 mice. Whole BM cells (1 × 10⁶) were seeded in a 12-well plate in RPMI+ supplemented with 10 ng/mL rIL-7.27 Cells were cultured under Ctrl conditions (RPMI+ only); or in media containing either vancomycin (0.5 g/L), neomycin (1 g/L), ampicillin (1 g/L), or metronidazole (1 g/L); or a combination of all 4 Abx (VNAM). After culture for 18 hours at 37°C, 5% CO2, cells were collected and analyzed by flow cytometry for viability of CD11b−B220+ B-cell populations.
Cytokine assays
Whole blood was collected from mice exposed to Abx or Ctrl conditions for 4 weeks, and centrifuged for serum collection. Multiplexing analysis on serum samples was performed using the Luminex 200. Serum cytokines in each sample were measured simultaneously using Eve Technologies’ Mouse Cytokine 45-Plex Discovery Assay, according to the manufacturer’s protocol. Assay sensitivities of these markers range from 0.3 to 30.6 pg/mL. Individual analyte sensitivity values are available in the MilliporeSigma Milliplex Map protocol.
Statistical analysis
Statistical analyses were carried out using Prism version 10 (GraphPad Software, San Diego, CA) or R. Significance was determined by Mann-Whitney U test, 1-way analysis of variance, Kruskal-Wallis test, or 2-way analysis of variance, as specified in the relevant figure legends.
Results
scRNAseq of murine BM reveals depletion of B-cell progenitors after Abx treatment
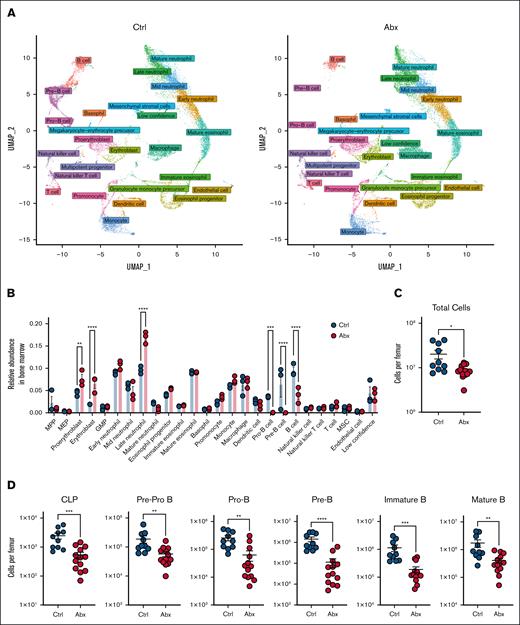
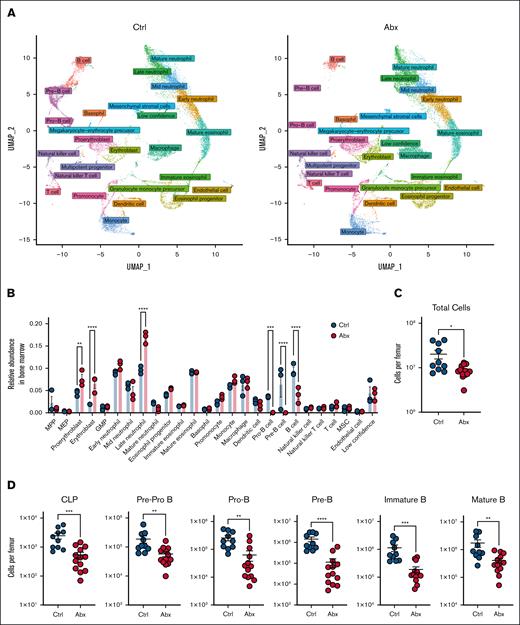
Having previously demonstrated the importance of the microbiota in promoting murine steady-state hematopoiesis,12,16 we sought to further characterize the compositional and transcriptional alterations to the BM compartment caused by Abx. WT mice (n = 3 per group) were treated with a cocktail of broad-spectrum Abx (VNAM) or Kool-Aid vehicle Ctrl in drinking water for 14 days. scRNAseq of whole BM cells was performed using the 10x Genomics platform. After processing to remove low-quality cells, 37 434 cells (4629-7244 cells per sample) remained for subsequent analyses. Clustering analysis revealed 50 distinct cell populations, which we identified by comparing marker genes for each cluster to published bulk RNAseq data from sorted murine BM cells from Haemosphere as well as integrating our data set with well-annotated murine BM scRNAseq data from the Tabula Muris consortium.21,22 Overall, 46 of 50 clusters were identified with high confidence, with no clear identification for the remaining 4 clusters, denoted as “low confidence” (Table 1). Identified clusters were divided into 26 separate general identity groupings, revealing several populations of granulocytes, B cells, erythrocytes, and monocytes, as well as their progenitors and smaller numbers of nonlymphoid populations (supplemental Figure 1A). We further defined these clusters as belonging to 1 of 13 lineages and found that these assignments aligned with uniform manifold approximation and projection visualization of these populations, in which clustering better approximates potential developmental trajectories, supporting our accurate identification of these cell types within our samples (Figure 1A).28
scRNAseq reveals a loss of BM B-cell progenitor populations after Abx administration. (A) UMAP visualization of scRNAseq data of ∼37 000 single cells combined from BM from mice treated for 14 days with the vehicle Ctrl or Abx cocktail in drinking water. Colors indicate general identity used for differentiating cell types, as labeled in the figure, demonstrating overall agreement between lineage identification and UMAP-based clustering. (B) Relative abundances of the cellular lineages observed from the scRNAseq data set. (C) Total murine BM cells per femur were counted on a hemocytometer in WT mice treated with Ctrl or Abx. (D) BM B-cell progenitor populations were quantified by flow cytometry in Ctrl- and Abx-treated WT mice. For panels A-D, statistical significance was determined by the Mann-Whitney U test. Data are displayed as mean ± standard error of the mean (SEM). ∗P ≤ .05; ∗∗P ≤ .01; ∗∗∗P ≤ .001; ∗∗∗∗P ≤ .0001. GMP, granulocyte-monocyte precursor; MEP, megakaryocytic-erythroid progenitor; MPP, multipotent progenitor; MSC, mesenchymal stromal cell; UMAP, uniform manifold approximation and projection.
scRNAseq reveals a loss of BM B-cell progenitor populations after Abx administration. (A) UMAP visualization of scRNAseq data of ∼37 000 single cells combined from BM from mice treated for 14 days with the vehicle Ctrl or Abx cocktail in drinking water. Colors indicate general identity used for differentiating cell types, as labeled in the figure, demonstrating overall agreement between lineage identification and UMAP-based clustering. (B) Relative abundances of the cellular lineages observed from the scRNAseq data set. (C) Total murine BM cells per femur were counted on a hemocytometer in WT mice treated with Ctrl or Abx. (D) BM B-cell progenitor populations were quantified by flow cytometry in Ctrl- and Abx-treated WT mice. For panels A-D, statistical significance was determined by the Mann-Whitney U test. Data are displayed as mean ± standard error of the mean (SEM). ∗P ≤ .05; ∗∗P ≤ .01; ∗∗∗P ≤ .001; ∗∗∗∗P ≤ .0001. GMP, granulocyte-monocyte precursor; MEP, megakaryocytic-erythroid progenitor; MPP, multipotent progenitor; MSC, mesenchymal stromal cell; UMAP, uniform manifold approximation and projection.
Next, we identified large-scale changes in specific clusters in Abx-treated animals relative to Ctrl, reflected in the overall alterations in lineage abundances (Figure 1B). The B-cell compartment had the largest fold-change decrease between Abx-treated and Ctrl animals among the cell lineages. Substantial loss of the pre-B and pro-B progenitors, as well as mature B-cell populations, was observed after Abx (Figure 1A-B). Modest increases were observed in the relative abundance of proerythroblast, erythroblast, and late neutrophil populations (Figure 1B).
To validate the dramatic alterations in B-cell progenitors observed in our scRNAseq data set, we performed flow cytometric analyses of BM B-cell populations using established gating methods24 on mice treated with 14 days of Abx or Ctrl. In congruence with previous work,12 we observed significant decreases in BM cellularity in Abx-treated mice (Figure 1C), as well as a significant and substantial loss of all examined B-cell progenitors (CLPs, pre–pro-B, pro–B, pre–B, and immature B cells) as well as mature B cells in Abx-treated mice (Figure 1D). Altogether, these data indicate that broad-spectrum Abx administration substantially diminishes the B-lymphopoietic compartment within murine BM.
Loss of peripheral circulating lymphocytes occurs rapidly after Abx administration
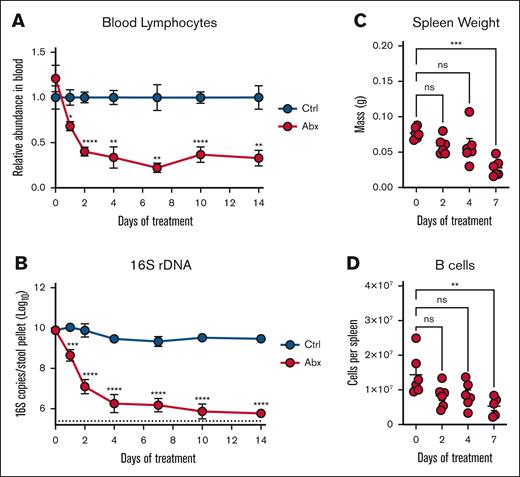
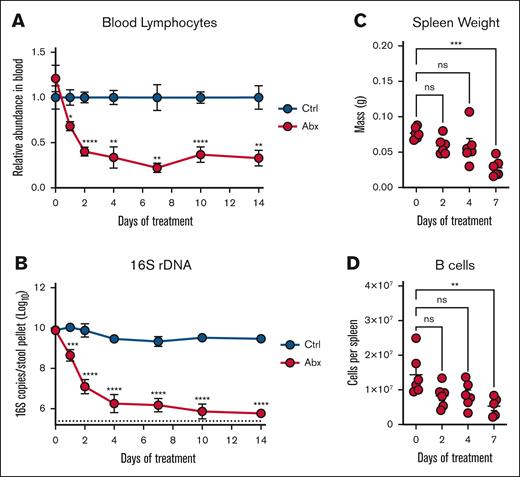
Our previous work showed a depletion of peripheral circulating white blood cells (WBCs) during Abx exposure driven by loss of B and T cells after 14 days of Abx treatment; next, we sought to evaluate the kinetics of this depletion.12 Longitudinal CBCs from Abx-treated and Ctrl animals revealed a significant and early decrease in relative (Figure 2A; supplemental Figure 1B) and absolute (supplemental Figure 1C) blood lymphocytes after Abx exposure with a dramatic and sustained loss through 14 days of treatment. The depletion of peripheral lymphocytes occurred concurrently with the decreased abundance of fecal microbes as determined by 16S rRNA gene qPCR (Figure 2B). A sustained decrease in serum hematocrit as a measure of dehydration from animal avoidance of Abx water was not observed between the 2 groups (supplemental Figure 1D), and there were no significant changes in peripheral neutrophil levels (supplemental Figure 1E).
Antibiotic suppression of peripheral lymphocytes occurs rapidly with the depletion of the intestinal microbiota. (A) Peripheral blood lymphocyte counts were assessed on an automated hematologic cell counter in Ctrl- and Abx-treated WT mice over 14 days. (B) Fecal pellets revealed a decreased relative abundance of fecal microbes in Abx-treated WT mice over 14 days compared with Ctrl mice as determined by 16S rRNA gene qPCR. (C) Mass of spleens isolated from mice given Abx for the indicated number of days. (D) Flow cytometric determination of the absolute number of B220+ B cells from the spleens of mice from panel C. For panels A-B, 2-way mixed analysis of variance was used to test statistical significance between groups of interest; and for panels C-D, the Kruskal-Wallis test was used. Data are displayed as mean ± SEM from 2 independent experiments. ns, P > .05; ∗P ≤ .05; ∗∗P ≤ .01; ∗∗∗P ≤ .001; ∗∗∗∗P ≤ .0001. ns, not significant.
Antibiotic suppression of peripheral lymphocytes occurs rapidly with the depletion of the intestinal microbiota. (A) Peripheral blood lymphocyte counts were assessed on an automated hematologic cell counter in Ctrl- and Abx-treated WT mice over 14 days. (B) Fecal pellets revealed a decreased relative abundance of fecal microbes in Abx-treated WT mice over 14 days compared with Ctrl mice as determined by 16S rRNA gene qPCR. (C) Mass of spleens isolated from mice given Abx for the indicated number of days. (D) Flow cytometric determination of the absolute number of B220+ B cells from the spleens of mice from panel C. For panels A-B, 2-way mixed analysis of variance was used to test statistical significance between groups of interest; and for panels C-D, the Kruskal-Wallis test was used. Data are displayed as mean ± SEM from 2 independent experiments. ns, P > .05; ∗P ≤ .05; ∗∗P ≤ .01; ∗∗∗P ≤ .001; ∗∗∗∗P ≤ .0001. ns, not significant.
To gain additional insights into alterations of peripheral lymphoid populations during Abx treatment, we analyzed splenic tissue at 0 to 7 days after initiation of Abx treatment. Consistent with previous reports,12 significantly decreased spleen mass was identified by 7 days of Abx treatment (Figure 2C). Splenic B-cell populations were also significantly depleted by 7 days of Abx (Figure 2D), in addition to depleted splenic T-cell and myeloid cell populations (supplemental Figure 1F). Altogether, these results demonstrate that alterations to the peripheral lymphoid compartment after Abx treatment occur rapidly and are predominantly defined by the loss of lymphocytes.
Antibiotic treatment induces apoptosis in B-cell progenitors but does not suppress cell cycle activity
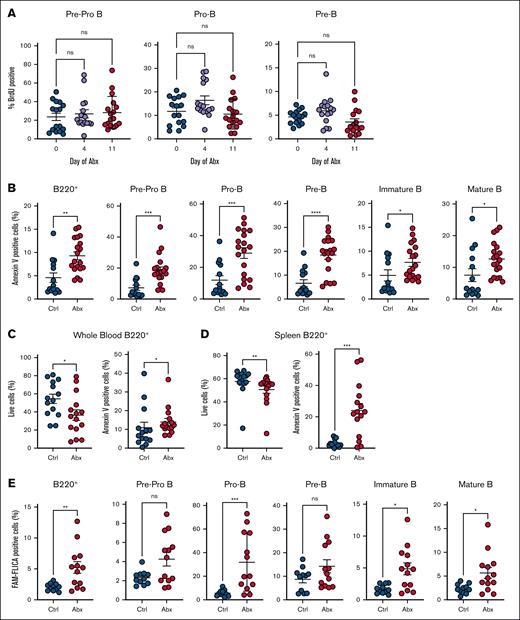
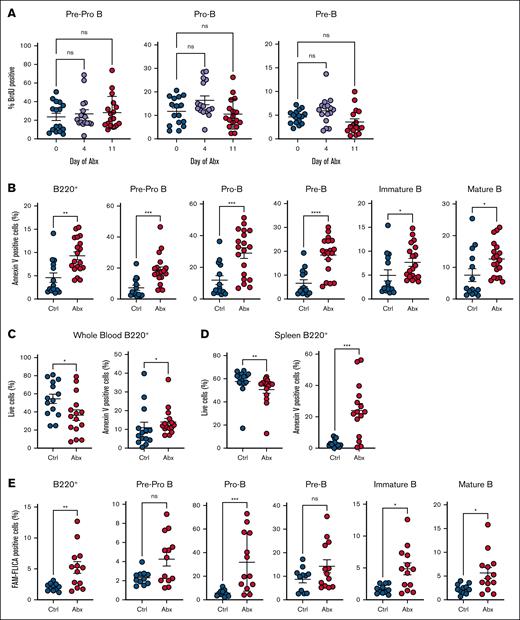
To determine whether Abx alters the proliferation of BM B-cell progenitors, we assessed BrdU incorporation across early B-cell progenitors, specifically pre–pro-B, pro–B, and pre–B cells, after 4 or 11 days of Abx, but found minimal alterations (Figure 3A). Therefore, we investigated whether Abx deplete B-cell progenitor populations by inducing cell death. We observed significantly increased annexin V staining, a marker of apoptosis, in BM B220+ cells, as well as in each individual B-cell progenitor population after 14 days of Abx (Figure 3B). Decreased live cell proportions and increased annexin V staining was also observed in blood and splenic B cells after Abx (Figure 3C-D). Using FLICA methodology to detect caspase-1 activation as an orthogonal quantification of apoptosis, we found significantly increased proportions of FLICA+ B220+ cells and in many B-cell progenitor populations after 14 days of Abx, indicating increased caspase activation (Figure 3E). These results suggest that Abx treatment, potentially via microbiota depletion, contributes to increased apoptosis of B cells.
Antibiotics induce apoptosis but not cell cycle suppression in B-cell progenitor populations. (A) BrdU incorporation was determined for Ctrl- and Abx-treated mice in the early B-cell progenitors, and pre–pro-B, pro–B, and pre–B cells, in the BM. (B) Proportion of annexin V–positive BM B-cell progenitor cells was determined in Ctrl- and Abx-treated mice. (C) Proportion of live cells and annexin V–positive cells from B220+ B cells in the peripheral blood. (D) Proportion of live cells and annexin V–positive cells from B220+ B cells in the spleen. (E) Proportion of cells positive for the fluorescent reporter (FAM) in the FLICA assay as a measure of caspase activity for quantification of cell apoptosis. For panel A, the Kruskal-Wallis test was used to test statistical significance between groups of interest; and for panels B-E, the Mann-Whitney U test was used. Data are displayed as ± SEM from 2 independent experiments. ∗P ≤ .05; ∗∗P ≤ .01; ∗∗∗P ≤ .001; ∗∗∗∗P ≤ .0001.
Antibiotics induce apoptosis but not cell cycle suppression in B-cell progenitor populations. (A) BrdU incorporation was determined for Ctrl- and Abx-treated mice in the early B-cell progenitors, and pre–pro-B, pro–B, and pre–B cells, in the BM. (B) Proportion of annexin V–positive BM B-cell progenitor cells was determined in Ctrl- and Abx-treated mice. (C) Proportion of live cells and annexin V–positive cells from B220+ B cells in the peripheral blood. (D) Proportion of live cells and annexin V–positive cells from B220+ B cells in the spleen. (E) Proportion of cells positive for the fluorescent reporter (FAM) in the FLICA assay as a measure of caspase activity for quantification of cell apoptosis. For panel A, the Kruskal-Wallis test was used to test statistical significance between groups of interest; and for panels B-E, the Mann-Whitney U test was used. Data are displayed as ± SEM from 2 independent experiments. ∗P ≤ .05; ∗∗P ≤ .01; ∗∗∗P ≤ .001; ∗∗∗∗P ≤ .0001.
Abx-mediated B-cell loss is independent of IFN signaling
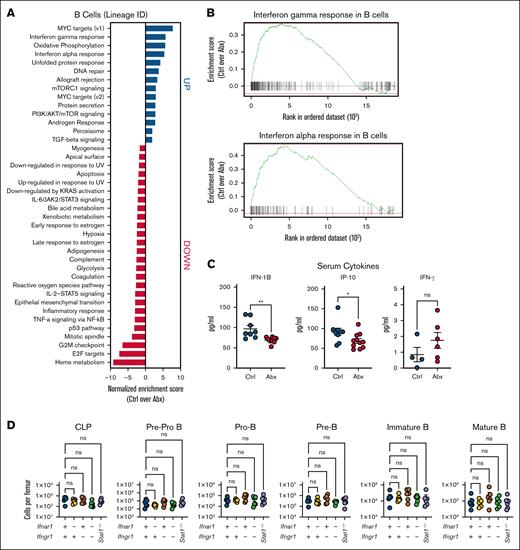
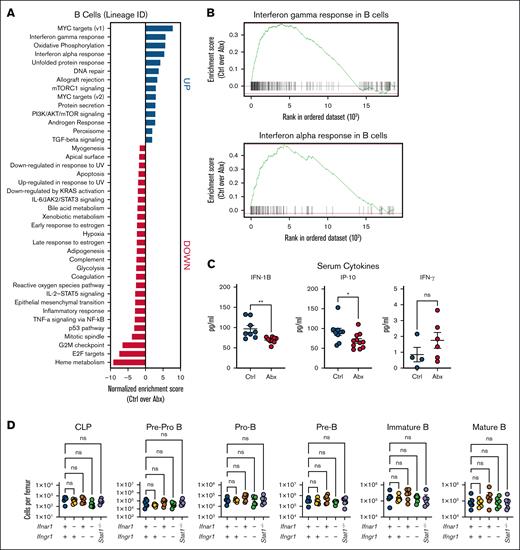
We previously found key roles for IFNs, particularly type I IFNs, in driving microbiota-dependent steady-state hematopoiesis,12,16 but the role of IFNs in microbiota-dependent maintenance of B-cell populations has, to our knowledge, not yet been examined. The gut microbiota maintains systemic type I IFN signaling, with bacterial products both directly stimulating IFN production and indirectly enhancing IFN signaling.29-31 Thus, we hypothesized that there may be a role for IFNs in maintaining blood lymphocyte populations. Pathway enrichment analysis of whole BM (supplemental Figure 3) and the B-cell lineage cluster (Figure 4A) from our scRNAseq data revealed that type I and II IFN responses were among the pathways most enriched in Ctrl compared with Abx-treated mice (Figure 4B). We performed a serum cytokine analysis after sustained exposure to Abx for 4 weeks and found that Abx-treated animals had decreased levels of type I IFN IFN-β1 (IFN-1B) and IFN-stimulated gene IFN-γ–induced protein 10, but no difference in IFN-γ when compared with Ctrl (Figure 4C).
Depletion of BM B cells during Abx treatment is independent of type I and II IFN signaling. (A) Pathway enrichment analysis of the B-cell lineage cluster from single cells combined from BM from WT mice treated for 14 days with the vehicle Ctrl or Abx cocktail in drinking water reveals upregulated and downregulated enriched pathways in Ctrl mice compared with Abx-treated mice. (B) Enrichment plots show that IFN-γ and IFN-α responses were among the pathways most enriched in BM B cells from Ctrl mice, as compared with Abx-treated mice. (C) Multiplex-based quantification of relevant serum cytokines IFN-1B, ISG, IP-10, and IFN-γ in mice exposed to 4 weeks of Abx or Ctrl conditions in 1 representative experiment. (D) BM populations of B-cell progenitors were quantified in mice lacking type I (Ifnar1−/−), type II (Ifngr1−/−), and type I and II (Ifnar1−/−Ifngr1−/−) IFN signaling, and Stat1 (Stat1−/−)-deficient mice compared with WT mice. For panel C, the Mann-Whitney U test was used to test statistical significance between the groups; and for panel D, the Kruskal-Wallis test was used. Data are displayed as mean ± SEM from 2 independent experiments. ∗P ≤ .05; ∗∗P ≤ .01. IFN-1B, type I IFN IFN-β1; IP-10, IFN-γ–induced protein 10; ISG, IFN-stimulated gene.
Depletion of BM B cells during Abx treatment is independent of type I and II IFN signaling. (A) Pathway enrichment analysis of the B-cell lineage cluster from single cells combined from BM from WT mice treated for 14 days with the vehicle Ctrl or Abx cocktail in drinking water reveals upregulated and downregulated enriched pathways in Ctrl mice compared with Abx-treated mice. (B) Enrichment plots show that IFN-γ and IFN-α responses were among the pathways most enriched in BM B cells from Ctrl mice, as compared with Abx-treated mice. (C) Multiplex-based quantification of relevant serum cytokines IFN-1B, ISG, IP-10, and IFN-γ in mice exposed to 4 weeks of Abx or Ctrl conditions in 1 representative experiment. (D) BM populations of B-cell progenitors were quantified in mice lacking type I (Ifnar1−/−), type II (Ifngr1−/−), and type I and II (Ifnar1−/−Ifngr1−/−) IFN signaling, and Stat1 (Stat1−/−)-deficient mice compared with WT mice. For panel C, the Mann-Whitney U test was used to test statistical significance between the groups; and for panel D, the Kruskal-Wallis test was used. Data are displayed as mean ± SEM from 2 independent experiments. ∗P ≤ .05; ∗∗P ≤ .01. IFN-1B, type I IFN IFN-β1; IP-10, IFN-γ–induced protein 10; ISG, IFN-stimulated gene.
To directly test the importance of IFNs in maintaining peripheral lymphocyte counts, we characterized B-cell populations in WT mice, mice lacking the type I IFN receptor (Ifnar1−/−), type II IFN receptor (Ifngr1−/−), both receptors (Ifnar1−/−Ifngr1−/−), or Stat1−/− mice, which lack response to all IFNs, during homeostasis. Analysis of the BM of these animals showed no significant differences in the B-cell progenitor compartments in these animals during homeostasis (Figure 4D). We identified no significant differences in total WBCs or lymphocytes among these genotypes (supplemental Figure 4A), suggesting that although type I and II IFN signaling are necessary for hematopoietic stem cell maintenance, they are dispensable in B-cell progenitor homeostasis. To further exclude IFN signaling in the maintenance of blood and BM B-cell populations, we treated WT and Ifnar1−/−Ifngr1−/− mice with Abx or vehicle Ctrl for 14 days. Similar to WT mice, Ifnar1−/−Ifngr1−/− animals exposed to Abx exhibited significant decreases in blood WBCs and lymphocytes when compared with Ctrl-treated Ifnar1−/−Ifngr1−/− mice (supplemental Figure 4B). In the BM, there were no significant differences in the populations of early B-cell progenitors, pre–pro-B cells, and pro-B cells, between Ctrl- and Abx-treated conditions in Ifnar1−/−Ifngr1−/− mice; however, total BM B220+ cells and more differentiated B-cell progenitors, pre–B cells, and immature and mature B cells, were significantly depleted when compared with Ctrl-treated Ifnar1−/−Ifngr1−/− mice (supplemental Figure 4C). Our data thus support the established important role of IFNs in maintenance of stem and early progenitor populations but indicate an IFN-independent effect of Abx treatment in loss of more differentiated B-cell populations.
Antibiotics promote loss of B cells in the absence of effects on the microbiota
Given that Abx treatment contributes to increased apoptosis of B cells, we reasoned that the BM compartment in GF mice may parallel the B-cell progenitor depletion observed in WT mice with Abx. Although there was no observed difference in whole-blood WBCs or lymphocytes between SPF and GF mice at baseline (supplemental Figure 5A), we identified significantly reduced BM cellularity in naïve WT GF mice compared with SPF WT mice (supplemental Figure 5B). GF animals had significantly decreased absolute counts of BM CLPs, B-cell progenitors, and mature B-cell populations when compared with SPF mice at baseline (supplemental Figure 5C). Further analysis of the BM B-cell fractions as relative cell counts identified no overall difference in total B220+ B cells or in individual BM B-cell progenitors per total number of cells (supplemental Figure 5D-E). Thus, although the GF mice harbor less total BM cells, the proportion of BM B-cell progenitors was no different, suggesting potentially distinct roles for acute gut microbial alterations and chronic intestinal microbial suppression in the maintenance of BM B cells.
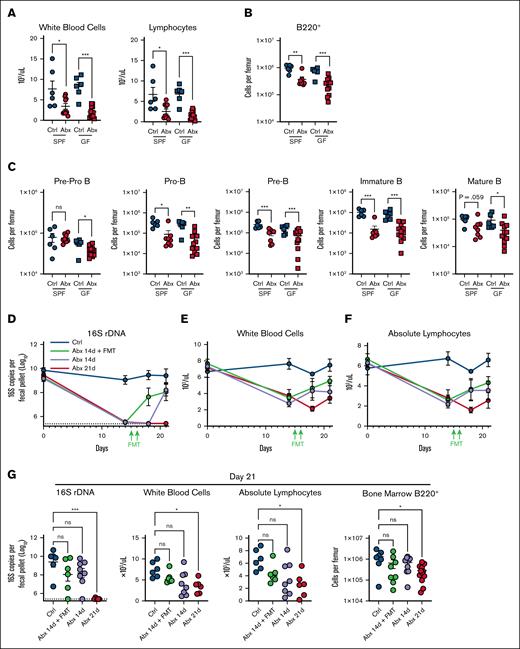
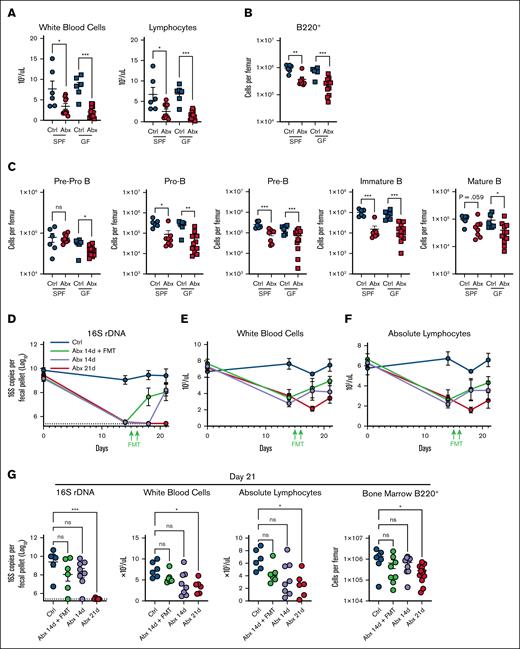
Given these findings, we profiled GF mice exposed to Abx to define whether Abx may induce cytotoxicity on BM B-cell populations. Importantly, GF mice exposed to Abx demonstrated a substantial depletion of WBCs and blood lymphocytes during Abx treatment (Figure 5A). Importantly, GF mice exposed to Abx also had significantly absolute B-cell progenitor depleted total B220+ B-cell populations when compared with Ctrl-treated GF mice (Figure 5B-C), suggesting a secondary additive effect of direct cytotoxicity on B-cell populations during prolonged Abx treatment.
Depletion of fecal microbiota and direct effects of Abxs are key factors in Abx-associated BM B-cell depletion. (A) WBCs and absolute lymphocyte counts in whole blood in SPF and GF mice exposed to Ctrl and Abx conditions for 14 days. (B) BM B220+ B cells and (C) B-cell progenitor populations in SPF and GF mice exposed to Ctrl and Abx conditions. (D) Fecal microbial abundance was measured by 16S rRNA gene qPCR for SPF WT Ctrl mice, Abx-treated mice, and mice treated with Abx plus FMT for the indicated number of days. (E) WBCs and (F) absolute lymphocyte cell counts from whole blood were quantified from mice in each of these conditions. (G) Fecal microbial abundance by 16S rRNA qPCR, WBCs, blood lymphocytes, and B220+ BM cells were profiled on day 21 from mice in each condition. For panels A-C, the Mann-Whitney U test was used to test statistical significance between groups; and for panel G, the Kruskal-Wallis test was used. Data are displayed as mean ± SEM from 2 independent experiments. ∗P ≤ .05; ∗∗P ≤ .01; ∗∗∗P ≤ .001. rDNA, ribosomal DNA.
Depletion of fecal microbiota and direct effects of Abxs are key factors in Abx-associated BM B-cell depletion. (A) WBCs and absolute lymphocyte counts in whole blood in SPF and GF mice exposed to Ctrl and Abx conditions for 14 days. (B) BM B220+ B cells and (C) B-cell progenitor populations in SPF and GF mice exposed to Ctrl and Abx conditions. (D) Fecal microbial abundance was measured by 16S rRNA gene qPCR for SPF WT Ctrl mice, Abx-treated mice, and mice treated with Abx plus FMT for the indicated number of days. (E) WBCs and (F) absolute lymphocyte cell counts from whole blood were quantified from mice in each of these conditions. (G) Fecal microbial abundance by 16S rRNA qPCR, WBCs, blood lymphocytes, and B220+ BM cells were profiled on day 21 from mice in each condition. For panels A-C, the Mann-Whitney U test was used to test statistical significance between groups; and for panel G, the Kruskal-Wallis test was used. Data are displayed as mean ± SEM from 2 independent experiments. ∗P ≤ .05; ∗∗P ≤ .01; ∗∗∗P ≤ .001. rDNA, ribosomal DNA.
Cessation of antibiotics facilitate maintenance and restoration of lymphocytes
Next, we asked whether restoration of the microbiota after Abx-mediated dysbiosis may rescue these depleted populations. In a 21-day treatment model, SPF WT mice received 14 days of Abx and then had their Abx replaced with normal drinking water, then either received fecal microbial transfer (FMT) via oral gavage on days 15 and 16 or were permitted 7 days of natural recovery and were compared with Ctrl mice or mice who received 21 continuous days of Abx. As expected, all groups exposed to Abx demonstrated a significant loss of intestinal bacteria (Figure 5D). Abx followed by FMT resulted in recovery of bacterial communities by day 18 when compared with Ctrl mice, whereas natural recovery of bacterial levels after cessation of Abx without FMT was delayed until 21 days. Animals were serially evaluated for WBC (Figure 5E) and absolute lymphocyte counts (Figure 5F) during these treatments. WBCs, absolute blood lymphocyte counts, BM B220+ B cells, and early B-cell progenitor populations of FMT recipients were similar to mice permitted natural recovery and Ctrl animals by day 21 (Figure 5G; supplemental Figure 6). Therefore, these data indicate a gradual recovery of B-cell populations after cessation of Abx, although both direct cellular cytotoxicity and dysbiosis may contribute.
MYC survival signaling contributes to BM B-cell lymphopoiesis
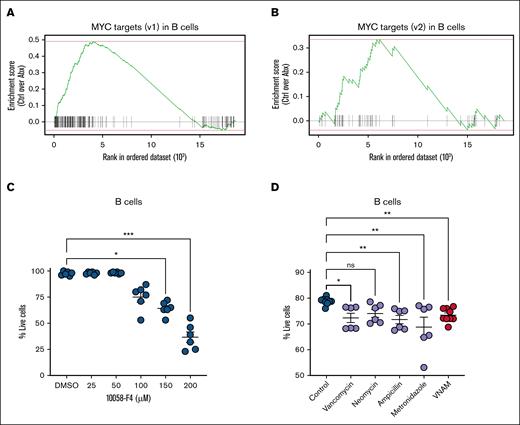
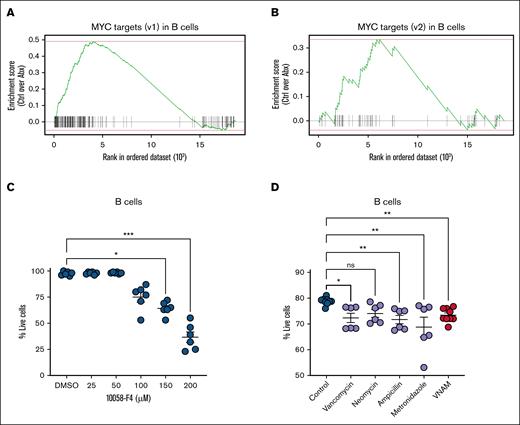
Next, we sought to identify an alternative signaling pathway maintaining B-cell survival. Our pathway enrichment analysis highlighted loss of expression of the targets of proto-oncogene transcription factor MYC in Abx-treated mice (Figures 4A and 6A-B). MYC activation is a known contributor to the survival and proliferation of B cells.32-36 Previous work has shown that the overexpression of MYC inhibits intrinsic apoptosis and p53 activity, resulting in malignant transformation of B cells,32-34 whereas targeted deletion of B-cell–specific MYC and N-MYC genes results in impaired pre–B-cell development.35 We thus postulated that MYC inhibition would contribute to reduced survival of murine BM B cells. Enriched B220+ BM B cells from naïve WT mice were exposed to increasing concentrations of 10058-F4, an inhibitor of c-MYC-Max interactions that suppresses transactivation of MYC target gene transcription. B cells demonstrated a dose-dependent loss in viability after 4 hours in vitro when compared with B cells exposed to dimethyl sulfoxide alone (Figure 6C), confirming that MYC activity supports B-cell survival.
Survival signaling by MYC target gene expression contributes to BM B-cell maintenance. (A) Single-cell enrichment plots for MYC targets (v1) and (B) MYC targets (v2) in the B-cell lineage cluster. (C) c-MYC inhibition by 10058-F4 for 4 hours reduced the viability of enriched B220+ B cells. (D) Cell viability of BM CD11b–B220+ B-cell populations decreased with in vitro exposure to individual antibiotics or antibiotics in combination. For panels C-D, the Kruskal-Wallis test was used to test statistical significance between the groups of interest, and data are displayed as mean ± SEM from 2 independent experiments. ∗P ≤ .05; ∗∗P ≤ .01; ∗∗∗P ≤ .001. ns, not significant; v1, version 1; v2, version 2.
Survival signaling by MYC target gene expression contributes to BM B-cell maintenance. (A) Single-cell enrichment plots for MYC targets (v1) and (B) MYC targets (v2) in the B-cell lineage cluster. (C) c-MYC inhibition by 10058-F4 for 4 hours reduced the viability of enriched B220+ B cells. (D) Cell viability of BM CD11b–B220+ B-cell populations decreased with in vitro exposure to individual antibiotics or antibiotics in combination. For panels C-D, the Kruskal-Wallis test was used to test statistical significance between the groups of interest, and data are displayed as mean ± SEM from 2 independent experiments. ∗P ≤ .05; ∗∗P ≤ .01; ∗∗∗P ≤ .001. ns, not significant; v1, version 1; v2, version 2.
To further evaluate whether B-cell progenitor apoptosis during Abx treatment might be affected by cytotoxic effects of Abx themselves, we administered Abx to B cells in vitro. Pooled whole BM cells from naïve WT mice were cocultured in media with vancomycin, neomycin, ampicillin, or metronidazole at equivalent doses to the in vivo model, or in combination. B cells exposed to vancomycin, ampicillin, metronidazole, or a combination of all 4 antibiotics exhibited decreased cell viability after 18 hours compared with B cells cultured in Ctrl conditions (Figure 6D).37-39 In sum, our findings support a model in which the loss of B-cell progenitors is driven by a loss of MYC signaling and direct antibiotic-mediated toxicity.
Discussion
We previously reported that microbiota depletion by Abx reduces peripheral blood counts, decreases BM cellularity, and suppresses numerous classes of hematopoietic progenitors, namely hematopoietic stem cells, CLPs, and multipotent progenitors.12 This study sought to characterize the substantial loss of BM B-cell progenitors during microbiota-depleted conditions identified by scRNAseq. Immature B cells migrate from the BM to the spleen for maturation,40 and we identified a corresponding early reduction in blood lymphocytes, spleen weight, and splenic B-cell populations in Abx-treated mice. Although we found minimal changes in the proliferative activity of B-cell progenitors, we observed enhanced apoptosis of both progenitor and mature B cells.
To elucidate specific B-cell survival mechanisms, we investigated pathways altered by Abx treatment. Although we observed loss of type I and II IFN signaling in B cells of Abx-treated mice, mice lacking these signaling pathways exhibited no alterations in B-cell populations, indicating that type I IFN is dispensable for B-cell survival.
We observed that although the absolute BM B-cell counts are significantly altered in GF mice, the proportions of BM B cells are not, suggesting distinct mechanisms of microbiota promotion of these cell populations during acute vs chronic microbial suppression. Furthermore, GF mice treated with Abx exhibited a substantial depletion of both peripheral and BM lymphocytes, similar to Abx-treated SPF mice, suggesting an additive effect of antibiotic-mediated cytotoxicity on B-cell depletion even in the absence of the microbiota. Although previous work has revealed decreased populations of BM granulocytes in GF mice, and that these populations were not further suppressed with Abx, effects on B cells have not yet been characterized well.12 We further observed that Abx-associated lymphopenia in SPF WT mice recovered similarly with fecal transplant or with slower natural recovery after discontinuation of antibiotics, further implicating direct effects of antibiotics in loss of lymphocyte populations.
Because MYC signaling emerged as the most dramatically Abx-altered pathway in our scRNAseq analysis, we next turned to this pathway. MYC-mediated transcription facilitates cell cycle progression and cellular proliferation, with established roles in stimulating B-cell differentiation and growth.32-36 Eμ-myc transgenic mice overexpressing MYC in B-lymphocyte progenitors demonstrate amplified cell growth during all stages of B-cell development when compared with Ctrls.36 We found that treatment of BM B cells in vitro with a MYC inhibitor rapidly limits cell viability in a short-term in vitro assay, although it is possible that a more sustained exposure may induce toxic effects. These data are consistent with decreased viability of B-cell populations during Abx treatment in vivo, supporting the contributions of loss of MYC signaling to antibiotic-associated B-cell loss.
Next, we identified that B-cell viability was affected by Abx administration in vitro, establishing a role for adverse antibiotic-mediated cytotoxic effects on B-cell progenitors. Although antibiotic-associated myelosuppression has been previously reported, the specific mechanisms remain unclear.7,41-44 Our study has revealed new roles for antibiotic-associated dysbiosis and direct hematological effects on BM B-cell survival and maintenance.
These results have significant translational implications for patients at risk of hematologic dysregulation during broad-spectrum antibiotic therapy and facilitate future studies to enable accurate prediction and development of therapeutics for patients at risk of antibiotic-associated BM suppression. In the future, it will be critical to further elucidate the relative contribution of specific microbial factors to B-cell survival vs the toxic effects of antibiotics themselves in driving B-cell loss. Targeting these contributors will be important for development of therapeutic applications for hematopoietic maintenance during long-term antibiotic treatment.
Acknowledgments
The authors acknowledge the Washington University Gnotobiotic Core Facility for assistance with germ-free mouse generation. The authors thank Zev Greenberg and Laura G. Schuettpelz at Washington University in St. Louis for technical assistance with flow cytometry experiments.
This work was supported by National Institutes of Health (NIH; Office of the Director grant R01OD024917 and National Institute of Allergy and Infectious Diseases (NIAID) grants R01AI139314, R01AI141716, R01AI173360, and R21AI171831 [M.T.B.]; National Heart Lung and Blood Institute (NHLBI) grant R35HL155672 [K.Y.K.]; National Institute of Child Health and Human Development grant K12HD076224 [L.S.S.]; National Institute of General Medical Sciences (NIGMS) grant T32GM007067 [F.C.W.]; NHLBI grant F31HL168921 and NIGMS grant T32GM136554 [A.A.M.]; and NIAID grant T32AI007163 and NIGMS grant T32GM007200 [G.K.]). L.S.S. is supported by the Washington University Dean’s scholars award, funded by a Burroughs Wellcome Fund Physician-Scientist Institutional award. This project was supported by the Cytometry and Cell Sorting Core at Baylor College of Medicine with funding from the Cancer Prevention and Research Institute of Texas (CPRIT) Core Facility support award (CPRIT-RP180672), the NIH (National Cancer Institute grant P30CA125123 and National Center for Research Resources grant S10RR024574), and the expert assistance of Joel M. Sederstrom.
Authorship
Contribution: L.S.S., F.C.W., A.A.M., H.J., G.K., and C.L. performed the experiments; L.S.S., F.C.W., A.A.M., L.W., H.J., K.Y.K., and M.T.B. analyzed the results; L.S.S., F.C.W., A.A.M., K.Y.K., and M.T.B. designed the project and helped with experimental design; L.S.S., F.C.W., and A.A.M wrote the manuscript; and all authors read and edited the manuscript.
Conflict-of-interest disclosure: The authors declare no competing financial interests.
Correspondence: Megan T. Baldridge, Department of Medicine, Washington University School of Medicine, 4523 Clayton Ave, CB8510, St. Louis, MO 63110; email: mbaldridge@wustl.edu.
References
Author notes
L.S.S., F.C.W., and A.A.M. contributed equally to this study.
Single-cell RNA-sequencing data have been deposited in the European Nucleotide Archive (accession number: PRJEB74362).
Original data are available on request from the corresponding author, Megan T. Baldridge (mbaldridge@wustl.edu).
The full-text version of this article contains a data supplement.

