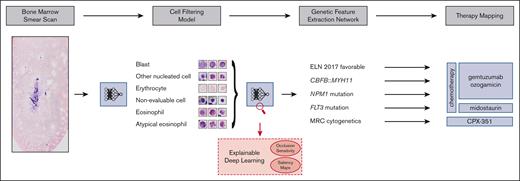
A fully automated, end-to-end deep learning pipeline can predict genetic features of AML from routine bone marrow smears.
The automated single-cell image generation and analysis pipeline is a new tool for morphologic characterization of bone marrow disorders.
Visual Abstract
The detection of genetic aberrations is crucial for early therapy decisions in acute myeloid leukemia (AML) and recommended for all patients. Because genetic testing is expensive and time consuming, a need remains for cost-effective, fast, and broadly accessible tests to predict these aberrations in this aggressive malignancy. Here, we developed a novel fully automated end-to-end deep learning pipeline to predict genetic aberrations directly from single-cell images from scans of conventionally stained bone marrow smears already on the day of diagnosis. We used this pipeline to compile a multiterabyte data set of >2 000 000 single-cell images from diagnostic samples of 408 patients with AML. These images were then used to train convolutional neural networks for the prediction of various therapy-relevant genetic alterations. Moreover, we created a temporal test cohort data set of >444 000 single-cell images from further 71 patients with AML. We show that the models from our pipeline can significantly predict these subgroups with high areas under the curve of the receiver operating characteristic. Potential genotype-phenotype links were visualized with 2 different strategies. Our pipeline holds the potential to be used as a fast and inexpensive automated tool to screen patients with AML for therapy-relevant genetic aberrations directly from routine, conventionally stained bone marrow smears already on the day of diagnosis. It also creates a foundation to develop similar approaches for other bone marrow disorders in the future.
Introduction
Acute myeloid leukemia (AML) is an aggressive malignancy of the hematopoietic system.1-3 Curative treatment is based on intensive induction chemotherapy followed by consolidation chemotherapy or allogeneic hematopoietic stem cell transplantation.1-3 Accurate risk stratification, currently achieved through genetic profiling of mutations and chromosomal changes, is key to matching the right therapy to the right patient.1 Morphologic criteria for disease classification are more and more displaced by defining genetic abnormalities, but are still part of current classification systems.1,4 Importantly, novel therapeutic agents have been approved during recent years as an add-on to intensive first-line therapy for genetic subgroups such as FLT3 inhibitors for fms related receptor tyrosine kinase 3 (FLT3) mutated AML or the antibody-drug conjugate gemtuzumab ozogamicin, which is especially effective in core-binding factor (CBF) rearranged or nucleophosmin 1 (NPM1) mutated AML.5-10 In addition, cytarabine and daunorubicin (CPX-351) is now recommended for patients with AML with myelodysplasia-related changes (MRC), a high-risk subgroup that is defined by antecedent hematological disorders, or certain genetic aberrations.11 However, the acquisition of genetic parameters can take days to weeks after diagnosis and imposes significant costs on health care systems.
Certain cytomorphologic features of leukemic blasts have been described to associate with particular gene mutations, such as NPM1 mutations in blasts with cup-shaped nuclear morphology,12,13 which have been associated with response to therapy and outcome.14-16 Furthermore, general cytomorphologic features that have not been linked to a particular genetic aberration, such as an undifferentiated morphology according to the French-American-British classification or vacuolization of blasts, have been associated with outcome in AML.17,18 It is entirely possible that other yet unknown links exist between the genetic background and the visual appearance of blasts (eg, morphology and texture), given the wide range of mutations or chromosomal aberrations in AML.
Deep learning is a form of machine learning that is able to use successively more abstract representations from input data to perform a specific task.19-21 It has been proven to be particularly successful in computer vision tasks such as image understanding.19 Deep learning has recently been uncovered as a powerful tool to extract prognostic features and genetic aberrations from digital images of tumor sections.22-27 Such computer vision approaches might even extract subtle morphologic and textual patterns that are associated with the genetic background or aggressiveness of the disease and are not apparent to the human eye.20
To use deep learning–based analysis of cytological images as a support for therapeutic decisions, multiple challenges have to be addressed. First, data such as bone marrow smear scans are usually too big to be used by machine learning models directly,19-21 therefore, dedicated image region selection algorithms are required to identify relevant image patches. Of note, previous approaches using cytological images from blood or bone marrow smears have relied on manual image region selections by trained experts, thus lack full automation and might be prone to observer-induced biases.28-30 Second, for supervised learning approaches, huge data sets with appropriate annotations have to be available to train the models.19-21 Third, these algorithms often lack explainability, therefore, accompanying analysis techniques are required to better understand the predictive capacities of the models.20 Lastly, the integration of deep learning–based image assessments into therapeutic routines requires careful considerations with respect to existing clinical routines and expertise of trained personnel.20
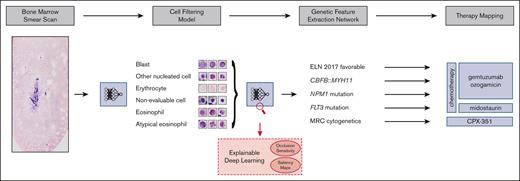
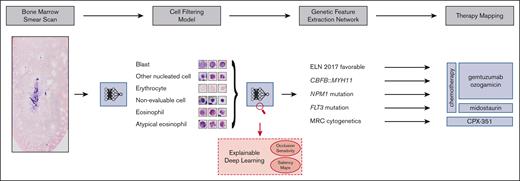
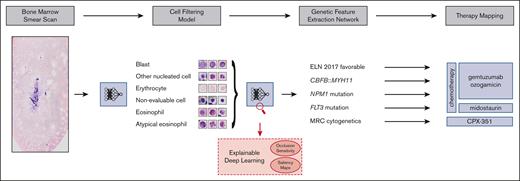
Our aim was to address these challenges and develop a fully automated pipeline (Figure 1), which extracts therapeutically relevant genetic features from single-cell images of conventionally stained bone marrow smears from patients with AML on the day of first diagnosis.
Overview of our pipeline. (Left to right) Whole bone marrow smear scan images are processed using a CFM to automatically extract the most relevant single-cell crops, which are rudimentary classified into 4 cell classes. Subsequently, a GFEN is used to predict 5 genetic indicators that are important for first-line therapy decisions (CBFB::MYH11, MRC cytogenetics, FLT3mut, NPM1mut, and ELN 2017 favorable risk) based on appropriate single-cell images only. Additionally, visualization strategies were used to gain explainability with respect to the used deep learning models.
Overview of our pipeline. (Left to right) Whole bone marrow smear scan images are processed using a CFM to automatically extract the most relevant single-cell crops, which are rudimentary classified into 4 cell classes. Subsequently, a GFEN is used to predict 5 genetic indicators that are important for first-line therapy decisions (CBFB::MYH11, MRC cytogenetics, FLT3mut, NPM1mut, and ELN 2017 favorable risk) based on appropriate single-cell images only. Additionally, visualization strategies were used to gain explainability with respect to the used deep learning models.
Methods
Study design
The purpose of this study was to develop and evaluate a fully automated pipeline for the extraction of single-cell images of conventionally stained bone marrow smears and the prediction of genetic alterations from these images. For this purpose, we first collected a multigigabyte data set of 408 diagnostic bone marrow smear scans from patients with AML (discovery cohort). More than 2 000 000 single-cell images were extracted from these scans and used for predictions with convolutional neural networks based on ResNet18 architectures. Augmentation strategies (to improve the generalizability) and k-fold cross-validation (to investigate the impact of different training-test splits) were used to increase and evaluate the robustness of our approach. An independent data set derived from an additional 71 patients from our institution served as a temporal validation cohort. Masked loss changes and saliency maps were used to visualize potential genotype-phenotype links and shed light on the explainability of the models. The study was approved by the institutional review board (2020-378-f-S) and was conducted in accordance with the Declaration of Helsinki.
Whole slide scan image data set
Adult patients with initial diagnosis of AML who received intensive chemotherapy at the University Hospital Münster between 2012 and 2021 and had a pretherapeutic bone marrow smear available were included. Patients treated between 2021 and 2023 served as a temporal validation cohort. Patients with extramedullary AML only, previous allogeneic hematopoietic stem cell transplantation, or acute promyelocytic leukemia were excluded.
Bone marrow smears were prepared from EDTA anticoagulated bone marrow aspirates. The Pappenheim/May-Grünwald-Giemsa stain was carried out in a standardized manner using an automated stainer (Tharmac). All bone marrow smears were included in the study independent of smear quality.
In the discovery cohort, a total of 408 high resolution scans of whole bone marrow smears from 408 patients with AML were taken on an Olympus VS120 Research Slide Scanner with a 40× objective. The whole area of the smear on each slide was selected to be scanned. Scans had an average size of 269 831 × 134 120 pixels (range, 189 406-295 027 × 92 448-144 202). Each pixel had a physical size of 0.17 × 0.17 μm2. One scan took an average time of 1.5 hours. The total storage requirement of all scans in the proprietary compressed .vsi data format was about 3.64 TB, and in the PNG format, which was used for this work, it was 16.3 TB.
In the temporal test cohort, a total of 71 high resolution scans were taken under the same circumstances. These scans had an average size of 255 266 × 130 578 pixels (range, 196 056-285 890 × 86 882-140 172). All test cohort scans required about 0.52 TB of storage in the .vsi data format and about 2.42 TB as PNGs.
Processing pipeline, cell filtering, and genetic feature extraction
The processing pipeline is illustrated in Figure 1 and consists of 2 consecutive deep learning approaches, namely a Cell Filtering Model (CFM) to filter out noninformative images and a Genetic Feature Extraction Network (GFEN) to predict genetic subgroups. The whole pipeline was implemented with Pytorch as the deep learning framework.31
The CFM combines an unsupervised image region selection algorithm32 with a novel supervised filtering model using self-supervised pretraining and ensemble classifications to extract preliminarily classified single-cell crops. Briefly, whole slide images were partitioned into nonoverlapping tiles of 512 × 512 pixels in the data filtering pipeline. Empty tiles and tiles with clusters of cells that were too dense to be properly evaluated were removed based on color and contrast characteristics as illustrated in supplemental Figure 1 (for details, see supplemental Methods). From the remaining tiles, 96 × 96 pixels measuring single-cell crops were generated. These crops still contained many staining artifacts and nonevaluable images. Thus, a ResNet1833 classification network was trained to filter out evaluable single-cell images and remove these nonevaluable crops. This network was trained on 11 845 randomly chosen 96 × 96 pixel images that were each annotated by 2 experienced hematologists as blasts, other nucleated cells, erythrocytes, or nonevaluable images. The annotation process took ∼10 hours in total for each expert. Moreover, 4475 randomly chosen 96 × 96 pixel crops were annotated with 2 additional classes, namely eosinophils and atypical eosinophils, to filter for images of eosinophil cells as an input for the detection of AML with CBFB::MYH11 (eosinophil CFM [eCFM]). This step helps to address the extreme class imbalance between single-cell images of patients with and without CBFB::MYH11, because the former will have more such cells than the latter, improving the ratio of samples between these 2 classes from about 1:25.99 to 1:8.13.
The filtered cells are subsequently used in a GFEN to extract clinically relevant genetic classes, namely CBFB::MYH11, NPM1 mutation, FLT3-internal tandem duplication (ITD) mutation, European LeukemiaNet (ELN) 2017 favorable risk, and MRC cytogenetics. The GFEN model, which consists of a ResNet1833 architecture, is trained on these cell images34 and is evaluated in a fivefold cross-validation to prevent biases, which could have resulted from poor generalization performances (for details see supplemental Methods). The individual models from the cross-validation runs were further evaluated in the temporal validation cohort.
Neural network model visualization strategies
To visualize predictions of the GFEN, we implemented 2 different strategies (supplemental Methods). First, we applied occlusion sensitivity analysis in which individual images were masked before prediction, and the resulting change of loss was calculated. The images whose masking led to the highest loss value were considered as the most relevant ones for prediction and were visualized.35 Second, saliency maps, which highlight pixels that contributed most to the final classification, were used to visualize important subcellular areas.36
Statistical analyses
The final probability for each patient was defined as the maximal cross-validated probability from all inputs of the respective patient. Receiver operating characteristic (ROC) curves were calculated for the compiled cohort. Values of the area under the curve of the ROC (AUROC) are given with a 95% confidence interval (CI) from a bootstrap run with 2000 resamples. Probability scores of patients in a class were compared with the probability scores of patients not in that class using Mann-Whitney U test. Predictions of the ground truth status by the different models were evaluated with logistic regression. Two-sided P values <.05 were considered significant. All analyses were performed using R, version 4.2.2.37
Results
CFM training
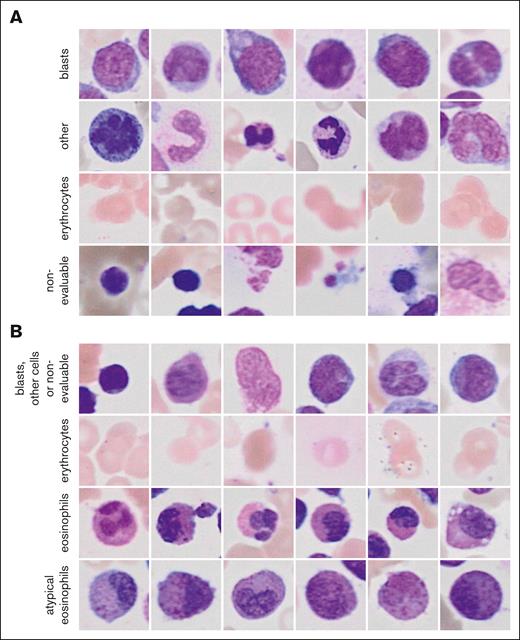
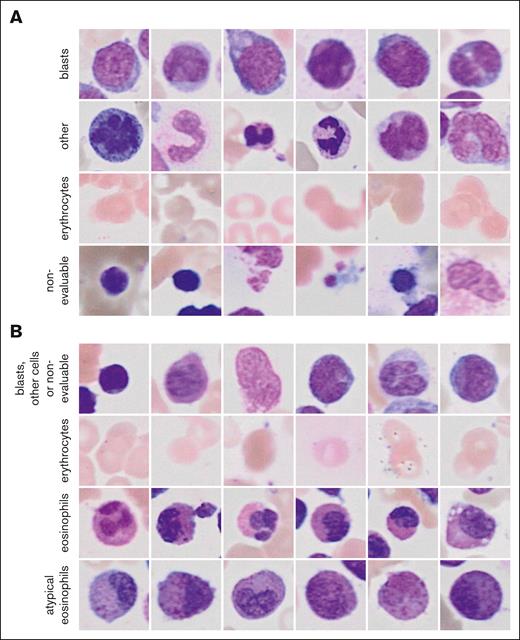
The 2 ResNet18 models that were combined to the ensemble classifier of the general CFM achieved validation accuracies of 0.82 and 0.88 for the classification of single-cell images (Figure 2A). Images of blasts and other nucleated cells were subjected to the GFEN for the predictions of NPM1 mutations, FLT3-ITD mutations, ELN 2017 favorable risk, and MRC cytogenetics. The validation accuracies for the individual ResNet18 models of the eCFM were 0.94 and 0.91 for the image classifications (Figure 2B). Single-cell images of normal and atypical eosinophils from the eCFM were used to predict CBFB::MYH11 with the GFEN.
Randomly sampled example image for the classes of the CFM. (A) Images for the 4 classes of the general CFM and (B) of the eCFM are shown.
Randomly sampled example image for the classes of the CFM. (A) Images for the 4 classes of the general CFM and (B) of the eCFM are shown.
One bone marrow smear scan per patient was subjected to the pipeline. Baseline patient characteristics can be found in Table 1 and supplemental Tables 1 and 2. A flowchart for the discovery cohort is presented in supplemental Figure 2. In total, >7 000 000 images were extracted and subjected to the filtering models. No evaluable single-cell images or eosinophils could be extracted from whole smear scans in 4 patients by the general CFM and in 20 patients by the eCFM, respectively. These patients were thus not included in the respective analyses. Absence of evaluable cells on these slides was confirmed by manual microscopic inspection. A total of 2 002 283 evaluable single-cell images were extracted from 404 scans with the general CFM and 44 679 eosinophils/atypical eosinophils from 384 scans with the eCFM (see supplemental Tables 3 and 4 for detailed information on the produced data sets of the discovery and the temporal test cohorts, respectively).
Prediction of genetic alterations relevant for the addition of gemtuzumab ozogamicin
Patients with favorable genetic risk or NPM1 mutations may benefit from the addition of the antibody-drug conjugate gemtuzumab ozogamicin to intensive chemotherapy.5,6,8,10 Early identification of these patients is important to allocate individual patients to optimal induction therapy. Thus, we asked whether our deep neural network would predict the presence of favorable risk genetic alterations according to the ELN 2017 classification or NPM1 mutations directly from Pappenheim-stained bone marrow stains at first diagnosis of AML.
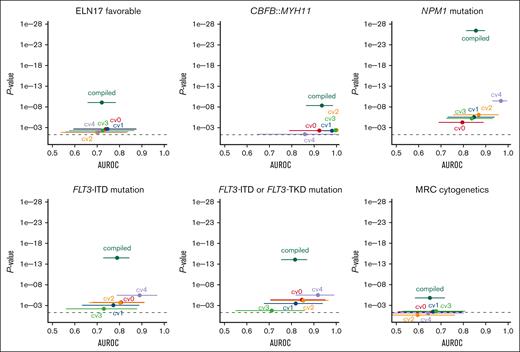
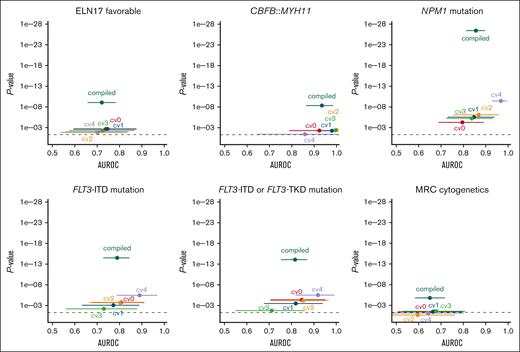
ELN 2017 favorable genetic risk could be significantly predicted with a patient-level AUROC from the compiled fivefold cross-validated probabilities of 0.72 (95% CI, 0.66-0.78; P < .0001; Figure 3). A per 10% increase of the probability score from the model was associated with a 1.3-fold increased likelihood of having ELN 2017 favorable risk (odds ratio [OR], 1.28; 95% CI, 1.18-1.40; P < .0001). In a sensitivity analysis separately excluding patients with NPM1 mutations, CBFB::MYH11, and RUNX1::RUNX1T1, ELN 2017 favorable risk remained predictable with AUROCs of 0.74, 0.72, and 0.72 (all P < .0001), respectively.
Cross-validated prediction of therapeutically relevant genetic groups using the GFEN on the discovery cohort. Deep learning models were trained to predict therapy relevant genetic subgroups from bone marrow smears. The patient-level performance of the GFEN is evaluated for every genetically defined group (ELN 2017 favorable risk, CBFB::MYH11 fusions, NPM1 mutations, FLT3-ITD and -tyrosine kinase domain (TKD) mutations, and MRC cytogenetics) with the AUROC and 2-sided P value for the prediction scores. Values for the validation runs of the fivefold cross-validation are given for the individual folds (cv0, cv1, cv2, cv3, and cv4) and all validation folds of the complete cohort combined (compiled). Error bars show 95% CI. The dashed line represents a P value <.05.
Cross-validated prediction of therapeutically relevant genetic groups using the GFEN on the discovery cohort. Deep learning models were trained to predict therapy relevant genetic subgroups from bone marrow smears. The patient-level performance of the GFEN is evaluated for every genetically defined group (ELN 2017 favorable risk, CBFB::MYH11 fusions, NPM1 mutations, FLT3-ITD and -tyrosine kinase domain (TKD) mutations, and MRC cytogenetics) with the AUROC and 2-sided P value for the prediction scores. Values for the validation runs of the fivefold cross-validation are given for the individual folds (cv0, cv1, cv2, cv3, and cv4) and all validation folds of the complete cohort combined (compiled). Error bars show 95% CI. The dashed line represents a P value <.05.
In the temporal validation cohort, the ELN favorable risk status remained predictable with a median AUROC of 0.64 (range, 0.57-0.69). The minimum and maximum 95% CI were 0.40 and 0.84, respectively.
Because the CBFB::MYH11 fusion is associated with the presence of pathognomonic atypical eosinophils, we also tested whether we could directly predict CBFB::MYH11 from filtered single-cell images of eosinophils. Here, the patient-level AUROC for the compiled fivefold cross-validated probabilities of the CBFB::MYH11 status was 0.93 (95% CI, 0.87-0.98; P < .0001; Figure 3). A per 10% probability score increase was associated with a twofold increased likelihood of having a CBFB::MYH11 fusion (OR, 1.96; 95% CI, 1.54-2.49; P < .0001). Of note, because patients who had evaluable cells but no eosinophils were all negative for CBFB::MYH11, we performed a sensitivity analysis including these patients with a probability of 0 for the presence of CBFB::MYH11. Here, the AUROC was 0.94 (95% CI, 0.88-0.99; P < .0001). In the temporal validation cohort, the CBFB::MYH11 status remained predictable with a median AUROC of 0.91 (range, 0.82-0.94). The minimum and maximum 95% CI were 0.60 and 1.00, respectively.
NPM1mut status could be significantly predicted with a patient-level AUROC of 0.86 (95% CI, 0.81-0.90; P < .0001; Figure 3). A per 10% probability score increase was associated with a 1.7-fold increased likelihood of having a NPM1 mutation (OR, 1.67; 95% CI, 1.50-1.86; P < .0001). In the 23 patients with available information on the NPM1 variant allele frequency (VAF), we found no correlation of the prediction scores and VAF (r = 0.3; P = .16). Because NPM1 mutations frequently co-occur with FLT3-ITD mutations, we performed a sensitivity analysis in which we excluded patients with FLT3-ITD mutations. Here, the model remained predictive of NPM1 mutations with an AUROC of 0.88 (P < .0001). In the temporal validation cohort, the NPM1mut status remained predictable with a median AUROC of 0.70 (range, 0.68-0.75). The minimum and maximum 95% CI were 0.53 and 0.87, respectively.
Prediction of FLT3 mutations qualifying for FLT3 inhibitor treatment
In contrast to NPM1 mutations, there are no pathognomonic phenotypic features that characterize blasts carrying an FLT3 mutation. Patients with activating mutations in FLT3 (with or without a concomitant NPM1 mutation) benefit from tyrosine kinase inhibitors such as midostaurin or quizartinib in addition to chemotherapy.7,9 Because FLT3-tyrosine kinase domain mutational status was only incompletely available in our cohort, we used FLT3-ITD status only to train the model. The FLT3-ITDmut status could be significantly predicted with a patient-level AUROC of 0.79 (95% CI, 0.73-0.85; P < .0001; Figure 3). A per 10% probability score increase was associated with a 1.4-fold increased likelihood of having an FLT3 mutation (OR, 1.43; 95% CI, 1.31-1.56; P < .0001). In the 41 patients with available information on the FLT3-ITD allelic ratio (AR), we found no correlation of the prediction scores and AR (r = 0.016; P = .92). Because it is conceivable that the model predicted the presence of an FLT3-ITD mutation via morphologic features of a co-occurring NPM1 mutation, we excluded patients with NPM1 mutations in a sensitivity analysis. Here, the model still predicted FLT3-ITD mutational status with an AUROC of 0.74 and P value <.0001. In another sensitivity analysis, we applied FLT3-ITD mutation prediction scores on the smaller data set with both known FLT3-ITD and known FLT3-tyrosine kinase domain mutational status. Here, the combined FLT3 mutational status was predictable with an AUROC of 0.82 (95% CI, 0.75-0.87; P < .0001; Figure 3). It should be noted that the AUROCs for different subcohorts are not directly comparable. In the temporal validation cohort, the FLT3-ITDmut status remained predictable with a median AUROC of 0.72 (range, 0.70-0.75). The minimum and maximum 95% CI were 0.54 and 0.87, respectively.
Prediction of myelodysplasia-related cytogenetics qualifying for CPX-351 treatment
Patients with the high-risk subtypes AML-MRC and therapy-related AML may benefit from liposomal CPX-351 chemotherapy.11 AML-MRC is defined by either a history of a precedent hematological disease or myelodysplasia-related cytogenetic abnormalities.1,4 Although a patient`s medical history to define AML-MRC by an antecedent myeloid disorder or therapy-related AML is readily available at first diagnosis, detection of MRC cytogenetics in de novo AML via standard karyotyping may take weeks. Our pipeline predicted MRC cytogenetics with a patient-level AUROC of 0.65 (95% CI, 0.58-0.71; P < .0001; Figure 3). A per 10% probability score increase was associated with a 1.3-fold increased likelihood of having MRC cytogenetics (OR, 1.25; 95% CI, 1.14-1.36; P < .0001). In the temporal validation cohort, the MRC cytogenetic status remained predictable with a median AUROC of 0.68 (range, 0.55-0.78). The minimum and maximum 95% CI were 0.35 and 0.89, respectively.
Deciphering genotype-phenotype links
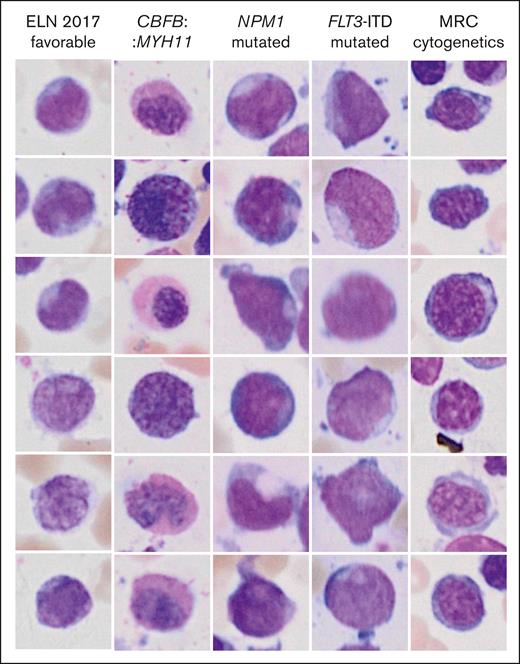
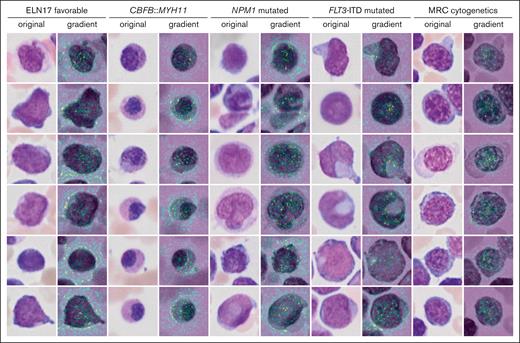
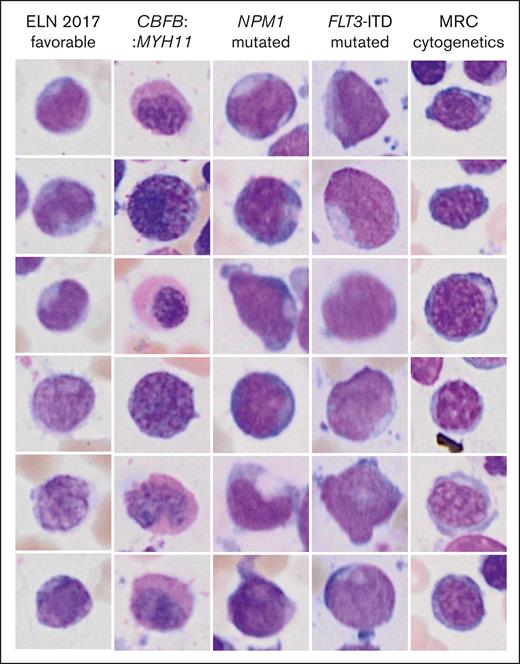
Inference of genetic features from single-cell images might reveal previously unrecognized morphologic features and inform new hypotheses in the pathobiology of AML. Two different visualization strategies were used for each label to explore such features and provide means of explainability of the models. The most important individual single-cell images for the decision toward a label as measured by occlusion sensitivity using masked loss change visualization are presented in Figure 4. As expected, images with cup-shaped nuclear invaginations were prominently observed in images predicted to represent an NPM1 mutation. This morphology was also found among predicted FLT3 mutated images, likely owing to the frequent co-occurrence of both mutations. Atypical eosinophils were found among images with predicted CBFB::MYH11. Cells on images that were predicted to fall into the MRC cytogenetics category demonstrated coarse chromatin structures reminiscent of megaloblastic chromatin changes. The most important pixels on single-cell images for the decision toward a label were indicated with saliency maps (Figure 5). Here, the pixels with the highest intensity, corresponding to the highest importance for the decision of NPM1 mutated AML were preferentially lining the course of the outer shape of the nuclei or were found in their center as a putative representation of cup-shaped morphology. Similar features were found for FLT3 mutated AML. For CBFB::MYH11, the highest intensities were found in the cytoplasm in which one would expect the occurrence of atypical granulation. The most intense pixels for the ELN 2017 favorable category were found in both the cytoplasm and nucleus, potentially corresponding to the diverse genetic background of this group. For the MRC cytogenetics label, the most intense pixels again highlighted the coarse chromatin structure. In addition, pixels with lower intensities were also found surrounding cells to a variable degree for the different labels. These might indicate that features such as cellularity are considered by the algorithm.
Highest scoring single-cell images from occlusion sensitivity analysis for the different genetic categories. The images represent the most important images for the decision toward a label.
Highest scoring single-cell images from occlusion sensitivity analysis for the different genetic categories. The images represent the most important images for the decision toward a label.
Single-cell saliency maps for different genetic categories. The importance of individual pixel for the classification decision are calculated based on gradient computations in the GFEN model and are overlaid onto the original image (high gradient: yellow to green).
Single-cell saliency maps for different genetic categories. The importance of individual pixel for the classification decision are calculated based on gradient computations in the GFEN model and are overlaid onto the original image (high gradient: yellow to green).
Discussion
We developed a fully automatic pipeline that extracts genetic features from Pappenheim-stained whole bone marrow smear scans. Our pipeline uses 2 interleaved deep learning models to extract and classify relevant cell regions (CFM), which are further analyzed to predict the genetic features from this visual data (GFEN). In this proof-of-concept study, we focused on genetic subgroups that are important for first-line therapy decisions. By mapping features to these genetic subgroups, we were able to show that NPM1 mutations, FLT3 mutations, the ELN 2017 favorable genetic risk group, and CBFB::MYH11 rearrangements can be predicted with high AUROCs. Importantly, although NPM1 mutations and the CBFB::MYH11 fusion might be suspected on diagnosis based on visually distinctive phenotypes,12,13FLT3 mutations and the genetically heterogeneous ELN 2017 risk category in general are currently not per se recognizable by morphology only. Of note, prediction of FLT3 mutations or ELN 2017 favorable risk was not dependent on co-occurring NPM1 mutations or on individual favorable risk subgroups, respectively. We did not find any association of our prediction scores with the NPM1 VAF or the FLT3-ITD AR. This may indicate a higher stability of our model with respect to the mutational burden in a sample compared with previous approaches that found an association with the NPM1 VAF.30
The integration of this strategy enables to include visually derived genetic features into therapy decisions from cytological data only, which are available on the day of diagnosis, and may therefore support and accelerate the decision process in first-line AML management. Although techniques for genetic characterization will likely get faster, cost and labor associated with these tests remain substantially higher than a scan of a conventionally stained bone marrow slide that is subjected to an algorithm.27,38 Furthermore, morphology reflects the full genetic and epigenetic state of a cell and might give rise to an own digital morphology-based classification system that complements genetic risk assessment in the future. Finally, in situations in which rapid clinical decision-making is vital but genetic information is pending (eg, hyperleukocytosis), platforms such as the one presented in this article may further assist clinicians in choosing the most appropriate therapy.
Our pipeline has been designed to provide explainability at critical processing levels by applying occlusion sensitivity and saliency maps, both well-known deep learning examination strategies. Even though the CFM is task agnostic with respect to the final genetic prediction, the labels used and the resultant cell images can be inspected by a medical expert. The GFEN was trained using genetically determined classes that can partially be linked to known visual phenotypes such as cup-shaped nuclei in NPM1 mutations or atypical granulation of eosinophils in AML with CBFB::MYH11.12,13 Interestingly, the visualization strategies pointed toward such morphologies, further confirming a meaningful prediction performance of the GFEN.
Our study has some limitations. The first limitation is the low AUROC for the prediction of MRC cytogenetics, which is most likely due to the high cytogenetic heterogeneity in this subgroup. However, the performance of the GFEN might be improved by retraining in a larger patient cohort. Second, we cannot give estimates of how well our models generalize to slides that were prepared at other institutions. However, we rigorously evaluated our model using k-fold cross-validation in which we excluded entire patients from the training set and a temporal validation cohort to validate our algorithm. Moreover, we tested a variety of different architectures,32 included an in-depth evaluation of our models including visualization strategies, and used a variety of augmentation strategies in all trainings (including color jittering and gray-scale augmentation) to avoid overadaptation to our cohort. In addition, models on histological slide scans from other standardized routine stains such as hematoxylin and eosin for solid tumors have been reported to generalize well across different cohorts.22-27 Furthermore, the inclusion of smears independent of staining quality will likely make the algorithm more robust for real life application. Third, because the patients from our discovery cohort were treated for AML before the publication of the updated ELN 2022 classification,39 we cannot provide any information on novel risk- or AML-MR-defining gene mutations. The inclusion of these and other rare markers is planned in follow-up studies based on this proof-of-concept publication.
In summary, we show that high numbers of single-cell images can be extracted from whole bone marrow smear scans in a fully automated approach, and this pipeline can be used to predict therapeutically relevant genetic features from single-cell images. Further optimization of the predictive performance of our models using larger, more diverse cohorts and life-long learning approaches to adapt to a changing clinical landscape might increase its value as a decision-making tool in the future.
Acknowledgments
The authors thank the staff of the hematological laboratory of the University Hospital Münster for their excellent assistance with the preparation of bone marrow smears and sample collection from the archives. The authors also thank the staff of the Centre of Reproductive Medicine and Andrology Münster for providing and guiding into the slide scanner and the Ministerium für Kultur und Wissenschaft des Landes Nordrhein-Westfalen for the AI Starter support (ID 005-2010-005). The calculations for this work were performed on the computer cluster PALMA II of the University of Münster.
The study was supported by the Recovery Assistance for Cohesion and the Territories of Europe (REACT-EU) program of the European Commission and the state of North Rhine-Westphalia (EFRE-0802099), the Deutsche Forschungsgemeinschaft (DFG, German Research Foundation – 470563736; L.A.), the DFG (DFG - CRC 1450 – 431460824; B.R.), the DFG (DFG - CRU 326; J.K., J.G., and S.S.), a research grant from Human Frontier Science Program (HFSP, reference number: RGP0057/2021; S.T.), and by DFG excellence cluster “cells in motion” EXC 1003 (W.E.B. and G.L.).
Authorship
Contribution: J.B. and L.A. collected data and samples and performed statistical analyses; J.K. and S.T. created the image processing and filtration pipeline and developed the analysis pipeline for therapy mapping; J.K., S.T., and L.H. evaluated the resulting models with additional AI explainability methods; C.S. and L.A. annotated single-cell images; R.E. helped with cytogenetic classification; J.G. and S.S. helped with image acquisition; S.W., B.S., and W.E.B. gave advice during the project; A.B., G.L., W.E.B., C.S., and L.A. provided patient care and data for the study; L.A. initiated the project; C.S., B.R., and L.A. supervised the study; J.K., S.T., J.B., C.S., B.R., and L.A. wrote the initial draft of the manuscript; and all authors critically reviewed and approved the manuscript.
Conflict-of-interest disclosure: The authors declare no competing financial interests.
Correspondence: Benjamin Risse, Institute for Geoinformatics, University of Münster, Heisenbergstr. 2, 48149 Münster, Germany; email: b.risse@uni-muenster.de; and Linus Angenendt, Department of Medicine A, University Hospital Münster, Albert-Schweitzer-Campus 1, 48149 Münster, Germany; email: angenendt@uni-muenster.de.
References
Author notes
∗J.K., S.T., and J.B. share first authorship.
†C.S., B.R., and L.A. share senior authorship.
The code for data set generation and network training and prediction are available at https://zivgitlab.uni-muenster.de/cvmls/dl4aml. Other data will be shared upon qualified request from the corresponding author, Linus Angenendt (angenendt@uni-muenster.de) after ethics approval and signed material transfer agreements for the respective scientific project.
The full-text version of this article contains a data supplement.

