Key Points
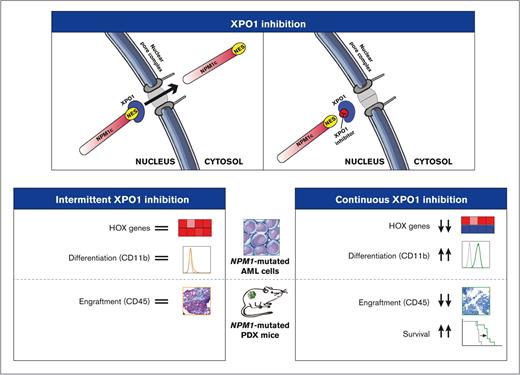
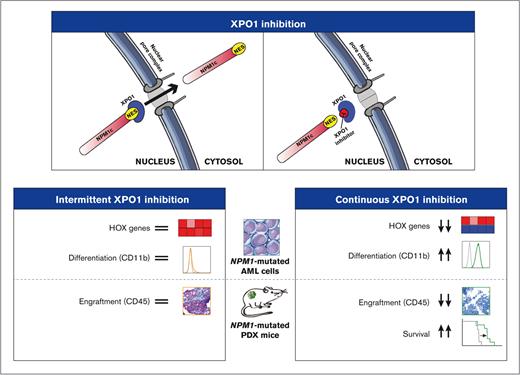
Prolonged, but not intermittent, XPO1 inhibition stably downregulates HOX/MEIS and induces differentiation in NPM1-mutated AML cells.
Prolonged XPO1 inhibition results in remarkable antileukemic activity in vivo in NPM1-mutated leukemic mice.
Abstract
NPM1 is the most frequently mutated gene in adults with acute myeloid leukemia (AML). The interaction between mutant NPM1 (NPM1c) and exportin-1 (XPO1) causes aberrant cytoplasmic dislocation of NPM1c and promotes the high expression of homeobox (HOX) genes, which is critical for maintaining the leukemic state of NPM1-mutated cells. Although there is a rationale for using XPO1 inhibitors in NPM1-mutated AML, selinexor administered once or twice per week did not translate into clinical benefit in patients with NPM1 mutations. Here, we show that this dosing strategy results in only a temporary disruption of the XPO1-NPM1c interaction, limiting the efficacy of selinexor. Because the second-generation XPO1 inhibitor eltanexor can be administered more frequently, we tested the antileukemic activity of prolonged XPO1 inhibition in NPM1-mutated AML models. Eltanexor caused irreversible HOX downregulation, induced terminal AML differentiation, and prolonged the survival of leukemic mice. This study provides essential information for the appropriate design of clinical trials with XPO1 inhibitors in NPM1-mutated AML.
Introduction
NPM1-mutated acute myeloid leukemia (AML) accounts for about one-third of AML in adults.1,2 The most distinguishing feature of NPM1-mutated cells is the aberrant localization of mutant NPM1 (NPM1c) in the cytoplasm,1 which is caused by the loss of a nucleolar localization signal and the gain of a nuclear export signal (NES) within the C-terminal end of NPM1.3 Both nuclear export and cytoplasmic accumulation are dependent on NPM1c interaction with the nuclear exporter exportin-1 (XPO1), which is mediated by the C-terminal NES.3,4 Another unique feature of NPM1-mutated AML is the high expression of homeobox (HOX) genes and their cofactors MEIS1 and PBX3 (hereafter collectively referred as to HOX/MEIS).5 We recently demonstrated that high HOX/MEIS levels are directly dependent on the interaction between NPM1c and XPO1 and are critical for maintaining the undifferentiated state of leukemic cells.6
The selective inhibitors of nuclear export selinexor and eltanexor covalently bind XPO1 and disrupt the interaction with its cargo proteins,7 including NPM1c.6 Preclinical studies with selinexor have demonstrated that XPO1 inhibition causes NPM1c nuclear relocation, loss of HOX expression, differentiation, and growth arrest of NPM1-mutated cells.6,8,9 However, patients with NPM1-mutated AML showed suboptimal responses to this compound in early-phase clinical trials.10-13 Selinexor has a half-life of 6 hours10 and can be administered once or twice per week as more frequent dosing significantly increases the incidence of adverse effects, particularly nausea and anorexia.14 Hence, we hypothesized that intermittent dosing may not stably inhibit the NPM1c-XPO1 interaction, limiting the efficacy of XPO1 inhibition as a therapeutic strategy.
Eltanexor is a second-generation XPO1 inhibitor with reduced blood-brain barrier penetration (∼30-fold) and mildly increased reversibility in XPO1 binding qualities.15 These characteristics lead to enhanced tolerability and wider therapeutic index of eltanexor compared with selinexor, enabling more frequent dosing. Because this compound is currently administered 5 days per week in early-phase trials,16,17 we investigated whether prolonged XPO1 inhibition by eltanexor would elicit a more pronounced antileukemic activity in NPM1-mutated cells than selinexor, making it suitable for successful clinical translation in NPM1-mutated AML.
Methods
Cell lines
Parental OCI-AML3 and IMS-M2 (harboring NPM1 mutation A), NPM1c-GFP OCI-AML3 (in-frame knock in of GFP at the NPM1c endogenous locus),6 dTAG OCI-AML3 (in-frame knock in of FKBP [F36V] and GFP at the NPM1c endogenous locus),6 and NPM1 wild-type (WT) OCI-AML2, KG-1, HNT-34, HL-60, MOLM-13, and K-562 cells were used for in vitro experiments.
PDXs and primary fresh AML samples
Leukemic cells from 2 patients with NPM1/FLT3/DNMT3A triple-mutated AML (patient-derived xenograft 2 (PDX2) and PDX3) were subcutaneously injected and propagated into new NSG recipient mice, following a protocol approved by the Ethics Committee of the University of Perugia. For in vitro experiments, single cell suspensions of PDX2 and PDX3 cells were grown in Iscove modified Dulbecco medium supplemented with cytokines. Leukemic cells isolated through Ficoll gradient from 4 fresh patient samples were cultured in Iscove modified Dulbecco medium supplemented with cytokines. NPM1 and FLT3 mutational status as well as karyotypes are reported in supplemental Figure 4E. The study was conducted following the Declaration of Helsinki and Good Clinical Practice. All patients signed an informed consent form, and the study was approved by the Ethics Committee of the University of Perugia (protocol #88471).
Generation of TP53 knockout cells and treatment with daunorubicin
For TP53KO in OCI-AML3 and dTAG OCI-AML3 cells, synthetic single guide RNAs (sgRNAs) were purchased from Synthego. Cas9/sgRNA ribonucleoproteins were generated by mixing and incubating for 30 minutes at room temperature 1 to 1.5 μg of Cas9 protein and 1 μg of sgRNA. The cells were transfected with Cas9/sgRNA ribonucleoproteins using the Neon Transfection System (Thermo Fisher Scientific) as previously described.18 Loss of p53 was verified by Sanger sequencing and immunoblot analysis using mouse anti-p53 and mouse anti–β-actin antibodies. The functionality of p53 and p53-downstream was verified by incubating WT and TP53KO cells with daunorubicin (50, 100, or 200 nM) for 48 hours. Cells were collected after 48 hours for protein and RNA purification. Immunoblot analysis was performed using mouse anti-p53, anti-p21, and anti–β-actin antibodies. Quantitative reverse transcription polymerase chain reaction analysis was performed to confirm p21 expression levels.
HOXA9/MEIS1 lentivirus production and transduction
For virus particle production, the pLV-Puro-EFS>hHOXA9:T2A:hMEIS1 lentiviral vector (Vector Builder) was cotransfected into 293FT cells with psPAX2 and pMD2.G plasmids (Addgene). The viral supernatant was collected 48 hours and 72 hours after transfection and was used to infect the OCI-AML3 cells along with polybrene (8 μg/mL). After 72 hours of infection, transduced cells were selected by the addition of 1 mg/mL puromycin. Untransduced cells were used as control for puromycin selection efficiency. The quantitative reverse transcription polymerase chain reaction analysis confirmed high HOXA9 and MEIS1 messenger RNA levels.
Treatment of cells with the XPO1 inhibitors selinexor and eltanexor
For live-cell fluorescence imaging, NPM1c-GFP OCI-AML3 cells were treated with 100 nM selinexor for 18 hours and then harvested, washed, resuspended in fresh medium (referred as drug washout), and left in culture for the following 24 hours while taking pictures. Nuclei were counterstained with Hoechst 33342. For gene expression and RNA-sequencing experiments, NPM1c-GFP and parental OCI-AML3 cells were treated with 50 nM selinexor or 0.3% dimethyl sulfoxide (DMSO) (control) for 24 hours (short treatment [ST]) followed by drug washout or continuously for 72 hours (continuous treatment [CT]). To study the effects of intermittent (2 days per week, ie, Monday and Thursday) and prolonged (5 days per week, ie, Monday to Friday) XPO1 inhibition on differentiation, AML cells and primary cells were treated for 11 days with either 50 nM selinexor 2 days per week, 100 nM selinexor 2 days per week, 50 nM eltanexor 2 days per week, 50 nM selinexor 5 days per week, 50 nM eltanexor 5 days per week, or 0.3% DMSO. Cell cycle analysis was performed using propidium iodide.
Treatment of dTAG OCI-AML3 cells with dTAG-13
For gene expression analysis, cells were treated with 500 nM dTAG-13 (Tocris Bioscience) or 0.3% DMSO (control) for 24 hours (ST), followed by drug washout, or continuously for 72 hours (CT). To study the effects of intermittent and prolonged selective NPM1c degradation on differentiation, parental and TP53KO cells were treated for 11 days with 500 nM dTAG-13 or 0.3% DMSO.
In vivo studies
Animal procedures were performed following the European Community guidelines and were approved by the Institutional Animal Care Committee of the University of Perugia and the Italian Ministry of Health (authorization #104/2020-PR). Female NSG mice (Charles River Europe) aged 8 to 10 weeks were injected IV with PDX2 and PDX3 cells stably transduced with the pHIV-Luc-ZsGreen vector (Addgene). For 1-week and 2-week end point experiments, PDX2-engrafted mice were divided into a vehicle, selinexor 2 days per week, selinexor 5 days per week, and eltanexor 5 days per week treatment groups and administered by oral gavage with vehicle (1% Tween-80, 0.5% methylcellulose), selinexor (5 mg/kg), or eltanexor (10 mg/kg) for 1 or 2 weeks. Mice were sacrificed on day 7 or 14, and bone marrow cells were isolated by crushing both the tibias and femurs. Leukemic engraftment was studied by CD45 flow cytometry. Engrafted human cells were fluorescence-activated cell sorted and used for HOX/MEIS gene expression study. In addition, spines were collected for immunohistochemical analysis. For survival experiments, PDX2 and PDX3 mice were split into 2 treatment groups and dosed with either the vehicle or eltanexor (10 mg/kg, oral galvage) for 4 consecutive weeks. Body weight was monitored twice weekly, and leukemic engraftment was monitored weekly using bioluminescence measurement.
Detailed methods of all the procedures are provided in the supplemental data.
Results
Only stable loss of the NPM1c-XPO1 interaction causes HOX/MEIS downregulation and differentiation
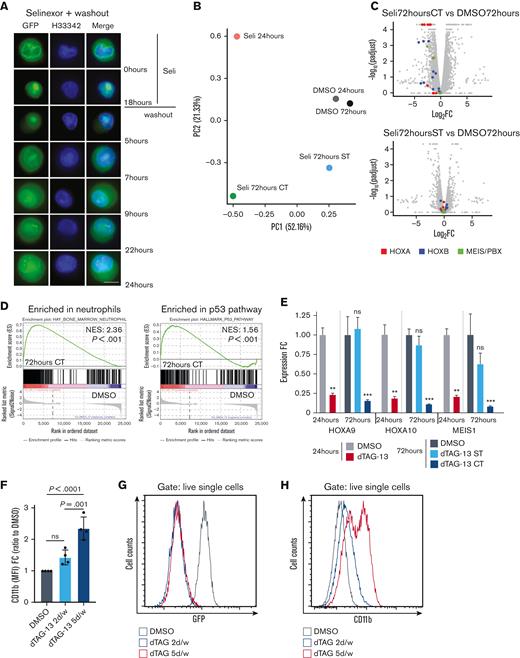
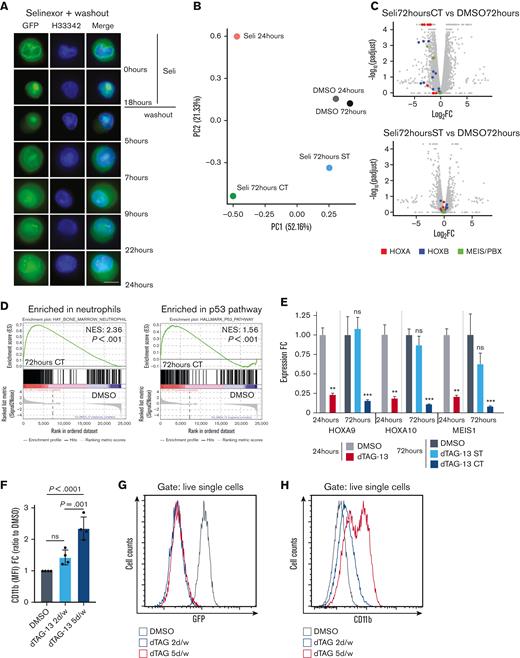
We first compared the impact of intermittent and stable XPO1 inhibition on NPM1c-XPO1 interaction. As NPM1c subcellular localization is dependent on its binding to XPO1 (ie, mostly cytoplasmic when interacting with XPO1 and nuclear when XPO1 is inhibited), we tracked the subcellular localization of endogenous NPM1c upon intermittent and stable XPO1 inhibition. To this end, we CRISPR-engineered the NPM1-mutated AML cell line, OCI-AML3, to express GFP fused to endogenous NPM1c (NPM1c-GFP). As expected, the NPM1c-GFP was almost completely relocated to the nucleus after incubating cells with selinexor for 18 hours (Figure 1A). Although NPM1c-GFP nuclear localization remained unchanged upon stable XPO1 inhibition (supplemental Figure 1A-B), drug withdrawal caused progressive cytoplasmic relocation (Figure 1A; supplemental Figure 1B), demonstrating the quick recovery of the NPM1c-XPO1 interaction following transient XPO1 inhibition. Transient and stable XPO1 inhibition by eltanexor resulted in NPM1c-GFP localization dynamics overlapping with those observed with selinexor (supplemental Figure 1C-D).
Prolonged XPO1 inhibition is necessary to elicit significant antileukemic activity in NPM1-mutated AML in vitro. (A) Fluorescence microscopy of NPM1c-GFP OCI-AML3 treated for 18 hours with selinexor 100 nM. After 18 hours, selinexor was removed from the medium, and cells were left in culture for the following 24 hours taking pictures at 5, 7, 9, 22, and 24 hours after drug washout. Hoechst 33342 was used to stain the nuclei. Original magnification ×100; scale bar, 5 μm. (B) Principal component analysis plot derived from the means (N = 2) of the fragments per kilobase of transcript per million mapped reads (FPKM) values of parental OCI-AML3 cells collected at 24 hours treated with either DMSO or selinexor 50 nM and OCI-AML3 cells collected at 72 hours treated with either DMSO, selinexor 50 nM ST (24 hours selinexor + 48 hours fresh medium) or selinexor 50 nM CT (72 hours selinexor). (C) Volcano plots depicting differentially expressed genes in parental OCI-AML3 cells treated for 72 hours with selinexor 50 nM CT (72 hours selinexor) and 72 hours selinexor 50 nM ST (24 hours selinexor + 48 hours fresh medium), compared with DMSO. Log2FC and log10p andjusted values are shown on the x- and y-axis, respectively. Genes belonging to the HOXA (red), HOXB (blue), and MEIS/PBX (green) families are highlighted. (D) Gene set enrichment analysis of RNA-sequencing data from parental OCI-AML3 cells treated for 72 hours with selinexor CT or DMSO. Enrichment plots for “Hay_bone_marrow_neutrophils” and “Hallmark_P53_pathway” gene sets are shown. Complete Gene Ontology and Molecular Signature Database enrichment data are provided in supplemental Table 2. (E) HOXA9, HOXA10, and MEIS1 expression by quantitative polymerase chain reaction (qPCR) in dTAG OCI-AML3 cells after 24 hours treatment with either DMSO or dTAG 500 nM, and 72 hours treatment with either DMSO, dTAG-13 500 nM ST (24 hours dTAG-13 + 48 hours fresh medium) or dTAG-13 500 nM CT (72 hours dTAG-13). N = 3, mean ± standard error of the mean (SEM), Tukey multiple comparison test. (F) Flow cytometry quantification of CD11b, expressed as MFI FC relative to DMSO in dTAG OCI-AML3 cells on day 11 following treatment with DMSO, dTAG-13 500 nM 2 days per week or dTAG-13 500 nM 5 days per week. N = 4, mean ± SEM, Tukey multiple comparison test. (G) Histogram plot representing NPM1c-GFP levels demonstrate efficient degradation of NPM1c upon dTAG-13 treatment. (H) Histogram plot representing CD11b expression analyzed by flow cytometry on day 11 in dTAG OCI-AML3 cells treated with either DMSO, dTAG-13 500 nM 2 days per week or dTAG-13 500 nM 5 days per week. d/w, days per week; FC, fold change; H33342, Hoechst 33342; MFI, median fluorescence intensity; ns, not significant; padjust, adjusted P value; PC, principal component; Seli, selinexor.
Prolonged XPO1 inhibition is necessary to elicit significant antileukemic activity in NPM1-mutated AML in vitro. (A) Fluorescence microscopy of NPM1c-GFP OCI-AML3 treated for 18 hours with selinexor 100 nM. After 18 hours, selinexor was removed from the medium, and cells were left in culture for the following 24 hours taking pictures at 5, 7, 9, 22, and 24 hours after drug washout. Hoechst 33342 was used to stain the nuclei. Original magnification ×100; scale bar, 5 μm. (B) Principal component analysis plot derived from the means (N = 2) of the fragments per kilobase of transcript per million mapped reads (FPKM) values of parental OCI-AML3 cells collected at 24 hours treated with either DMSO or selinexor 50 nM and OCI-AML3 cells collected at 72 hours treated with either DMSO, selinexor 50 nM ST (24 hours selinexor + 48 hours fresh medium) or selinexor 50 nM CT (72 hours selinexor). (C) Volcano plots depicting differentially expressed genes in parental OCI-AML3 cells treated for 72 hours with selinexor 50 nM CT (72 hours selinexor) and 72 hours selinexor 50 nM ST (24 hours selinexor + 48 hours fresh medium), compared with DMSO. Log2FC and log10p andjusted values are shown on the x- and y-axis, respectively. Genes belonging to the HOXA (red), HOXB (blue), and MEIS/PBX (green) families are highlighted. (D) Gene set enrichment analysis of RNA-sequencing data from parental OCI-AML3 cells treated for 72 hours with selinexor CT or DMSO. Enrichment plots for “Hay_bone_marrow_neutrophils” and “Hallmark_P53_pathway” gene sets are shown. Complete Gene Ontology and Molecular Signature Database enrichment data are provided in supplemental Table 2. (E) HOXA9, HOXA10, and MEIS1 expression by quantitative polymerase chain reaction (qPCR) in dTAG OCI-AML3 cells after 24 hours treatment with either DMSO or dTAG 500 nM, and 72 hours treatment with either DMSO, dTAG-13 500 nM ST (24 hours dTAG-13 + 48 hours fresh medium) or dTAG-13 500 nM CT (72 hours dTAG-13). N = 3, mean ± standard error of the mean (SEM), Tukey multiple comparison test. (F) Flow cytometry quantification of CD11b, expressed as MFI FC relative to DMSO in dTAG OCI-AML3 cells on day 11 following treatment with DMSO, dTAG-13 500 nM 2 days per week or dTAG-13 500 nM 5 days per week. N = 4, mean ± SEM, Tukey multiple comparison test. (G) Histogram plot representing NPM1c-GFP levels demonstrate efficient degradation of NPM1c upon dTAG-13 treatment. (H) Histogram plot representing CD11b expression analyzed by flow cytometry on day 11 in dTAG OCI-AML3 cells treated with either DMSO, dTAG-13 500 nM 2 days per week or dTAG-13 500 nM 5 days per week. d/w, days per week; FC, fold change; H33342, Hoechst 33342; MFI, median fluorescence intensity; ns, not significant; padjust, adjusted P value; PC, principal component; Seli, selinexor.
As in NPM1-mutated cells, high HOX/MEIS expression is directly dependent on the interaction between NPM1c and XPO1,6 we hypothesized that early loss of XPO1 inhibition may result in inefficient HOX/MEIS downregulation. We determined HOXA9, HOXA10, and MEIS1 expression in NPM1-GFP OCI-AML3 cells treated for 24 hours with either selinexor or eltanexor, at 72 hours in cells treated with either compound for 24 hours followed by 48 hours drug washout (ST), and in cells continuously treated for 72 hours (CT). While STs caused only transient downregulation of HOX/MEIS expression, CTs resulted in stable loss of these targets (supplemental Figure 2A-B). Next, to determine the impact of transient and stable XPO1 inhibition on the transcriptome of NPM1-mutated AML cells, we performed RNA sequencing in parental OCI-AML3 cells treated with selinexor, using the same strategy described earlier. Although after 24-hour incubation, the transcriptome of OCI-AML3 cells was clearly perturbed (410 differentially expressed genes), including downregulated HOX/MEIS (Figure 1B; supplemental Figure 2C-D; supplemental Tables 1 and 2), and drug withdrawal quickly reduced transcriptional perturbation in the following 48 hours with only 47 residual differentially expressed genes (Figure 1B-C; supplemental Figure 2D-E; supplemental Table 1). Conversely, CT for 72 hours caused persistent downregulation of HOX/MEIS, combined with upregulation of genes related to myeloid differentiation, p53 activation, and oxidative phosphorylation (488 differentially expressed genes) (Figure 1B-D; supplemental Figure 2D-E; supplemental Tables 1 and 2). As XPO1 interacts with multiple cargo proteins,7 to corroborate the hypothesis that the observed changes were mainly due to the loss of NPM1c-XPO1 interaction, we tested the effects of intermittent (2 days per week; eg, Monday and Thursday) and prolonged (5 days per week; eg, Monday to Friday) NPM1c degradation. To this end, we used CRISPR-engineered OCI-AML3 cells, in which endogenous NPM1c was fused to the FKBP(F36V) degron tag and GFP6 (dTAG OCI-AML3). This system enables the fast and specific degradation of NPM1c through the proteasome by incubating cells with the small compound dTAG-13.6 Only prolonged NPM1c degradation caused stable HOX/MEIS downregulation at 72 hours (Figure 1E) and differentiation, as demonstrated by a marked increase in CD11b expression levels (Figure 1F-H), perfectly mimicking that observed after XPO1 inhibition. Altogether, these results demonstrate that prolonged loss of the NPM1c-XPO1 interaction causes stable HOX/MEIS downregulation and differentiation in NPM1-mutated AML cells.
Loss of p53 minimally impacts differentiation upon XPO1 inhibition
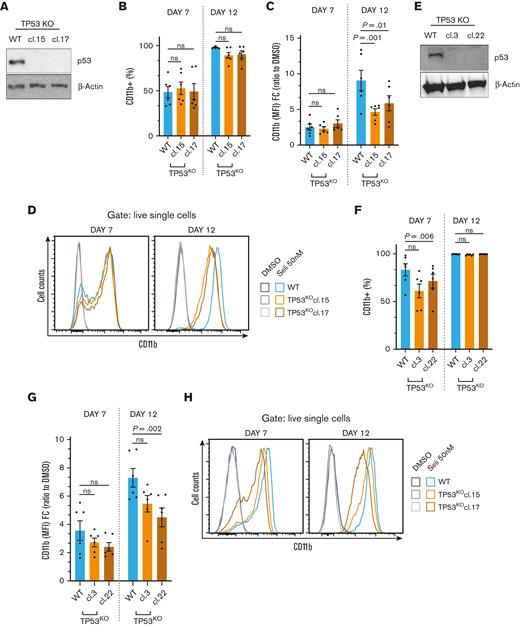
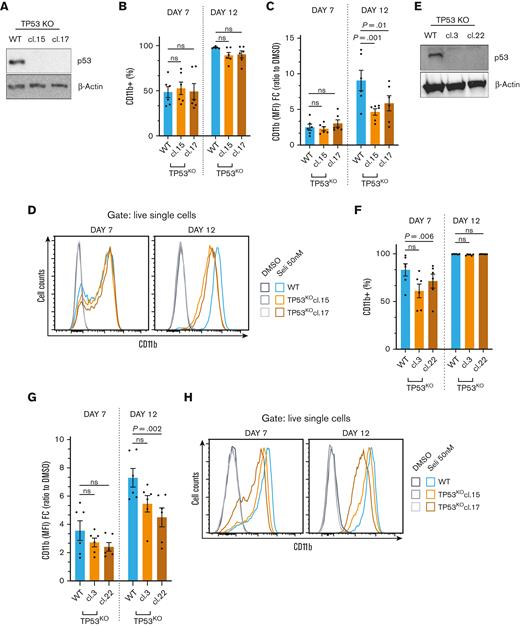
Previous work has suggested that p53 mediates at least part of the antileukemic effects of XPO1 inhibitors in NPM1-mutated cells, including differentiation.8 In this regard, Ranganathan et al demonstrated that the first-generation XPO1 inhibitor KPT-185 was able to induce p53 activation and differentiation in OCI-AML3 cells, which was dampened by p53 knockdown.8 Moreover, multiple p53 downstreams were also found upregulated in our RNA-sequencing data. Therefore, we sought to determine the impact of p53 on differentiation, following stable XPO1 inhibition. To this end, we knocked out TP53 (TP53KO) in OCI-AML3 cells using CRISPR/Cas9 to generate WT and TP53KO clones (Figure 2A; supplemental Figure 3A-B). We first explored the functionality of p53 in our model by incubating WT and TP53KO cells with daunorubicin for 48 hours. Daunorubicin significantly increased p53 and p21 levels in WT cells, whereas only a minimal induction of p21 was observed in TP53KO clones (supplemental Figure 3C-D). Next, we treated WT and TP53KO clones with the XPO1 inhibitor selinexor and observed remarkable differentiation, as measured by CD11b levels after 7 and 12 days of treatment, regardless of TP53 status (Figure 2B). However, the increase in CD11b, measured as the median fluorescence intensity, was slightly milder in TP53KO cells (Figure 2C-D). To confirm that differentiation can occur in the absence of p53 and to exclude confounding factors due to the high number of cargo proteins with which XPO1 inhibitors interferes, we assessed the impact of selective NPM1c degradation on the differentiation of WT and TP53KO dTAG OCI-AML3 cells (Figure 2E; supplemental Figure 3E). NPM1c degradation resulted in slightly delayed differentiation in 1 of the 2 TP53KO clones at early time points, whereas CD11b levels were similar after 12 days in WT and TP53KO dTAG clones (Figure 2F). However, there was a trend toward a lower CD11b increase in TP53KO cells (Figure 2G-H). We conclude that the impact of p53 on differentiation dynamics upon XPO1 inhibition is marginal, although significant.
Differentiation induced by prolonged XPO1 inhibition is marginally dependent on TP53. (A) Immunoblot analysis of p53 in WT and TP53KO OCI-AML3 clones 15 and 17. (B) Flow cytometry quantification of CD11b, expressed as percentage of CD11b+ cells in WT and TP53KO OCI-AML3 clones after 7 and 12 days of CT with selinexor 50 nM. N = 6, mean ± SEM, Dunnett multiple comparison test. (C) Flow cytometry quantification of CD11b, expressed as MFI FC relative to DMSO in WT and TP53KO OCI-AML3 clones after 7 and 12 days of CT with selinexor 50 nM. N = 6, mean ± SEM, Dunnett multiple comparison test. (D) Histogram plot showing CD11b expression in WT and TP53KO OCI-AML3 clones after 7 and 12 days of CT with DMSO or selinexor 50 nM. (E) Immunoblot analysis of p53 protein expression in WT and TP53KO dTAG OCI-AML3 clones 3 and 22. (F) Flow cytometry quantification of CD11b, expressed as percentage of CD11b+ cells in WT and TP53KO dTAG OCI-AML3 clones after 7 and 12 days of CT with selinexor 50 nM. N = 6, mean ± SEM, Dunnett multiple comparison test. (G) Flow cytometry quantification of CD11b, expressed as MFI FC relative to DMSO in WT and TP53KO dTAG OCI-AML3 clones after 7 and 12 days of CT with selinexor 50 nM. N = 6, mean ± SEM, Dunnett multiple comparison test. (H) Histogram plot showing CD11b expression in WT and TP53KO dTAG OCI-AML3 clones after 7 and 12 days of CT with DMSO or selinexor 50 nM. cl, clone.
Differentiation induced by prolonged XPO1 inhibition is marginally dependent on TP53. (A) Immunoblot analysis of p53 in WT and TP53KO OCI-AML3 clones 15 and 17. (B) Flow cytometry quantification of CD11b, expressed as percentage of CD11b+ cells in WT and TP53KO OCI-AML3 clones after 7 and 12 days of CT with selinexor 50 nM. N = 6, mean ± SEM, Dunnett multiple comparison test. (C) Flow cytometry quantification of CD11b, expressed as MFI FC relative to DMSO in WT and TP53KO OCI-AML3 clones after 7 and 12 days of CT with selinexor 50 nM. N = 6, mean ± SEM, Dunnett multiple comparison test. (D) Histogram plot showing CD11b expression in WT and TP53KO OCI-AML3 clones after 7 and 12 days of CT with DMSO or selinexor 50 nM. (E) Immunoblot analysis of p53 protein expression in WT and TP53KO dTAG OCI-AML3 clones 3 and 22. (F) Flow cytometry quantification of CD11b, expressed as percentage of CD11b+ cells in WT and TP53KO dTAG OCI-AML3 clones after 7 and 12 days of CT with selinexor 50 nM. N = 6, mean ± SEM, Dunnett multiple comparison test. (G) Flow cytometry quantification of CD11b, expressed as MFI FC relative to DMSO in WT and TP53KO dTAG OCI-AML3 clones after 7 and 12 days of CT with selinexor 50 nM. N = 6, mean ± SEM, Dunnett multiple comparison test. (H) Histogram plot showing CD11b expression in WT and TP53KO dTAG OCI-AML3 clones after 7 and 12 days of CT with DMSO or selinexor 50 nM. cl, clone.
Prolonged XPO1 inhibition is necessary to induce terminal differentiation of NPM1-mutated AML cells in vitro
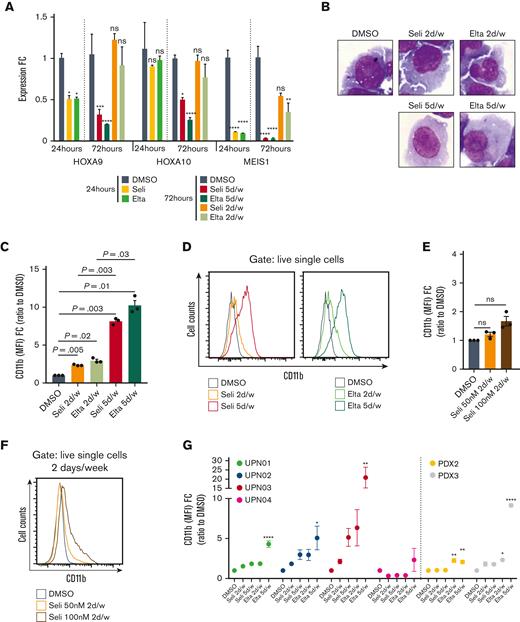
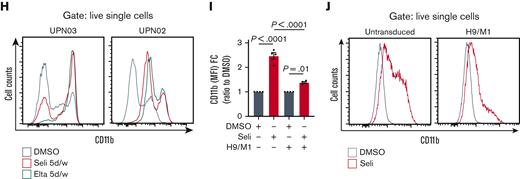
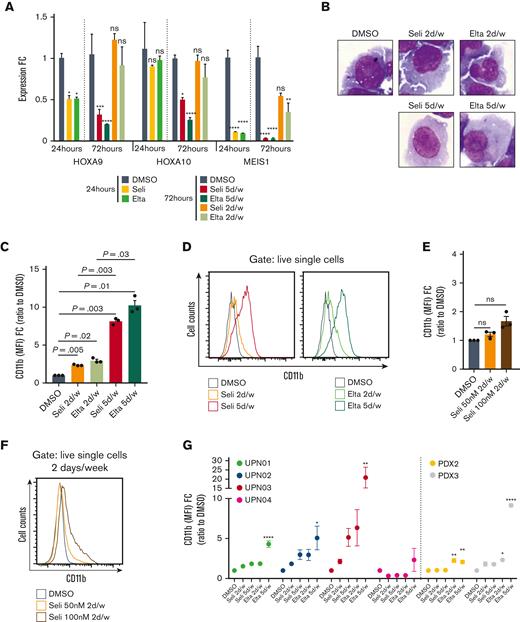
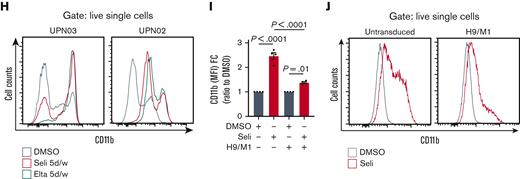
To determine whether prolonged XPO1 inhibition is necessary to achieve optimal antileukemic activity, we tested the ability of intermittent and prolonged XPO1 inhibition to induce early HOX/MEIS downregulation and differentiation of NPM1-mutated AML cells in vitro. To this end, we treated parental OCI-AML3 with selinexor or eltanexor for either 2 days per week or 5 days per week and analyzed the expression of HOXA9, HOXA10, and MEIS1 on days 1 and 3, as well as CD11b expression and morphology on day 11. Prolonged XPO1 inhibition resulted in the deepest HOX/MEIS downregulation, with the strongest effects observed on MEIS1 (Figure 3A). Moreover, while 5 days per week XPO1 inhibition resulted in marked differentiation, as measured by morphology and flow cytometry, intermittent XPO1 inhibition produced negligible effects (Figure 3B-D; supplemental Figure 4A). Furthermore, treating OCI-AML3 cells with double the concentration of selinexor for 2 days per week did not increase differentiation (Figure 3E-F). To test whether differentiation was followed by growth arrest, we analyzed the cell cycle. In agreement with the differentiation levels, after 11 days of treatment, the percentage of cells arrested in G0/G1 increased by only 9% and 11% in cells treated for 2 days per week with selinexor and eltanexor, respectively, whereas the increase reached 31% and 34% in cells treated 5 days per week with selinexor and eltanexor (supplemental Figure 4B). We also analyzed the effect of intermittent and prolonged XPO1 inhibition in the OCI-AML2 cell line, which does not harbor NPM1 mutations but expresses high HOX/MEIS. Either prolonged or intermittent XPO1 inhibition resulted in minimal changes in HOX/MEIS (supplemental Figure 4C) and no significant difference in morphology (supplemental Figure 4A) and flow cytometry (supplemental Figure 4D). Next, we explored the impact of intermittent and prolonged XPO1 inhibition on differentiation in 4 NPM1-mutated primary patient samples and 2 highly aggressive PDX models (PDX2 and PDX3).6 NPM1 and FLT3 mutational status and cytogenetics were reported for each patient and PDXs in supplemental Figure 4E. Five days per week 50 nM eltanexor induced the most significant increase in CD11b in all samples (Figure 3G-H). We concluded that prolonged XPO1 inhibition could induce the differentiation of NPM1-mutated AML cell lines, PDX, and primary fresh AML samples in vitro, which was most consistent with eltanexor and with no clear impact of FLT3 mutational status. Finally, to confirm that the differentiation observed in NPM1-mutated cells upon prolonged XPO1 inhibition is secondary to the loss of HOX/MEIS, we tested whether exogenous expression of HOXA9 and MEIS1, which is independent of the NPM1c-XPO1 interaction, inhibits the differentiation of leukemic cells. Lentiviral expression of HOXA9 and MEIS1 prevented the differentiation of OCI-AML3 cells upon stable XPO1 inhibition, resulting in a significantly lower expression of CD11b than that in untransduced cells (Figure 3I-J).
Prolonged XPO1 inhibition is necessary to induce terminal differentiation of NPM1-mutated cells in vitro. (A) HOXA9, HOXA10, and MEIS1 expression by qPCR in OCI-AML3 cells after 24 hours treatment with DMSO, selinexor, or eltanexor 50 nM; 72 hours treatment with DMSO, selinexor, or eltanexor 50 nM 5 days per week (72 hours treatment); and selinexor or eltanexor 2 days per week (24 hours treatment + 48 hours fresh medium). N = 3, mean ± SEM, Tukey multiple comparison test. (B) May-Grünwald Giemsa staining of OCI-AML3 cells on day 11 following treatment with either DMSO, selinexor, or eltanexor 50 nM 2 days per week and selinexor or eltanexor 50 nM 5 days per week. Original magnification ×40. Uncropped images are shown in supplemental Figure 4A. (C) Flow cytometry quantification of CD11b, expressed as MFI FC relative to DMSO in OCI-AML3 cells on day 11 of treatment with either DMSO, selinexor or eltanexor 50 nM 2 days per week and selinexor or eltanexor 50 nM 5 days per week. N = 3, mean ± SEM, Tukey multiple comparison test. (D) Histogram plots representing CD11b expression analyzed by flow cytometry on day 11 in OCI-AML3 cells treated with DMSO, selinexor, or eltanexor 50 nM 2 days per week and selinexor or eltanexor 50 nM 5 days per week. (E) Flow cytometry quantification of CD11b, expressed as MFI FC relative to DMSO in OCI-AML3 cells on day 11 of treatment with 2 days per week DMSO, selinexor 50 nM, or selinexor 100 nM. N = 3, mean ± SEM, Tukey multiple comparison test. (F) Histogram plot representing CD11b expression analyzed by flow cytometry on day 11 in OCI-AML3 cells treated with either DMSO and selinexor 50 nM or 100 nM 2 days per week. (G) Flow cytometry quantification of CD11b, expressed as MFI FC relative to DMSO in 4 primary NPM1-mutated AML samples and 2 PDXs after 7 to 9 days of treatment with DMSO, 50 nM selinexor or eltanexor 2 days per week, or 50 nM selinexor or eltanexor 5 days per week. N ≥ 2 for each patient/PDX, mean ± SEM, Tukey multiple comparison test on each patient/PDX. (H) Histogram plot representing CD11b expression analyzed by flow cytometry on day 7 in UPN03 and UPN02 primary AML cells treated with either DMSO or selinexor or eltanexor 50 nM 5 days per week. (I) Flow cytometry quantification of CD11b, expressed as MFI FC relative to DMSO in untransduced and HOXA9/MEIS1-transduced OCI-AML3 cells after 7 days of CT with either DMSO or selinexor 50 nM. N = 4, mean ± SEM, Tukey multiple comparison test. (J) Histogram plot showing CD11b expression analyzed by flow cytometry on day 7 in untransduced and HOXA9/MEIS1-transduced OCI-AML3 cells treated with either DMSO or selinexor 50 nM for 7 consecutive days. Elta, eltanexor; UPN, unique patient number; H9/M1, HOXA9/MEIS1.
Prolonged XPO1 inhibition is necessary to induce terminal differentiation of NPM1-mutated cells in vitro. (A) HOXA9, HOXA10, and MEIS1 expression by qPCR in OCI-AML3 cells after 24 hours treatment with DMSO, selinexor, or eltanexor 50 nM; 72 hours treatment with DMSO, selinexor, or eltanexor 50 nM 5 days per week (72 hours treatment); and selinexor or eltanexor 2 days per week (24 hours treatment + 48 hours fresh medium). N = 3, mean ± SEM, Tukey multiple comparison test. (B) May-Grünwald Giemsa staining of OCI-AML3 cells on day 11 following treatment with either DMSO, selinexor, or eltanexor 50 nM 2 days per week and selinexor or eltanexor 50 nM 5 days per week. Original magnification ×40. Uncropped images are shown in supplemental Figure 4A. (C) Flow cytometry quantification of CD11b, expressed as MFI FC relative to DMSO in OCI-AML3 cells on day 11 of treatment with either DMSO, selinexor or eltanexor 50 nM 2 days per week and selinexor or eltanexor 50 nM 5 days per week. N = 3, mean ± SEM, Tukey multiple comparison test. (D) Histogram plots representing CD11b expression analyzed by flow cytometry on day 11 in OCI-AML3 cells treated with DMSO, selinexor, or eltanexor 50 nM 2 days per week and selinexor or eltanexor 50 nM 5 days per week. (E) Flow cytometry quantification of CD11b, expressed as MFI FC relative to DMSO in OCI-AML3 cells on day 11 of treatment with 2 days per week DMSO, selinexor 50 nM, or selinexor 100 nM. N = 3, mean ± SEM, Tukey multiple comparison test. (F) Histogram plot representing CD11b expression analyzed by flow cytometry on day 11 in OCI-AML3 cells treated with either DMSO and selinexor 50 nM or 100 nM 2 days per week. (G) Flow cytometry quantification of CD11b, expressed as MFI FC relative to DMSO in 4 primary NPM1-mutated AML samples and 2 PDXs after 7 to 9 days of treatment with DMSO, 50 nM selinexor or eltanexor 2 days per week, or 50 nM selinexor or eltanexor 5 days per week. N ≥ 2 for each patient/PDX, mean ± SEM, Tukey multiple comparison test on each patient/PDX. (H) Histogram plot representing CD11b expression analyzed by flow cytometry on day 7 in UPN03 and UPN02 primary AML cells treated with either DMSO or selinexor or eltanexor 50 nM 5 days per week. (I) Flow cytometry quantification of CD11b, expressed as MFI FC relative to DMSO in untransduced and HOXA9/MEIS1-transduced OCI-AML3 cells after 7 days of CT with either DMSO or selinexor 50 nM. N = 4, mean ± SEM, Tukey multiple comparison test. (J) Histogram plot showing CD11b expression analyzed by flow cytometry on day 7 in untransduced and HOXA9/MEIS1-transduced OCI-AML3 cells treated with either DMSO or selinexor 50 nM for 7 consecutive days. Elta, eltanexor; UPN, unique patient number; H9/M1, HOXA9/MEIS1.
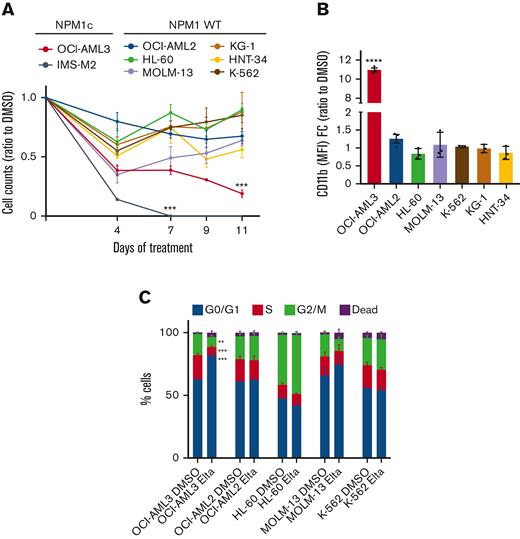
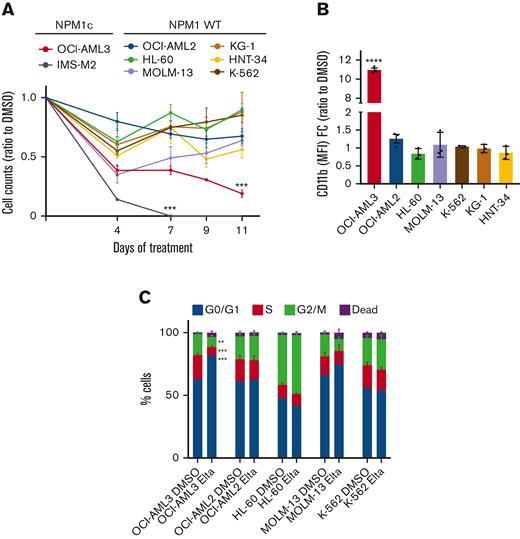
As XPO1 inhibition is predicted to exert anticancer activity against multiple tumor subtypes, including NPM1 WT AML, we compared the effects of prolonged XPO1 inhibition by eltanexor on cell growth and differentiation in 2 NPM1-mutated (OCI-AML3 and IMS-M2) and 6 NPM1 WT AML cell lines (OCI-AML2, HL-60, MOLM-13, KG-1, HNT-34, and K-562). Fifty nM 5 days per week eltanexor inhibited the growth of NPM1-mutated cell lines more efficiently than NPM1 WT cell lines (Figure 4A). Accordingly, prolonged XPO1 inhibition by eltanexor induced significant differentiation of NPM1-mutated OCI-AML3 cells but not of NPM1 WT cells (Figure 4B). Moreover, cell cycle analysis performed on day 11 in OCI-AML3 and 4 NPM1 WT cell lines confirmed that only the NPM1-mutated cells underwent significant cell cycle arrest in G0/G1 (Figure 4C). We concluded that prolonged XPO1 inhibition induces more pronounced growth inhibition and differentiation in NPM1-mutated cell lines than in NPM1 WT ones.
Prolonged XPO1 inhibition preferentially inhibits growth and induces differentiation of NPM1-mutated cell lines. (A) Viable cell counts by trypan blue exclusion of indicated NPM1-mutated and NPM1 WT cell lines treated with 50 nM eltanexor for 11 days. Cells were counted and replated at equal concentrations with fresh drugs every 3 days. Results are reported as ratio to DMSO-treated cells. N = 3, mean ± SEM, Dunnett multiple comparison test. (B) Flow cytometry quantification of CD11b, expressed as MFI FC relative to DMSO in OCI-AML3 and indicated NPM1 WT cell lines after 11 days of treatment with eltanexor 50 nM 5 days per week. N = 3, mean ± SEM, Sidak multiple comparison test for each cell line. (C) Cell cycle analysis by propidium iodide of OCI-AML3 and indicated NPM1 WT cell lines after 11 days of treatment with eltanexor 50 nM 5 days per week. N = 3, mean ± SEM, Tukey multiple comparison test.
Prolonged XPO1 inhibition preferentially inhibits growth and induces differentiation of NPM1-mutated cell lines. (A) Viable cell counts by trypan blue exclusion of indicated NPM1-mutated and NPM1 WT cell lines treated with 50 nM eltanexor for 11 days. Cells were counted and replated at equal concentrations with fresh drugs every 3 days. Results are reported as ratio to DMSO-treated cells. N = 3, mean ± SEM, Dunnett multiple comparison test. (B) Flow cytometry quantification of CD11b, expressed as MFI FC relative to DMSO in OCI-AML3 and indicated NPM1 WT cell lines after 11 days of treatment with eltanexor 50 nM 5 days per week. N = 3, mean ± SEM, Sidak multiple comparison test for each cell line. (C) Cell cycle analysis by propidium iodide of OCI-AML3 and indicated NPM1 WT cell lines after 11 days of treatment with eltanexor 50 nM 5 days per week. N = 3, mean ± SEM, Tukey multiple comparison test.
Altogether, these results demonstrate that only prolonged XPO1 inhibition induces the differentiation of NPM1-mutated cells and confirmed that a persistent loss of the NPM1c-XPO1 interaction along with stable HOX/MEIS downregulation is required to achieve terminal differentiation.
Prolonged XPO1 inhibition is necessary to achieve optimal antileukemic activity in NPM1-mutated AML in vivo
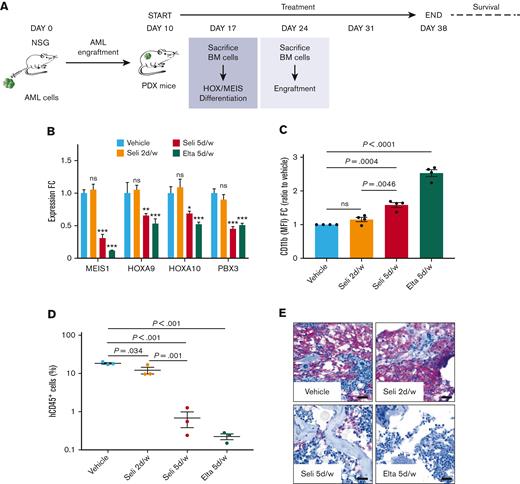
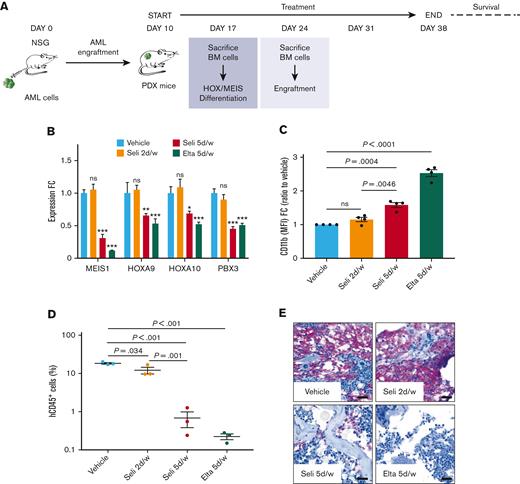
To establish the antileukemic activity of prolonged XPO1 inhibition in NPM1-mutated AML, we compared intermittent and prolonged XPO1 inhibition in vivo, using 2 highly aggressive NPM1/FLT3/DNMT3A triple-mutated luciferase-expressing PDX models (PDX2 and PDX3). First, we investigated the ability of prolonged and intermittent XPO1 inhibition to induce HOX/MEIS downregulation and differentiation. To this end, we treated immunodeficient (NSG) mice engrafted with PDX2 cells with the vehicle, selinexor 2 days per week, selinexor 5 days per week, or eltanexor 5 days per week for 1 week (Figure 5A). Five days per week XPO1 inhibition with either selinexor or eltanexor caused HOX/MEIS downregulation and differentiation of leukemic cells (Figure 5B-C), whereas 2 days per week treatment did not induce any change compared the vehicle. Next, we determined the capacity of intermittent and prolonged XPO1 inhibition to affect the leukemic engraftment of PDX2 cells. We treated NSG mice for 2 consecutive weeks using the same strategy as described above. Consistent with HOX/MEIS downregulation and differentiation observed in the previous experiment, only 5 days per week regimens caused significant engraftment reduction (Figure 5D-E). Taken together, these results demonstrated that prolonged XPO1 inhibition is necessary to achieve optimal antileukemic activity against NPM1-mutated AML in vivo.
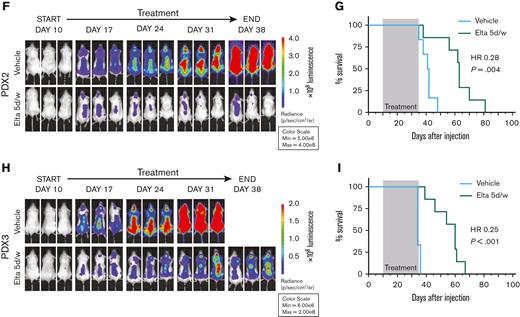
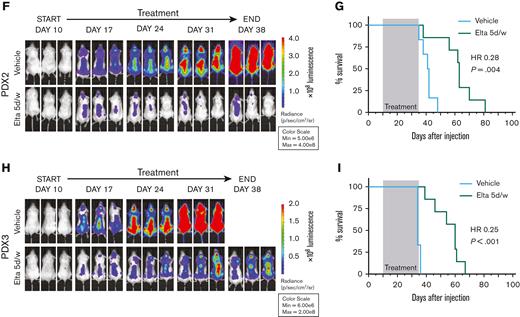
Prolonged XPO1 inhibition is necessary to elicit significant antileukemic activity in NPM1-mutated AML in vivo. (A) Schematic overview of the in vivo experiments. Each NSG mouse was transplanted with 1 × 10⁶ GFP-Luc+ PDX cells. (B) HOXA9, HOXA10, MEIS1, and PBX3 expression by qPCR in sorted PDX2 cells after 7 days of treatment with the vehicle, selinexor 5 mg/kg 2 days per week, selinexor 5 mg/kg 5 days per week, or eltanexor 10 mg/kg 5 days per week. N = 4 mice per group, mean ± SEM, Dunnett multiple comparison test. (C) Flow cytometry quantification of human CD11b, expressed as MFI FC relative to vehicle in sorted PDX2 cells after 7 days of treatment with the vehicle, selinexor 5 mg/kg 2 days per week, selinexor 5 mg/kg 5 days per week, or eltanexor 10 mg/kg 5 days per week. N = 4 mice per group, mean ± SEM, Tukey multiple comparison test. (D) Bone marrow (BM) engraftment of PDX2 cells measured as human CD45 percentage of positive cells after 2 weeks of treatment with the vehicle, selinexor 5 mg/kg 2 days per week, selinexor 5 mg/kg 5 days per week, or eltanexor 10 mg/kg 5 days per week. N = 3 mice per group, mean ± SEM, Tukey multiple comparison test. (E) Representative images of BM histological sections stained for human CD45 after 14 days of treatment with the vehicle, selinexor 5 mg/kg 2 days per week, selinexor 5 mg/kg 5 days per week, or eltanexor 10 mg/kg 5 days per week. Original magnification ×40; scale bars, 20 μm. (F) Representative bioluminescence images of NSG mice transplanted with PDX2 cells treated with either the vehicle (N = 6) or eltanexor 10 mg/kg (N = 7) 5 days per week for 4 weeks. (G) The Kaplan-Meier curves of PDX2 mice treated with either vehicle (N = 6) or eltanexor 10 mg/kg (N = 7) 5 days per week for 4 weeks. Treatment time is shown in light gray. Log-rank (Mantel-Cox) test. (H) Representative bioluminescence images of NSG mice transplanted with PDX3 cells and treated with either the vehicle (N = 6) or eltanexor 10 mg/kg (N = 7) 5 days per week for 4 weeks. (I) The Kaplan-Meier curves of PDX3 mice treated with either vehicle (N = 6) or eltanexor 10 mg/kg (N = 7) 5 days per week for 4 weeks. Treatment time is shown in light gray. Log-rank (Mantel-Cox) test. HR; hazard ratio.
Prolonged XPO1 inhibition is necessary to elicit significant antileukemic activity in NPM1-mutated AML in vivo. (A) Schematic overview of the in vivo experiments. Each NSG mouse was transplanted with 1 × 10⁶ GFP-Luc+ PDX cells. (B) HOXA9, HOXA10, MEIS1, and PBX3 expression by qPCR in sorted PDX2 cells after 7 days of treatment with the vehicle, selinexor 5 mg/kg 2 days per week, selinexor 5 mg/kg 5 days per week, or eltanexor 10 mg/kg 5 days per week. N = 4 mice per group, mean ± SEM, Dunnett multiple comparison test. (C) Flow cytometry quantification of human CD11b, expressed as MFI FC relative to vehicle in sorted PDX2 cells after 7 days of treatment with the vehicle, selinexor 5 mg/kg 2 days per week, selinexor 5 mg/kg 5 days per week, or eltanexor 10 mg/kg 5 days per week. N = 4 mice per group, mean ± SEM, Tukey multiple comparison test. (D) Bone marrow (BM) engraftment of PDX2 cells measured as human CD45 percentage of positive cells after 2 weeks of treatment with the vehicle, selinexor 5 mg/kg 2 days per week, selinexor 5 mg/kg 5 days per week, or eltanexor 10 mg/kg 5 days per week. N = 3 mice per group, mean ± SEM, Tukey multiple comparison test. (E) Representative images of BM histological sections stained for human CD45 after 14 days of treatment with the vehicle, selinexor 5 mg/kg 2 days per week, selinexor 5 mg/kg 5 days per week, or eltanexor 10 mg/kg 5 days per week. Original magnification ×40; scale bars, 20 μm. (F) Representative bioluminescence images of NSG mice transplanted with PDX2 cells treated with either the vehicle (N = 6) or eltanexor 10 mg/kg (N = 7) 5 days per week for 4 weeks. (G) The Kaplan-Meier curves of PDX2 mice treated with either vehicle (N = 6) or eltanexor 10 mg/kg (N = 7) 5 days per week for 4 weeks. Treatment time is shown in light gray. Log-rank (Mantel-Cox) test. (H) Representative bioluminescence images of NSG mice transplanted with PDX3 cells and treated with either the vehicle (N = 6) or eltanexor 10 mg/kg (N = 7) 5 days per week for 4 weeks. (I) The Kaplan-Meier curves of PDX3 mice treated with either vehicle (N = 6) or eltanexor 10 mg/kg (N = 7) 5 days per week for 4 weeks. Treatment time is shown in light gray. Log-rank (Mantel-Cox) test. HR; hazard ratio.
Finally, to test the impact of prolonged XPO1 inhibition on AML growth in vivo and on survival, we treated both PDX2 and PDX3 mice with eltanexor 5 days per week for 4 consecutive weeks. Treatment with eltanexor resulted in a remarkable reduction of bioluminescence and prolonged survival in both PDX2 (Figure 5F-G; supplemental Figure 5A-B) and PDX3 (Figure 5H-I; supplemental Figure 6A-B) models, compared with the vehicle. The treatment was well tolerated with no reported progressive weight loss (supplemental Figures 5C and 6C). These data establish that prolonged XPO1 inhibition is effective against NPM1-mutated AML and encourage testing of second-generation XPO1 inhibitors in patients with NPM1 mutations.
Discussion
Despite its high sensitivity to chemotherapy, NPM1-mutated AML remains an incurable disease in ∼50% of patients. Although specific targeting of NPM1c has been challenging so far,2,19 venetoclax-based regimens and menin–MLL inhibitors have recently proven effective in NPM1-mutated AML.20-24 Therefore, there is growing interest in developing new targeted therapies for this entity.25
We have previously demonstrated that irreversible genetic or pharmacologic disruption of the NPM1c-XPO1 interaction invariably results in HOX/MEIS downregulation, differentiation, and growth arrest of NPM1-mutated cells, regardless of co-occurring mutations.6 Hence, interfering with their reciprocal binding should be effective against NPM1-mutated AML. However, the selective XPO1 inhibitor selinexor, which was originally developed as a pancancer agent26 and is now approved for the treatment of multiple myeloma and diffuse large B-cell lymphoma in the United States, has not resulted in clinical benefit in NPM1-mutated AML.10-13
Here, we provide evidence that this lack of benefit is due to the intermittent XPO1 inhibition provided by selinexor, leading to only transient disruption of the NPM1c-XPO1 interaction, with negligible consequences on the leukemic phenotype of NPM1-mutated cells. By contrast, the new selective XPO1-inhibitor eltanexor, which has been tested in early-phase clinical studies and shows a toxicity profile different from that of selinexor, can be dosed 5 days per week.16,17 Hence, eltanexor should provide more stable XPO1 inhibition, which we demonstrated to be essential to target NPM1-mutated AML. Indeed, 5 days per week XPO1 inhibition stably downregulates HOX/MEIS, induces terminal differentiation, and results in prolonged survival of NPM1-mutated PDX mice.
However, the mechanism by which XPO1 inhibition results in HOX/MEIS downregulation remains unclear. The rapid decrease in HOX/MEIS levels observed upon XPO1 inhibition and selective degradation6 and the immediate recovery following drug washout would imply a direct role of NPM1c in promoting HOX/MEIS expression. This hypothesis was supported by previous studies that demonstrated that NPM1 is important for ribosomal RNA transcription27 and that NPM1c can be recruited at HOX/MEIS loci by chromatin-prebound XPO1.28 However, how NPM1c actually promotes transcription of HOX/MEIS remains to be determined.
Previous studies have shown that increased nuclear concentration of p53 upon XPO1 inhibition causes p53 downstream activation, differentiation, and apoptosis of leukemic cells.8 Indeed, our RNA-sequencing data demonstrated increased expression of p53 downstreams upon XPO1 inhibition. However, experiments in NPM1-mutated TP53KO cells clearly showed that terminal differentiation can be achieved by stable XPO1 inhibition, regardless of p53 status.
Our in vitro experiments on cell lines, PDX, and primary samples comparing equal concentrations of selinexor and eltanexor showed that the 2 compounds are at least equally effective, with eltanexor showing signals of higher efficacy, particularly in terms of differentiation induction. Two preclinical studies have previously suggested the superior antileukemic activity of eltanexor over selinexor, with no specific focus on NPM1.15,29 In this regard, we cannot exclude the possibility that mechanisms other than those involving NPM1c contribute to the phenotype observed upon prolonged XPO1 inhibition in NPM1-mutated cells. However, data from dTAG cells, TP53KO cells, and multiple parental cell lines, together with our previous data on the genetic disruption of the NPM1c NES,6 establish that persistent inhibition of the interaction between NPM1c and XPO1 represents a promising and rationale-targeted strategy whose mechanistic consequences, in the context of NPM1-mutated AML, go beyond the canonical effects of XPO1 inhibitors.
In conclusion, we believe that prolonged XPO1 inhibition by eltanexor deserves further clinical testing in NPM1-mutated AML. As phase 1 data of eltanexor have shown that it can be safely administered 5 days per week,16 this study lays the groundwork for the appropriate design of phase 2 and 3 studies with XPO1 inhibitors in NPM1-mutated AML.
Acknowledgments
This work has been supported by the Associazione Italiana per la Ricerca sul Cancro (AIRC Start-Up grant 2019 #22895) and the European Research Council (ERC Advanced grant 2016 #740230 and ERC Consolidators Grant 2016 #725725).
Authorship
Contribution: G.P., B.F., and L.B. conceived the study; G.P., A.G., F.R., A.M., E.P., and S.P. performed in vitro experiments; B.B. performed immunohistochemical analysis; G.P. and F.M. performed in vivo experiments; S.C. and C.Q. performed RNA sequencing; V.T. and G.S. performed bioinformatic analysis; M.P.M., P.G., P.S., F.L., S.S., and Y.L. provided reagents and critical inputs; G.P., A.G., B.F., and L.B. analyzed the results and wrote the manuscript; and all the authors provided input.
Conflict-of-interest disclosure: L.B. declares consultancy at scientific advisory boards for AbbVie and Amgen. B.F. licensed a patent on NPM1 mutants (#102004901256449). B.F. and M.P.M. declare honoraria from Rasna Therapeutics, Inc for scientific advisor activities. M.P.M. also declares honoraria/consultancy at scientific advisory board for AbbVie, Amgen, Celgene, Janssen, Novartis, Pfizer, and Jazz Pharmaceuticals. P.S. declares honoraria/consultancy at scientific advisory board for AbbVie, Janssen, Novartis, AstraZeneca, and Incyte. Y.L and S.S. are employees and stockholders of Karyopharm Therapeutics, Inc. F.L. reported receiving personal fees from Amgen speakers’ bureau and advisory board membership, Novartis speakers’ bureau and advisory board membership, Bellicum Pharmaceuticals advisory board membership, Miltenyi speakers’ bureau, Jazz Pharmaceutical speakers’ bureau, Takeda speakers’ bureau, Neovii advisory board membership, and Medac speakers’ bureau outside the submitted work. The remaining authors declare no competing financial interests.
Correspondence: Lorenzo Brunetti, Hematology, Department of Medicine and Surgery, Center for Hemato-Oncological, University of Perugia, Piazzale G. Menghini 9, S.Andrea, 06132, Perugia, Italy; e-mail: lorenzo.brunetti@unipg.it; and Brunangelo Falini, Hematology, Department of Medicine and Surgery, Center for Hemato-Oncological, University of Perugia, Piazzale G. Menghini 9, S.Andrea, 06132, Perugia, Italy; e-mail: brunangelo.falini@unipg.it.
References
Author notes
Data are available on request from the corresponding authors, Lorenzo Brunetti (lorenzo.brunetti@unipg.it) and Brunangelo Falini (brunangelo.falini@unipg.it).
The full-text version of this article contains a data supplement.
G.P. and A.G. are joint first authors.
B.F. and L.B. are joint senior authors.

