Key Points
Inflammatory stimulation promotes BCR-ABL1+ B-ALL disease progression by upregulating AID.
Combination of imatinib and Hsp90 inhibitors significantly delays the inflammation-induced progression of BCR-ABL1+ B-ALL.

Abstract
Inflammation contributes to the initiation and disease progression of several lymphoid malignancies. BCR-ABL1-positive B-cell acute lymphoblastic leukemia (BCR-ABL1+ B-ALL) is triggered by the malignant cloning of immature B cells promoted by the BCR-ABL1 fusion gene. However, it is unclear whether the mechanism driving the disease progression of BCR-ABL1+ B-ALL involves inflammatory stimulation. Here, we evaluate BCR-ABL1+ B-ALL cells’ response to inflammatory stimuli lipopolysaccharide (LPS) in vitro and in vivo. The results indicate that LPS promotes cell growth and genomic instability in cultured BCR-ABL1+ B-ALL cells and accelerates the BCR-ABL1+ B-ALL development in a mouse model. We show that the LPS-induced upregulation of activation-induced deaminase (AID) is required for the cell growth and disease progression of BCR-ABL1+ B-ALL. Moreover, AID modulates the expression of various genes that are dominated by suppressing apoptosis genes and upregulating DNA damage-repair genes. These genes lead to facilitation for BCR-ABL1+ B-ALL progression. The heat shock protein 90 (Hsp90) inhibitors significantly reduce AID protein level and delay the disease progression of BCR-ABL1+ B-ALL upon inflammatory stimulation. The present data demonstrate the causative role of AID in the development and progression of BCR-ABL1+ B-ALL during inflammation, thus highlighting potential therapeutic targets.
Introduction
Formation of the BCR-ABL1 fusion gene via t(9;22) translocation represents the transformation driver of chronic myeloid leukemia (CML) and 25% to 30% B-cell acute lymphoblastic leukemia (B-ALL). The tyrosine kinase activity of Bcr-Abl encoded by the BCR-ABL1 gene might be sufficient to induce malignant transformation, enable cells to evade apoptosis, and ensure unlimited replicative potential.1 Tyrosine kinase inhibitors are effective therapeutic agents for CML but exhibit poor efficacy in patients with BCR-ABL1+ B-ALL.2 Thus, additional therapeutic targets are needed to control BCR-ABL1+ B-ALL.
Hematopoietic neoplasms are typically associated with immunodeficiency that results in severe and recurrent infections in patients.3 Inflammation not only mediates immune tolerance to support cell survival but also triggers the requisite secondary mutational events to lead disease progression of ALL.4,5 ETV6-RUNX1+ B-ALL and B-ALL with inherited mutations of PAX5 have been demonstrated that inflammation provokes the formation of B-ALL by eliminating normal B-cell clones and selectively enhancing the growth of B-cell clones with preleukemic genetic lesions.6-8 However, it is unclear whether inflammation promotes the disease progression of BCR-ABL1+ B-ALL.
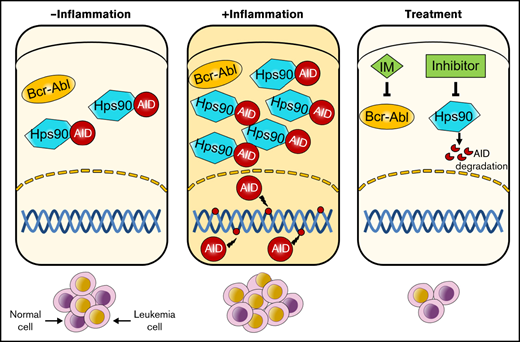
Humoral immunity depends on high-affinity antibodies that neutralize the invading antigens. Upon activation by antigen collision, activated B cells further diversify B-cell receptors through 2 independent steps: somatic hypermutation (SHM) and class switch recombination (CSR). Activation-induced deaminase (AID) deaminates cytidines into uracils on variable or constant regions of immunoglobulin genes in activated B cells, causing mutations or DNA double-stranded breaks to mediate SHM and CSR.9 Given its mutagenic potential, the expression and activity of AID are strictly regulated at multiple levels. Transcription factors nuclear factor-κB (NF-κB), Blimp1, Pax5, and Id2 control AID expression and microRNAs regulate AID mRNA stability at a transcriptional level.10 Protein kinase A phosphorylates threonine 27 or serine 38 on AID to influence AID activity in a posttranscriptional manner.11 Beyond transcription, subcellular localization of AID is a crucial regulatory mechanism for ensuring its functional steady levels. AID acts in the nucleus but localizes predominately to the cytoplasm because heat shock protein 90 (Hsp90) protects cytoplasmic AID from proteasomal degradation.12-14 Although several mechanisms control AID DNA mutant activity, chronic inflammation is seemingly sufficient for enhancing expression of AID in nongerminal center B cells, which introduces mutations on non-immunoglobulin genes, such as oncogenes, tumor suppressor genes, and DNA repair genes.15-17 Furthermore, previous studies suggest that Bcr-Abl kinase activity upregulates AID expression to enhance genetic instability, which contributes to blast crisis progression of CML and leukemogenesis of BCR-ABL1+ B-ALL.18-20 However, whether AID is involved in the disease progression of BCR-ABL1+ B-ALL upon inflammation has not been characterized previously.
The purpose of our study is to explore how inflammation promotes the progression of BCR-ABL1+ B-ALL. To this end, we demonstrate that inflammation induces abnormal expression of AID, which alters the expression of genes associated with cell survival and DNA damage repair to provoke the initiation and progression of BCR-ABL1+ B-ALL. We also show that Hsp90 inhibition reduces the expression of AID and decelerates the development of inflammation-stimulated BCR-ABL1+ B-ALL, thus highlighting a potential therapeutic strategy.
Methods
BCR-ABL1+ B-ALL mouse model
Six- to 8-week-old C57BL/6 mice (weight, 18-20 g) were obtained and raised in the laboratory animal center of Xi’an Jiaotong University under specific pathogen-free conditions. All animal experiments were reviewed and approved by the Institutional Animal Care and Use Committee of Xi’an Jiaotong University. The BCR-ABL1+ B-ALL mouse model was constructed as previously described.21 Bone marrow (BM) cells were flushed from the donor mice femurs and tibias. The BM cells were then transduced twice with MSCV-BCR-ABL1-IRES-GFP retroviral supernatants containing interleukin (IL)-7 (10 ng/mL; PeproTech) and 5% WEHI-3B-conditioned medium as a source of IL-3 in the presence of 20 µg/mL polybrene (Solarbio Science & Technology, Beijing, China). After centrifugation at 1000g for 1.5 hours and incubation for 2 hours, the cells were washed and resuspended with Hanks balanced salt solution (Solarbio Science & Technology). Later, 1 × 10⁶ cells were injected into lethally irradiated (2 × 460 cGy) C57BL/6 mice by tail-vein intravenous route. Leukemogenesis in recipient mice was monitored by measuring the percentage of GFP+ cells in peripheral blood every 7 days. The recipient mice were euthanized after indications of weight loss, limb paralysis, and splenomegaly.
Secondary transplantation of BCR-ABL1+ B-ALL mouse model
BM was isolated from primary BCR-ABL1+ B-ALL mice. After elimination of red blood cells, CD19+ cells were isolated using CD19 MicroBeads (Miltenyi Biotec) on a MACS column (Miltenyi Biotec). The CD19+ cells were further confirmed by GFP+ population. CD19+GFP+ cells indicated BCR-ABL1+ B-ALL cells were cultured in Iscove modified Dulbecco medium (Hyclone; Cytiva) containing 10% fetal bovine serum (FBS), nonessential amino acids and 1% penicillin-streptomycin, and β-mercaptoethanol (50 µM) at 37°C with 5% CO2.
A total of 25 µg/mL lipopolysaccharide (LPS) (L2880; Sigma-Aldrich) was used as a simulation of inflammation but not sepsis.22 The control cells were treated with equal volumes of phosphate-buffered saline (PBS). For secondary transplantation, the BCR-ABL1+ B-ALL cells were treated with LPS or PBS for 4 days, then 1 × 10⁴BCR-ABL1+ B-ALL cells and 1 × 10⁶ BM cells of healthy mice were mixed and transplanted into lethally irradiated secondary recipient mice.23 Recipient mice were monitored for leukemia progression and morbidity as mentioned previously.
In vitro drug treatments
For this serum-starved experiment, the cells were cultured with FBS-deficient Iscove modified Dulbecco medium supplemented with nonessential amino acids, penicillin-streptomycin, and β-mercaptoethanol (50 µM) for 72 hours. For Hsp90 inhibition experiments, 17-DMAG (S1142; Selleck) was dissolved in dimethyl sulfoxide (DMSO) and stored at −80°C, novobiocin (491207; Sigma-Aldrich) was dissolved in water and stored at −20°C. Cells were treated with LPS (25 µg/mL) and 17-DMAG (0, 0.5, 1, 2, and 3 µM) or LPS (25 µg/mL) and novobiocin (0, 0.1, 0.3, 0.5, and 1 mM), respectively, for 24 hours. For the proteasome inhibition experiment, proteasome inhibitor MG-132 (S2619; Selleck) was dissolved in DMSO and stored at −80°C. Cells were treated with LPS (25 µg/mL) and 17-DMAG (0, 3 µM) or LPS (25 µg/mL) and novobiocin (0 and 1 mM) for 24 hours, followed by treatment with MG132 (0 and 10 µM) during the last 12 hours.
In vivo treatments of mice
From day 10 after transplantation, the recipient mice were treated once daily with 50 mg/kg imatinib (IM) (S1026; Selleck) in 0.2 mL 0.5% CMC-Na (S6703; Selleck) or 0.5% CMC-Na as a control by gavage. The 17-DMAG was dissolved in 5% DMSO + 40% PEG300 + 5% Tween-80 + 50% water, and novobiocin was dissolved in water. The 17-DMAG (25 mg/kg) and novobiocin (100 mg/kg) were administered by intraperitoneal injection, once daily. The treatments were continued until the recipient mice were euthanized. The weight and appearance of the treated mice were monitored every other day and they were euthanized when they appeared moribund.
RNA-sequencing analysis
The RNA-sequencing (RNA-seq) experiments were conducted via BGIseq500 sequencer at the Huada Genomics Institute (Wuhan, China). All the data were analyzed with the online bioinformatics platform Dr. Tom (http://report.bgi.com) provided by BGI.
Results
Inflammation stimulation promotes the BCR-ABL1+ B-ALL development
The murine bone marrow transplantation model of the BCR-ABL1+ B-ALL was used to investigate the role of inflammation in the disease progression. Transplantation of BCR-ABL1-transduced BM into lethally irradiated syngeneic recipient mice resulted in a rapid and fatal B-ALL characterized by hind leg paralysis, splenomegaly, and substantially elevated white blood cell counts in the peripheral blood (supplemental Figure 1A-F). Wright-Giemsa staining of peripheral blood and BM sections revealed increased immature blasts in the recipient mice (supplemental Figure 1G). GFP+ cells were present in the BM, spleen (SP), lymph node (LN), liver, lungs, and brain (supplemental Figure 1H). BM cells’ immunophenotyping showed that all GFP+ cells were derived from B lineage and were blocked in the large pre-B-cell and small pre-B-cell stages (supplemental Figure 1I). GFP+CD19+ cells indicated BCR-ABL1+ B-ALL cells displayed cytokine-independent growth in vitro (supplemental Figure 1J,L). Overall, these results demonstrate that the BCR-ABL1+ B-ALL murine model is successfully established.
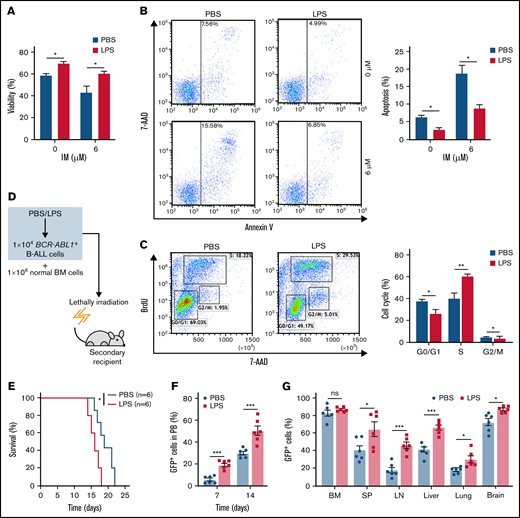
To elucidate whether inflammation influenced on BCR-ABL1+ B-ALL cell survival, the inflammatory ligand LPS was used to stimulate inflammation.24 Compared with PBS-treated control, the LPS-treated BCR-ABL1+ B-ALL cells exhibited significantly higher cell viability and lower apoptosis. The apoptotic effects induced by IM were also dramatically reduced in LPS-treated BCR-ABL1+ B-ALL cells (Figure 1A-B). LPS treatment promoted cell proliferation by causing a reduction in G0/G1 phase and increments in S and G2/M phases (Figure 1C). Tumor necrosis factor-α (TNF-α) and interferon-γ (IFN-γ) pro-inflammatory cytokines have been reported to increase the vulnerability of the inflammatory microenvironment to tumorigenesis.21,23 In agreement with these studies, our results showed that TNF-α but not IFN-γ raised BCR-ABL1+ B-ALL cell viability. LPS and TNF-α had synergetic effects on the growth of these cells (supplemental Figure 2). The data imply that inflammatory stimulation remarkably augments the capacity of BCR-ABL1+ B-ALL cell survival in vitro.

Inflammation promotes the growth of BCR-ABL1+ B-ALL cells in vitro and in vivo. For in vitro assays, BCR-ABL1+ B-ALL cells were obtained from the BM of primary BCR-ABL1+ B-ALL mice and purified by CD19+ MACS, then cultured in vitro. (A-B) BCR-ABL1+ B-ALL cells were treated with LPS (25 µg/mL) or control PBS in a 96-well plate with FBS-deficient culture medium for 48 hours following treated with imatinib (IM) (0, 6 µM) for 24 hours. (A) Cell viability was determined b CCK-8 assays. (B) Cell apoptosis was measured by flow cytometry. The cell population of apoptosis is indicated (left); the histogram shows the percentages of apoptotic cells (right). (C) The cell cycle of LPS (25 µg/mL)-treated and PBS-treated BCR-ABL1+ B-ALL cells were evaluated by flow cytometry. The cell population of G0/G1, S, G2/M phase is indicated (left), the histogram shows the percentages of each period (right). (D) Schematic representation of BCR-ABL1+ B-ALL mouse models derived from secondary transplantation. (E) Kaplan-Meier survival curves for the recipient mice receiving either PBS-treated leukemic cells (n = 6) or LPS-treated leukemic cells (n = 6). (F) Monitoring the peripheral blood percentage of GFP+ cells in recipient mice transplanted with PBS- or LPS- treated leukemic cells at day 7 and day 14 after transplantation. (G) Leukemia burden was determined by measuring the percentages of GFP+ cells in the BM, SP, LN, liver, lung, and brain in recipient mice at day 14 after transplantation. The data are representative of at least 3 independent experiments. Error bars represent the mean ± standard error of the mean. *P < .05, **P <. 01, ***P < .001. ns indicates no significant differences.
Inflammation promotes the growth of BCR-ABL1+ B-ALL cells in vitro and in vivo. For in vitro assays, BCR-ABL1+ B-ALL cells were obtained from the BM of primary BCR-ABL1+ B-ALL mice and purified by CD19+ MACS, then cultured in vitro. (A-B) BCR-ABL1+ B-ALL cells were treated with LPS (25 µg/mL) or control PBS in a 96-well plate with FBS-deficient culture medium for 48 hours following treated with imatinib (IM) (0, 6 µM) for 24 hours. (A) Cell viability was determined b CCK-8 assays. (B) Cell apoptosis was measured by flow cytometry. The cell population of apoptosis is indicated (left); the histogram shows the percentages of apoptotic cells (right). (C) The cell cycle of LPS (25 µg/mL)-treated and PBS-treated BCR-ABL1+ B-ALL cells were evaluated by flow cytometry. The cell population of G0/G1, S, G2/M phase is indicated (left), the histogram shows the percentages of each period (right). (D) Schematic representation of BCR-ABL1+ B-ALL mouse models derived from secondary transplantation. (E) Kaplan-Meier survival curves for the recipient mice receiving either PBS-treated leukemic cells (n = 6) or LPS-treated leukemic cells (n = 6). (F) Monitoring the peripheral blood percentage of GFP+ cells in recipient mice transplanted with PBS- or LPS- treated leukemic cells at day 7 and day 14 after transplantation. (G) Leukemia burden was determined by measuring the percentages of GFP+ cells in the BM, SP, LN, liver, lung, and brain in recipient mice at day 14 after transplantation. The data are representative of at least 3 independent experiments. Error bars represent the mean ± standard error of the mean. *P < .05, **P <. 01, ***P < .001. ns indicates no significant differences.
Next, a secondary transplantation assay was performed to examine the involvement of inflammation in disease progression of BCR-ABL1+ B-ALL (Figure 1D). We first confirmed that the LPS concentration we used did not induce early lethality of the transplanted mice (supplemental Figure 3A-B). Stimulation with LPS did not influence the homing of BCR-ABL1+ B-ALL cells compared with PBS-treated control in the secondary recipients (supplemental Figure 3C), eliminating the possibility of altering the homing capacity of B-ALL leukemia-initiating cells by a prior LPS treatment. The survival of the recipients transplanted with the LPS-treated BCR-ABL1+ B-ALL cells was considerably reduced compared with PBS-treated counterparts (Figure 1E). Weekly monitoring of mice showed a rapid increase in peripheral blood GFP+ cells in the recipient mice transplanted with the LPS-treated leukemic cells than in the PBS treatment group (Figure 1F). Moreover, the recipient mice receiving the LPS-treated leukemic cells displayed larger SP, liver, and LN than those of the PBS-treated leukemic cells (supplemental Figure 3D-F). Despite the same proportion of GFP+ cells in the BM, leukemia infiltration in the SP, LN, liver, lungs, and brain was remarkably elevated in the recipients of the LPS-treated cells (Figure 1G). Moreover, the number of granulocytes but not monocytes was increased, and the high amounts of serum IFN-γ and TNF-α were detected in the peripheral blood from the recipients with LPS-treated leukemic cells compared with the PBS control group. However, IL-6 and IL-1β levels were not detectable in the serum of both groups of the recipient mice (supplemental Figure 3G-H). Additionally, consistent results were observed in 2 other secondary transplantation assays: (1) the BCRABL1+ B-ALL cells mixed with normal BM cells pretreated with either LPS or PBS were transplanted into lethally irradiated recipient mice (supplemental Figure 4); and (2) BCR-ABL1+ B-ALL cells mixed with normal BM cells were transplanted into lethally irradiated recipient mice followed with LPS or PBS treatment every 2 days by intraperitoneal injection (supplemental Figure 5). Together, our data demonstrate that inflammation facilitates the disease progression of BCR-ABL1+ B-ALL.
Upregulation of AID induced by inflammation stimulation is necessary for BCR-ABL1+ B-ALL development
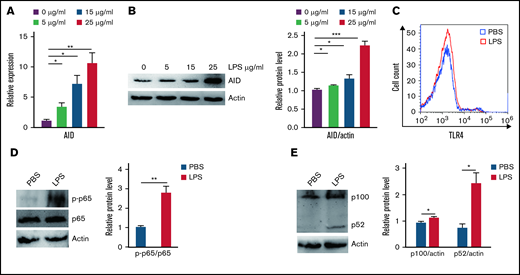
Aberrant AID activity might be a novel link between inflammation and tumorigenesis.25 We investigated whether inflammation increased cell growth via AID in BCR-ABL1+ B-ALL cells that stalled at the pre-B cell stage. Our results showed that AID mRNA and protein expression was remarkably elevated following inflammation stimulation compared with the PBS-treated control (Figure 2A-B; supplemental Figure 6A-B). To verify the mechanism underlying the LPS-induced abnormal AID expression in BCR-ABL1+ B-ALL cells, the LPS receptor TLR4 and its downstream NF-κB pathway were analyzed in the LPS- and PBS-treated BCR-ABL1+ B-ALL cells, respectively. The results disclosed no differences in TLR4 expression, but LPS increased the phosphorylation of p65 and expression of p100 and p52 (Figure 2C-E), arguing that LPS activates the NF-κB pathway to increase the AID expression in BCR-ABL1+ B-ALL cells.

Inflammatory agent LPS induces AID expression through the NF-κB pathway in BCR-ABL1+ B-ALL cells. (A-B) The mRNA and protein expression levels of AID were detected by (A) qRT-PCR and (B) western blotting in BCR-ABL1+ B-ALL cells after stimulation with LPS (0, 5, 15, 25 µg/mL) for 24 hours. Gapdh was used to normalize cDNA amounts, and actin was used as the loading control for western blotting. The protein levels were quantified by the ImageJ program and normalized to actin. (C) BCR-ABL1+ B-ALL cells were treated with LPS (25 µg/mL) or PBS for 24 hours, the expression of TLR4 was measured by flow cytometry. (D-E) BCR-ABL1+ B-ALL cells were treated with LPS (25 µg/mL) or PBS for 24 hours. Western blotting analysis for phospho-specific antibodies against p65, blots were stripped and reprobed with antibodies against total p65. (E) Phosphorylated protein levels were quantified by the ImageJ program and normalized to total form. The protein expression levels of p100 and p52 were detected by western blotting. (D) The protein levels were quantified by the ImageJ program and normalized to actin. The data shown are representative of at least 3 independent experiments. Error bars represent the mean ± standard error of the mean. *P < .05, **P < .01, ***P < .001.
Inflammatory agent LPS induces AID expression through the NF-κB pathway in BCR-ABL1+ B-ALL cells. (A-B) The mRNA and protein expression levels of AID were detected by (A) qRT-PCR and (B) western blotting in BCR-ABL1+ B-ALL cells after stimulation with LPS (0, 5, 15, 25 µg/mL) for 24 hours. Gapdh was used to normalize cDNA amounts, and actin was used as the loading control for western blotting. The protein levels were quantified by the ImageJ program and normalized to actin. (C) BCR-ABL1+ B-ALL cells were treated with LPS (25 µg/mL) or PBS for 24 hours, the expression of TLR4 was measured by flow cytometry. (D-E) BCR-ABL1+ B-ALL cells were treated with LPS (25 µg/mL) or PBS for 24 hours. Western blotting analysis for phospho-specific antibodies against p65, blots were stripped and reprobed with antibodies against total p65. (E) Phosphorylated protein levels were quantified by the ImageJ program and normalized to total form. The protein expression levels of p100 and p52 were detected by western blotting. (D) The protein levels were quantified by the ImageJ program and normalized to actin. The data shown are representative of at least 3 independent experiments. Error bars represent the mean ± standard error of the mean. *P < .05, **P < .01, ***P < .001.
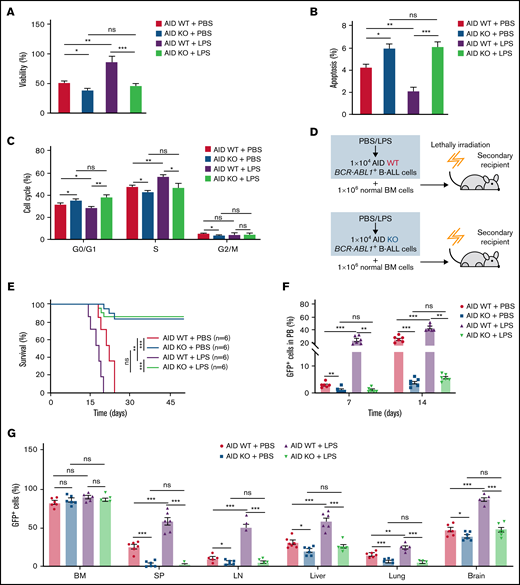
To examine the role of AID in the disease progression of BCR-ABL1+ B-ALL on inflammation, we made a panel of AID knockouts (KOs) using CRISPR/Cas9 in BCR-ABL1+ B-ALL cells. The gene KOs were confirmed by western blotting (supplemental Figure 6C). AID KO2 BCR-ABL1+ B-ALL cells were used for the subsequent experiments. The cultured AID KO BCR-ABL1+ B-ALL cells dramatically reduced viability, elevated apoptosis, and arrested the cell cycle than AID wild-type (WT)counterparts, either with LPS or PBS treatment (Figure 3A-C). The results suggest that the AID deficiency impairs the ability of inflammation to promote BCR-ABL1+ B-ALL cell survival. Furthermore, we generated the secondary transplantation that recipient mice were transplanted with AID KO or AID WT BCR-ABL1+ B-ALL cells pretreated with LPS or PBS, respectively (Figure 3D). The recipients transplanted with either the PBS-treated or LPS-treated AID WT leukemic cells eventually developed typical B-ALL. However, 50% of recipients receiving AID KO leukemic cells presented a delayed leukemia initiation and 50% of recipients transplanted with AID KO leukemic cells had an absence of leukemia ultimately even after 50 days, whether treated with either LPS or PBS (Figure 3E). GFP+ cells in peripheral blood increased slowly in recipients receiving AID KO leukemic cells compared with those receiving AID WT leukemic cells (Figure 3F). Notably, 50% of recipients carrying AID KO leukemic cells exhibited a gradual and complete GFP+ cells depletion in the peripheral blood (supplemental Figure 7A) Besides, there was an insignificant reduction in AID KO BCR-ABL1+ B-ALL cells homing compared with AID WT BCR-ABL1+ B-ALL cells (supplemental Figure 7B). The leukemic mice receiving AID KO cells displayed smaller SP, liver, and LN than those receiving AID WT leukemic cells (supplemental Figure 7C-E). There was a decline in GFP+ cells’ infiltration in the SP, LN, liver, lung, and brain in the leukemic mice receiving AID KO cells, but no difference in the GFP+ cells in BM among the indicated groups (Figure 3G). Thus, these results demonstrate that AID deficiency causes a delayed or completely abrogate BCR-ABL1+ B-ALL progression.

Requirement of AID for BCR-ABL1+ B-ALL initiation and maintenance upon inflammatory stimulation. (A-B) AID WT or AID KO BCR-ABL1+ B-ALL cells were treated with LPS (25 µg/mL) or PBS, then cultured in a 96-well plate with FBS-deficient culture medium for 72 hours. (A) Cell viability was determined by CCK-8 assays. (B) Cell apoptosis was measured by flow cytometry; the histogram shows the percentages of apoptotic cells. (C) The cell cycle of AID WT and AID KO BCR-ABL1+ B-ALL cells treated with LPS (25 µg/mL) or PBS was measured by flow cytometry. The histogram shows the percentages of each period. (D) Schematic representation of BCR-ABL1+ B-ALL mouse models derived from secondary transplantation of AID WT or AID KO BCR-ABL1+ B-ALL mouse model. (E) Kaplan-Meier survival curves for the indicated recipient mice (n = 6 per group). (F) Monitoring the peripheral blood percentage of GFP+ cells in the recipient mice transplanted with the indicated leukemic cells on day 7 and day 14 posttransplantation. (G) Leukemia burden was determined by measuring percentages of GFP+ cells in BM, SP, LN, liver, lung, and brain in the recipient mice at day 14 after transplantation. The data are representative of at least 3 independent experiments. Error bars represent the mean ± standard error of the mean. *P < .05, **P < .01, ***P < .001. ns indicates no significant differences.
Requirement of AID for BCR-ABL1+ B-ALL initiation and maintenance upon inflammatory stimulation. (A-B) AID WT or AID KO BCR-ABL1+ B-ALL cells were treated with LPS (25 µg/mL) or PBS, then cultured in a 96-well plate with FBS-deficient culture medium for 72 hours. (A) Cell viability was determined by CCK-8 assays. (B) Cell apoptosis was measured by flow cytometry; the histogram shows the percentages of apoptotic cells. (C) The cell cycle of AID WT and AID KO BCR-ABL1+ B-ALL cells treated with LPS (25 µg/mL) or PBS was measured by flow cytometry. The histogram shows the percentages of each period. (D) Schematic representation of BCR-ABL1+ B-ALL mouse models derived from secondary transplantation of AID WT or AID KO BCR-ABL1+ B-ALL mouse model. (E) Kaplan-Meier survival curves for the indicated recipient mice (n = 6 per group). (F) Monitoring the peripheral blood percentage of GFP+ cells in the recipient mice transplanted with the indicated leukemic cells on day 7 and day 14 posttransplantation. (G) Leukemia burden was determined by measuring percentages of GFP+ cells in BM, SP, LN, liver, lung, and brain in the recipient mice at day 14 after transplantation. The data are representative of at least 3 independent experiments. Error bars represent the mean ± standard error of the mean. *P < .05, **P < .01, ***P < .001. ns indicates no significant differences.
AID upregulated by inflammation alters the BCR-ABL1+ B-ALL gene expression profiles
To understand the comprehensive molecular mechanisms underlying the AID-driven development of BCR-ABL1+ B-ALL, we performed RNA-seq to determine the global gene expression profiles of BM cells from the following: (1) the leukemic mice transplanted with PBS-treated AID WT leukemic cells (referred to as AID WT + PBS); (2) the leukemic mice transplanted with LPS-treated AID WT leukemic cells (referred to as AID WT + LPS); and (3) the leukemic mice transplanted with LPS-treated AID KO leukemic cells (referred to as AID KO + LPS). RNA-seq data analysis identified 150 significantly suppressed and 134 significantly upregulated genes between AID WT + LPS and AID WT + PBS, whereas AID deficiency resulted in 382 downregulated genes and 301 upregulated genes upon LPS treatment (supplemental Figure 8A-C). Moreover, 90 genes were found to overlap between the 2 comparisons (AID WT + LPS vs AID KO + LPS, AID WT + PBS vs AID WT + LPS) (supplemental Figure 8D). The cluster analysis of RNA-seq data were carried out to classify significant differentially expressed genes with the same expression patterns among the 3 groups (supplemental Figure 9A); the expression trend of genes in cluster 12 was reversed from that of AID (Figure 4A). The Kyoto Encyclopedia of Genes and Genomes pathway analysis showed that 806 genes (fragments per kilobase per million ≥2) of cluster 12 were enriched for various pathways, including cell cycle, cellular senescence, p53 signaling pathway, microRNAs in cancer, autophagy-animal, and TNF signaling pathway and pathway in cancer (Figure 4B). The protein–protein interaction network provided strong evidence that the gene functions had a close relationship in specific KEGG pathway in cluster 12 (supplemental Figure 9B). The quantitative reverse transcriptase-polymerase chain reaction (qRT-PCR) validation of 4 genes selected from the RNA-seq dataset exhibited good agreement between the 2 techniques. In contrast to AID WT + PBS cells, various apoptosis genes (Slc25a4, Casp3, Bim, and Rbl1) were downregulated in AID WT + LPS cells. However, these apoptosis genes were upregulated in AID KO + LPS cells compared with AID WT + LPS cells (Figure 4C).
![AID alters the expression of molecules related to cell survival and DNA damage in BCR-ABL1+ B-ALL cells. (A) Expression profiles of genes within cluster 12. (B) KEGG pathways analysis of differential expressed genes (fragments per kilobase per million [FPKM] ≥ 2) from cluster 12. (C) qRT-PCR validation of RNA-seq at selected target genes, Gapdh was used to normalize cDNA amounts. (D) KEGG pathway analysis of DDR-related genes. (E) Heatmap of showed differential expression of DDR-related genes between the 2 comparisons (AID WT + LPS vs AID KO + LPS, AID WT + PBS vs AID WT + LPS). The red color indicates upregulation in the latter group compared with the former group, and the blue color indicates the reverse. (F) The RNA-seq results of selected genes were verified by qRT-PCR. Gapdh was used to normalize cDNA amounts. qRT-PCR data are representative of at least 3 independent experiments. Error bars represent the mean ± standard error of the mean. *P < .05, ***P < .001.](https://ash.silverchair-cdn.com/ash/content_public/journal/bloodadvances/6/13/10.1182_bloodadvances.2021005017/2/m_advancesadv2021005017f4.png?Expires=1766113381&Signature=dzESehu70fxZLvPymN7hgrWET0WUJtI5vTrqJPFbOXkrVUo7lPTrjmQi6oZF-Q8CTAGh2mnq8ABoj44s5nh1hKFtJoEugPEw8OUedqHMUPgJyI7cF7sB0n0JFP61EDGjzADc06xVdMjzjtPiJLSWmajXSFvycioL5WEIToYP~KwHmiGat0HnkNs3LEZP9jox27upNPZGa660LPbH~QQOAJpzbOG5AHwi58xB45rqEFSyN5VGrmqV2UZmkAlpMtN8sQ3WYKblK-~R4pMmzLFl2NhmyARYoi5~iNxOKUCy3s11iLwRkBwUx7t7k3oV-eqP7r44xjVe1hU~T89zVrTCIQ__&Key-Pair-Id=APKAIE5G5CRDK6RD3PGA)
AID alters the expression of molecules related to cell survival and DNA damage in BCR-ABL1+ B-ALL cells. (A) Expression profiles of genes within cluster 12. (B) KEGG pathways analysis of differential expressed genes (fragments per kilobase per million [FPKM] ≥ 2) from cluster 12. (C) qRT-PCR validation of RNA-seq at selected target genes, Gapdh was used to normalize cDNA amounts. (D) KEGG pathway analysis of DDR-related genes. (E) Heatmap of showed differential expression of DDR-related genes between the 2 comparisons (AID WT + LPS vs AID KO + LPS, AID WT + PBS vs AID WT + LPS). The red color indicates upregulation in the latter group compared with the former group, and the blue color indicates the reverse. (F) The RNA-seq results of selected genes were verified by qRT-PCR. Gapdh was used to normalize cDNA amounts. qRT-PCR data are representative of at least 3 independent experiments. Error bars represent the mean ± standard error of the mean. *P < .05, ***P < .001.
AID alters the expression of molecules related to cell survival and DNA damage in BCR-ABL1+ B-ALL cells. (A) Expression profiles of genes within cluster 12. (B) KEGG pathways analysis of differential expressed genes (fragments per kilobase per million [FPKM] ≥ 2) from cluster 12. (C) qRT-PCR validation of RNA-seq at selected target genes, Gapdh was used to normalize cDNA amounts. (D) KEGG pathway analysis of DDR-related genes. (E) Heatmap of showed differential expression of DDR-related genes between the 2 comparisons (AID WT + LPS vs AID KO + LPS, AID WT + PBS vs AID WT + LPS). The red color indicates upregulation in the latter group compared with the former group, and the blue color indicates the reverse. (F) The RNA-seq results of selected genes were verified by qRT-PCR. Gapdh was used to normalize cDNA amounts. qRT-PCR data are representative of at least 3 independent experiments. Error bars represent the mean ± standard error of the mean. *P < .05, ***P < .001.
AID is a potential genome-wide DNA mutator that threatens genomic integrity.19,20 We compared the levels of γ-H2AX, a reliable marker of DNA damage, between AID WT and AID KO BCR-ABL1+ B-ALL cells following LPS treatment. Our results revealed that LPS significantly increased γ-H2AX levels in BCR-ABL1+ B-ALL cells (supplemental Figure 10A), whereas AID depletion resulted in decreased γ-H2AX levels in LPS-treated BCR-ABL1+ B-ALL cells (supplemental Figure 10B). These results suggest that abnormal AID expression induced by LPS increases genomic instability in BCR-ABL1+ B-ALL cells. Furthermore, we evaluated whether enhanced AID expression was accompanied by the alteration of DNA damage response (DDR) signaling in BCR-ABL1+ B-ALL cells. We created the DDR gene set comprising 20 genes involved in base excision repair, nucleotide excision repair, mismatch repair, DNA replication, and homologous recombination (Figure 4D). A heat map was drawn to show the differences in the 20 DDR gene expression levels between the 2 groups (AID WT + LPS vs AID KO + LPS, AID WT + PBS vs AID WT + LPS). Relative to AID WT + PBS cells, AID WT + LPS cells revealed increased expression of the DDR genes. However, in comparison with the AID WT + LPS cells, AID KO + LPS cells exhibited downregulation of the DDR genes (Figure 4E). The protein–protein interaction network analysis demonstrated that the functions of these DDR genes had a tight link (supplemental Figure 9C). The qRT-PCR data indicated that the expression trends of these 5 DDR genes (Ercc1, Lig1, Xrcc1, Pnkp, and Mutyh) were consistent with RNA-seq data (Figure 4F). These findings prove that AID alters expression of the genes associated with cell survival and DNA damage repair to provoke initiation and disease progression of BCR-ABL1+ B-ALL during inflammation.
Hsp90 inhibition reduces the protein level of AID induced by inflammatory stimulation
Given the role of AID in BCR-ABL1+ B-ALL cells under inflammation, a strategy for controlling AID was required. We studied the association between AID and Hsp90 in BCR-ABL1+ B-ALL cells with inflammation stimulation to achieve this goal. In LPS-treated BCR-ABL1+ B-ALL cells, complexes hosted by anti-AID showed the presence of Hsp90, whereas complexes hosted by anti-Hsp90 revealed AID existence (Figure 5A), arguing that AID and Hsp90 co-reside in LPS-treated BCR-ABL1+ B-ALL cells to form complexes. Therefore, we tested whether the Hsp90 function inhibitors, 17-DMAG or novobiocin, reduced AID protein functional level. The results demonstrated that AID and Hsp90 mRNA as well as Hsp90 protein levels remained unchanged, but AID protein level dropped significantly (supplemental Figure 11A; Figure 5B). Subsequently, we examined whether Hsp90 inhibitors promoted AID proteasomal degradation in inflammation-stimulated BCR-ABL1+ B-ALL cells. The data indicated that the proteasomal inhibitor (MG132) markedly suppressed the decrease of 17-DMAG- or novobiocin-induced AID protein in the LPS-treated BCR-ABL1+ B-ALL cells (Figure 5C), suggesting that Hsp90 protects AID protein from proteasomal degradation on inflammation in BCR-ABL1+ B-ALL. Importantly, 17-DMAG and novobiocin remarkably minimized viability and enhanced apoptosis in LPS-treated AID WT BCR-ABL1+ B-ALL cells in a dose- and time- dependent manner (Figure 5D-E). We also observed the killing effect of 17-DMAG and novobiocin on AID KO BCR-ABL1+ B-ALL cells because Hsp90 is required for cell growth. However, compared with AID KO cells, a higher concentration of 17-DMAG and novobiocin had a stronger pro-apoptosis effect on AID WT BCR-ABL1+ B-ALL cells (supplemental Figure 11B), indicating that the Hsp90 inhibition leads to extinction of AID activity on survival of BCR-ABL1+ B-ALL cells in inflammation.
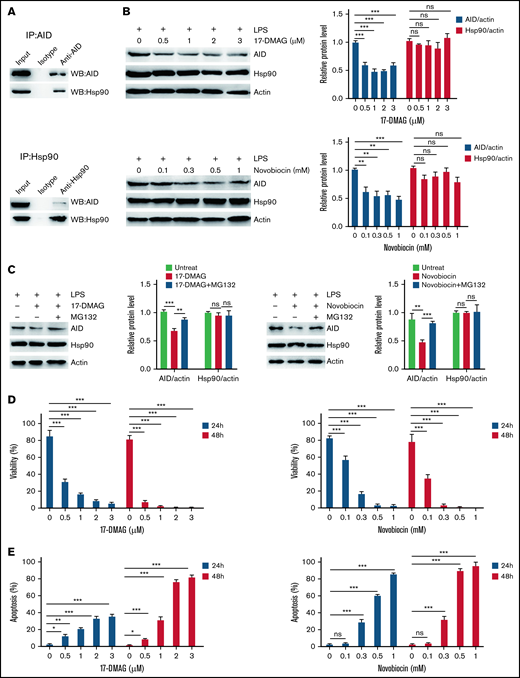
Hsp90 inhibition promotes AID degradation in inflammation-stimulated BCR-ABL1+ B-ALL cells through the proteasome pathway. (A) After treatment with LPS for 48 hours, AID and Hsp90 proteins in BCR-ABL1+ B-ALL cells were detected by immunoprecipitation (IP) with the anti-AID (top) or anti-Hsp90 (bottom) antibody, followed by the indicated western blotting antibody. (B) BCR-ABL1+ B-ALL cells were treated with LPS (25 µg/mL) and 17-DMAG (0, 0.5, 1, 2, and 3 µM) (top) or LPS (25 µg/mL) and novobiocin (0, 0.1, 0.3, 0.5, and 1 mM) (bottom) for 24 hours. AID and Hsp90 expressions were measured by western blotting. Actin was used as loading control for total protein. The protein levels were quantified by the ImageJ program and normalized to actin. (C) BCR-ABL1+ B-ALL cells were treated with LPS (25 µg/mL) and 17-DMAG (0 and 3 µM) (left) or LPS (25 µg/mL) and novobiocin (0 and 1 mM) (right) for 24 hours, followed by treatment with MG132 (0 and 10 µM) during the last 12 hours. Cells were harvested at indicated time points. The AID and Hsp90 protein levels were examined by western blotting. The protein levels were quantified by the ImageJ program and normalized to actin. (D-E) BCR-ABL1+ B-ALL cells were treated with LPS (25 µg/mL) and 17-DMAG (0, 0.5, 1, 2, and 3 µM) or LPS (25 µg/mL) and novobiocin (0, 0.1, 0.3, 0.5, and 1 mM). (D) Assessment of cell viability by CCK-8 assay at 24 and 48 hours following treatment. (E) Analysis of cell apoptosis by flow cytometry at 24 and 48 hours following treatment. The data are representative of at least 3 independent experiments. Error bars represent the mean ± standard error of the mean. *P < .05, **P < .01, ***P < .001. ns indicates no significant differences.
Hsp90 inhibition promotes AID degradation in inflammation-stimulated BCR-ABL1+ B-ALL cells through the proteasome pathway. (A) After treatment with LPS for 48 hours, AID and Hsp90 proteins in BCR-ABL1+ B-ALL cells were detected by immunoprecipitation (IP) with the anti-AID (top) or anti-Hsp90 (bottom) antibody, followed by the indicated western blotting antibody. (B) BCR-ABL1+ B-ALL cells were treated with LPS (25 µg/mL) and 17-DMAG (0, 0.5, 1, 2, and 3 µM) (top) or LPS (25 µg/mL) and novobiocin (0, 0.1, 0.3, 0.5, and 1 mM) (bottom) for 24 hours. AID and Hsp90 expressions were measured by western blotting. Actin was used as loading control for total protein. The protein levels were quantified by the ImageJ program and normalized to actin. (C) BCR-ABL1+ B-ALL cells were treated with LPS (25 µg/mL) and 17-DMAG (0 and 3 µM) (left) or LPS (25 µg/mL) and novobiocin (0 and 1 mM) (right) for 24 hours, followed by treatment with MG132 (0 and 10 µM) during the last 12 hours. Cells were harvested at indicated time points. The AID and Hsp90 protein levels were examined by western blotting. The protein levels were quantified by the ImageJ program and normalized to actin. (D-E) BCR-ABL1+ B-ALL cells were treated with LPS (25 µg/mL) and 17-DMAG (0, 0.5, 1, 2, and 3 µM) or LPS (25 µg/mL) and novobiocin (0, 0.1, 0.3, 0.5, and 1 mM). (D) Assessment of cell viability by CCK-8 assay at 24 and 48 hours following treatment. (E) Analysis of cell apoptosis by flow cytometry at 24 and 48 hours following treatment. The data are representative of at least 3 independent experiments. Error bars represent the mean ± standard error of the mean. *P < .05, **P < .01, ***P < .001. ns indicates no significant differences.
Hsp90 inhibition slows the inflammation-promoted progression of BCR-ABL1+ B-ALL
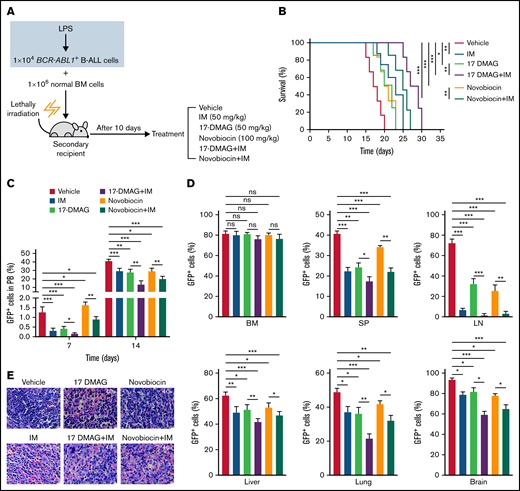
IM is a first-generation Bcr-Abl tyrosine kinase inhibitor and a first-line drug for patients with BCR-ABL1 positive leukemia.2 To explore the therapeutic effect of Hsp90 inhibitors alone and in combination with IM in vivo, we performed secondary transplantation with the LPS-treated BCR-ABL1+ B-ALL cells (Figure 1D). At day 10 posttransplantation, GFP+ leukemic cells were detectable in recipients’ multiple organs indicating leukemic cells engraftment (supplemental Figure 12A). Then, the recipient mice began to be treated with a vehicle, IM (50 mg/kg), 17-DMAG (25 mg/kg), novobiocin (100 mg/kg), and combinational therapies consisting of 17-DMAG with IM or novobiocin with IM (Figure 6A). All drug treatments significantly delayed the disease progression. Specifically, the use of combinational therapies was more effective than monotherapies (Figure 6B-C). At day 17 post-transplantation, all the drug treatments yielded lower leukemic infiltration in multiple organs and decreased organomegaly. Importantly, combinational therapies presented more potent effects than monotherapies (Figure 6D-E; supplemental Figure 12B-D; supplemental Figure 13). These data indicate that Hsp90 inhibitors and IM combination effectively suppresses inflammation-driven BCR-ABL1+ B-ALL progression.

The combination therapies of imatinib and Hsp90 inhibitors slow the inflammation-promoted progression of BCR-ABL1+ B-ALL. (A) Diagram of the treatment schedule in BCR-ABL1+ B-ALL mouse model. (B) Kaplan-Meier survival curves for the indicated mice with different treatments (n = 8 per group). (C) Monitoring the peripheral blood percentage of GFP+ cells in the indicated recipient mice on days 7 and 14 after transplantation. (D) Leukemia burden was determined by measuring the percentages of GFP+ cells from the BM, SP, LN, liver, lung, and brain in the indicated recipient mice at day 17 after transplantation. (E) Hematoxylin and eosin staining was performed to examine infiltration of the leukemic cell on spleen paraffin sections. Scale bar represents 20 µm. The data are representative of at least 3 independent experiments. Error bars represent the mean ± standard error of the mean. *P < .05, ** P< .01, ***P < .001. ns indicates no significant differences.
The combination therapies of imatinib and Hsp90 inhibitors slow the inflammation-promoted progression of BCR-ABL1+ B-ALL. (A) Diagram of the treatment schedule in BCR-ABL1+ B-ALL mouse model. (B) Kaplan-Meier survival curves for the indicated mice with different treatments (n = 8 per group). (C) Monitoring the peripheral blood percentage of GFP+ cells in the indicated recipient mice on days 7 and 14 after transplantation. (D) Leukemia burden was determined by measuring the percentages of GFP+ cells from the BM, SP, LN, liver, lung, and brain in the indicated recipient mice at day 17 after transplantation. (E) Hematoxylin and eosin staining was performed to examine infiltration of the leukemic cell on spleen paraffin sections. Scale bar represents 20 µm. The data are representative of at least 3 independent experiments. Error bars represent the mean ± standard error of the mean. *P < .05, ** P< .01, ***P < .001. ns indicates no significant differences.
Discussion
No direct assessment of inflammation has previously been performed, leaving important gaps in our understanding of BCR-ABL1+ B-ALL progression. Here, we demonstrate that inflammation-induced AID overexpression is associated with a more aggressive disease phenotype in the BCR-ABL1+ B-ALL murine model. The gene expression profiles related to apoptosis and DNA damage repair are dysregulated by inflammation-mediated AID in BCR-ABL1+ B-ALL cells. The disease progression of BCR-ABL1+ B-ALL is successfully delayed via reducing AID protein level by the Hsp90 inhibitors upon recurrent inflammation. Our data provide insights into the causative role of AID in the development and progression of BCR-ABL1+ B-ALL, thus highlighting potential therapeutic targets.
Clonal evolution of BCR-ABL1+ B-ALL is proposed to increase fitness in tumors by providing individual cells with options for adaptation to changing environmental conditions or exposure to therapeutic agents. AID is one such factor; its expression is dynamically regulated in environmental infection exposure.8,20,26 Many studies have shown that AID provides an important link between inflammation and tumor.15,27 Inflammation induces the abnormal expression of AID in gastric, bile duct, and colonic epithelial cells through TNF-α, IL-1β, or NF-κB signaling pathways. Continuous AID expression leads to p53, Cdkn2a, or Cdkn2b genes mutations, which contributes to inflammation-related carcinogenesis in various tissues.28,29 In line with the previous studies, our data have been shown that inflammatory agents induce abnormal AID expression via NF-κB signaling pathway to promote malignant transformation in BCR-ABL1+ B-ALL. We established the secondary transplantation leukemic model to clarify the inflammation effect on the BCR-ABL1+ B-ALL development and rule out the differences in the time of onset and incidence of leukemia among individuals with primary transplantation. Our data confirm that AID overexpression induced by inflammation is required for the rapid proliferation and genomic instability in BCR-ABL1+ B-ALL. In the absence of AID, the recipients of secondary transplantation fail to induce leukemia.23 Our data support that AID KO BCR-ABL1+ B-ALL cells either postpone or completely eradicate leukemogenesis. The difference among the recipients receiving AID KO BCR-ABL1+ B-ALL cells may be explained by the fact that other factors compensate for the lack of AID in the development and clonal evolution of the disease, whereas the failure of this compensation leads to the extinction of the clone of leukemia.30
The analysis of RNA-seq data of AID WT + PBS, AID WT + LPS and AID KO + LPS three leukemic cell groups uncovers the mechanism by which AID promotes the disease progression. AID causes hypermutation on the genes related to cell cycle arrest, leading to poor clinical outcomes of patients.7,8,20 Our results suggest that AID is associated with expression of several apoptosis genes such as Slc25a4, Casp3, Bim, and Rbl1, which influence the cell proliferation and in turn promote the BCR-ABL1+ B-ALL progression in inflammation. Moreover, the activation of the DDR pathway is accompanied by the increase of cell proliferation, suggesting the DDR pathway disorder and DNA damage response in our mouse model.31 Several studies have stated that the decreased DNA repair efficiency caused by DNA repair deficiencies promotes genetic instability, thus increasing individual susceptibility to cancer,32-34 whereas others have shown that tumor cells could activate the DNA damage repair to repair damaged DNA, enhancing tumor cells’ survival even at high levels of DNA damage.35,36 Our data prove that upregulation of AID in BCR-ABL1+ B-ALL following inflammatory stimulation is capable of increased expression of DNA damage repair genes such as Ercc1, Lig1, Xrcc1, Pnkp, and Mutyh. We argue that AID maintains the high level of DNA damage repair to promote the development of BCR-ABL1+ B-ALL under infection exposure. However, further studies are needed to understand whether AID mutates these genes to change their expression.
The enhanced expression of AID responding to inflammatory stimulation is indispensable for the development of BCR-ABL1+ B-ALL. Because of this, a study of the strategies for inhibition of AID is urgently required. As a client of Hsp90, AID stability relies on its interaction with Hsp90. Treatment with Hsp90 inhibitors effectively alleviates the effects of AID on CSR, SHM, and cell proliferation in many cancers.37,38 The Hsp90 N-terminal inhibitor, geldanamycin, inhibits Hsp90 function through competing with ATP to bind to the Hsp90 N-terminal domain. 17-AAG is an analog of geldanamycin, it has lower toxicity and better stability than geldanamycin, but its clinical use is limited given its poor pharmacodynamic properties and water insolubility. Thus, IPI-504 and 17-DMAG (alternatives for 17-AAG) have been developed. IPI-504 is an active form of 17-AAG that is characterized by high solubility in water and is generally well tolerated. It has been reported that IPI-504 has high activity in CML, diffuse large B-cell lymphoma, and mantle cell lymphoma.39,40 17-DMAG is a second-generation analog of geldanamycin and has greater aqueous solubility, better bioavailability and efficacy than 17-AAG.40 Hsp90 C-terminal inhibitor novobiocin showed significant therapeutic effects on melanoma and breast cancer by destroying the stability of the Hsp90 chaperone complex41 ; therefore, 17-DMAG and novobiocin were chosen to use in this study. Our investigation indicates that 17-DMAG and novobiocin have reduced AID protein level, causing the reduction of the BCR-ABL1+ B-ALL cell viability and delaying disease progression of BCR-ABL1+ B-ALL. Hsp90 inhibitors and imatinib combination exhibits stronger effects on BCR-ABL1+ B-ALL.
Overall, this work proves the importance of AID in progression of BCR-ABL1+ B-ALL on inflammation and lays the foundation for further exploration of a treatment strategy for BCR-ABL1+ B-ALL.
Acknowledgments
The authors thank Junjie Zhang of the University of Southern California (Los Angeles, CA) for providing pL-CRISPR.EFS.PAC plasmids. The authors also thank the Core Facilities Sharing Platform of Xi’an Jiaotong University for providing the confocal microscope (Leica TCS SP8 STED 3X, Leica Microsystems, Inc.).
This work was supported by National Natural Scientific Foundation grants of China (nos. 81670157 to Y.J. and 81801581 to Y.D.) and the Natural Scientific Foundation project of Shaanxi (no. 2016JZ030 to Y.J.).
Authorship
Contribution: P.Z. performed the majority of experiments; M.Q. and Y.W. performed the in vivo treatment of the mouse model; X.C. and Y.Miao performed the hematoxylin and eosin staining; M.Y. and W.Z. performed the retroviral production and transfection; D.L. performed the Wright-Giemsa Staining; D.W. and M.W. performed the CCK-8 assay; L.A. and Y.Ma revised the work critically for important intellectual content; Y.D. assisted in the data analysis; and Y.J. designed the experiments and wrote the manuscript.
Conflict-of-interest disclosure: The authors declare no competing financial interests.
Correspondence: Yanhong Ji, School of Basic Medical Sciences, Xi’an Jiaotong University Health Science Center, No. 76 Yanta West Rd, Xi’an, Shaanxi 710061, China; e-mail: jiyanhong@xjtu.edu.cn; or Yanying Dong, Clinical Laboratory, the Second Affiliated Hospital of Xi’an Jiaotong University, No. 157 Xiwu Rd, Xi’an, Shaanxi 710004, China; e-mail: dongyanying1985@163.com.

![AID alters the expression of molecules related to cell survival and DNA damage in BCR-ABL1+ B-ALL cells. (A) Expression profiles of genes within cluster 12. (B) KEGG pathways analysis of differential expressed genes (fragments per kilobase per million [FPKM] ≥ 2) from cluster 12. (C) qRT-PCR validation of RNA-seq at selected target genes, Gapdh was used to normalize cDNA amounts. (D) KEGG pathway analysis of DDR-related genes. (E) Heatmap of showed differential expression of DDR-related genes between the 2 comparisons (AID WT + LPS vs AID KO + LPS, AID WT + PBS vs AID WT + LPS). The red color indicates upregulation in the latter group compared with the former group, and the blue color indicates the reverse. (F) The RNA-seq results of selected genes were verified by qRT-PCR. Gapdh was used to normalize cDNA amounts. qRT-PCR data are representative of at least 3 independent experiments. Error bars represent the mean ± standard error of the mean. *P < .05, ***P < .001.](https://ash.silverchair-cdn.com/ash/content_public/journal/bloodadvances/6/13/10.1182_bloodadvances.2021005017/2/m_advancesadv2021005017f4.png?Expires=1766762374&Signature=EwycHAhtyMOegZr-krL~nlSVUbV0h3nHOfmuGB55QWz7m3suMvQPJnsTNhnQIGNmbKs-Wzai~qVkLabozKrXXtDnZCNcsVOFOer12MNGjy4jB611PinQJHqVUy2IWgjNQDYRc9RHhfgoBfGj2IB7r67l3oO0v2TZJ8iXOqFaSPhPuzrpAX8S9WR5HXnmSXGS6Rx0swqaEfLCJyuME~P2M66wdqUEbl7vE6~mbDhL9~Bdqrg13Ul6XUTz8nLmg6Rbdh1z-cBYc4gEMfaXoHEaL94y8n5CuX~K44ajdJgKXSZe8WF5PWbBWj2OpYTHcIcPV5-yO2bWCbUCtij2IzNT4A__&Key-Pair-Id=APKAIE5G5CRDK6RD3PGA)