Key Points
Terminal maturation of primary murine primitive erythroid precursors is characterized by loss of organelles and anabolic components.
Metabolic reprogramming includes depression of mitochondrial metabolism and upregulation of the pentose phosphate pathway and redox metabolism.

Abstract
Primitive erythropoiesis is a critical component of the fetal cardiovascular network and is essential for the growth and survival of the mammalian embryo. The need to rapidly establish a functional cardiovascular system is met, in part, by the intravascular circulation of primitive erythroid precursors that mature as a single semisynchronous cohort. To better understand the processes that regulate erythroid precursor maturation, we analyzed the proteome, metabolome, and lipidome of primitive erythroblasts isolated from embryonic day (E) 10.5 and E12.5 of mouse gestation, representing their transition from basophilic erythroblast to orthochromatic erythroblast (OrthoE) stages of maturation. Previous transcriptional and biomechanical characterizations of these precursors have highlighted a transition toward the expression of protein elements characteristic of mature red blood cell structure and function. Our analysis confirmed a loss of organelle-specific protein components involved in messenger RNA processing, proteostasis, and metabolism. In parallel, we observed metabolic rewiring toward the pentose phosphate pathway, glycolysis, and the Rapoport-Luebering shunt. Activation of the pentose phosphate pathway in particular may have stemmed from increased expression of hemoglobin chains and band 3, which together control oxygen-dependent metabolic modulation. Increased expression of several antioxidant enzymes also indicated modification to redox homeostasis. In addition, accumulation of oxylipins and cholesteryl esters in primitive OrthoE cells was paralleled by increased transcript levels of the p53-regulated cholesterol transporter (ABCA1) and decreased transcript levels of cholesterol synthetic enzymes. The present study characterizes the extensive metabolic rewiring that occurs in primary embryonic erythroid precursors as they prepare to enucleate and continue circulating without internal organelles.
Introduction
Red blood cells represent ∼84% of total host cells in the human body.1-3 Although often regarded as circulating bags of hemoglobin, which accounts for ∼90% of the dry weight of a mature erythrocyte, red blood cells are endowed with a complex proteome of more than 2000 proteins and participate in systems metabolism beyond their role in gas transport.4 During development, erythroid cells play a critical role in the formation of the cardiovascular network, which is the first functional organ system in the mammalian embryo.5 This system is initially seeded by cells of the primitive erythroid lineage, which emerges in yolk sac blood islands6 as a transient wave of committed progenitors present between embryonic day (E) 7.25 and E9.0 in the mouse embryo. These progenitors generate a semisynchronous cohort of erythroblast precursors that progressively mature in the bloodstream between E9.5 and E12.5 and ultimately enucleate and continue to circulate for several days after birth.7 As part of this process, primitive erythroid precursors, like their definitive counterparts, undergo several maturational cell divisions that are accompanied by progressive decrease in cell size, nuclear condensation, hemoglobin accumulation, and loss of RNA content.8 This sequence of events provides the morphologic classification of erythroid precursors into proerythroblast, basophilic (BasoE), polychromatophilic, and orthochromatic erythroblast (OrthoE) maturational stages (reviewed by Palis5 ). The semisynchronous maturation of primitive erythroid precursors in the murine embryo affords the identification of progressive populations over time, with predominantly BasoEs present at E10.5 and OrthoEs present at E12.5.8
Characterization of primitive erythropoiesis is relevant per se in addition to the identification of overlapping and diverging patterns with definitive erythropoiesis, the latter of which can inform methods for the ex vivo expansion and differentiation of erythroid cells.9 For example, despite many similarities, primitive and definitive erythroid cells have marked differences in cell size and globin gene expression. Although primitive and definitive erythroid lineages share a large set of nonhousekeeping genes, unique gene expression profiles are evident between chronologically equivalent populations during primitive or definitive erythropoiesis, such as the case of aquaporin 3 (Aqp3) and Aqp8, which are specifically expressed in primitive erythroblasts, whereas Aqp1 and Aqp9 are expressed in adult definitive erythroblasts. These distinct gene expression profiles have functional implications, such as the capacity in primitive erythroblasts to accumulate reactive oxygen species (ROS) as a function of Aqp3 and Aqp8.8 Beyond these specific examples, gene expression studies have contributed significantly to the understanding of molecular processes that drive primitive or definitive erythroid maturation.8,10-14 For example, transcript levels are markedly modulated during terminal erythroid maturation, but housekeeping genes are not preferentially lost.8 Specific stages of maturation, such as the transition from BasoE to OrthoE, are characterized by a global reduction of transcription.8
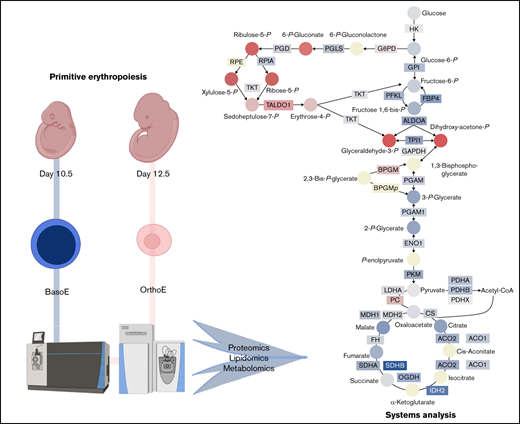
Proteomics studies of in vitro cultured human and murine definitive erythroid precursors have been reported by Karayel et al15 and Gautier et al.16,17 Here, we expand on existing studies of in vitro cultured cells by focusing on a consolidated view of the proteome, metabolome, and lipidome in primary primitive erythroid precursors directly isolated from the bloodstream of murine embryos at E10.5 and E12.5 of gestation, representing cells at the BasoE and OrthoE stages of maturation. We previously characterized the transcriptome and acquisition of functional biomechanical features of these cell populations.8,18 Our analysis of the proteome highlights not only the accumulation of core proteins for mature erythrocyte structure (band 3 and spectrin β) and function (hemoglobins) but also the progressive loss of organelle-related proteins. We find that terminal erythroblast maturation is characterized by complex rewiring of energy and redox metabolism to satisfy the delicate balance between cessation of a highly proliferative state and completion of a unique differentiation process that removes organelles and de novo synthesis capacity. Although decreases in proteostasis machinery components are apparent, including within the spliceosome, ribosome, and proteasome, primitive OrthoEs accumulate critical redox homeostasis proteins that will function to protect the cells throughout the remainder of their circulatory lifespans. Likewise, late-stage primitive erythroid precursors activate recycling programs for membrane repair and replenishment of damaged lipids and nucleotides.
Methods
Isolation of primary primitive erythroid precursor cell populations
The University of Rochester Committee on Animal Resources approved all experiments involving animals for this research. Timed pregnant ICR mice (Taconic Biosciences) were euthanized by cervical dislocation at E10.5 and E12.5. Individual embryos were progressively freed of decidual, placental, and yolk sac tissues with transfer into fresh PB2 media (Dulbecco phosphate-buffered saline [PBS]; Gibco-BRL), 0.3% bovine serum albumin (BSA; Gemini Bio-Products), 0.68 mM of calcium chloride (Sigma-Aldrich), 0.1% glucose, and 12.5 μg/mL of heparin.19 Blood cells were collected as embryos bled from umbilical and vitelline vessels and snap frozen in liquid nitrogen. A minimum of 3 biologic replicates were obtained for each data point analyzed.
Arginine isotope tracing
Isolated E10.5 blood was labeled in heavy or light arginine at a concentration of 1 × 10⁶ cells per mL. The media consisted of Iscove modified Dulbecco medium for stable isotope labeling with amino acids in cell culture; GlutaMAX; 10% dialyzed serum; monothioglycerol; mixture of recombinant human insulin, human transferrin, and sodium selenite; BSA; and erythropoietin (2 U/mL). Cells were cultured for various time points up to 48 hours.
Sample processing and metabolite extraction
Isolated cells were extracted to a concentration of 4 million cells per mL in a methanol volume/acetonitrile volume/water volume ratio of 5:3:2. After vortexing at 4°C for 30 minutes, extracts were separated from the protein pellet by centrifugation for 10 minutes at 18 000g at 4°C and stored at −80°C until analysis.
Ultrahigh-pressure liquid chromatography–mass spectrometry metabolomics and lipidomics
Analyses were performed using Vanquish ultrahigh-pressure liquid chromatography (LC) coupled online to a Q Exactive mass spectrometer (Thermo Fisher Scientific, Bremen, Germany). Samples were analyzed using a 3-minute isocratic condition or a 5-, 9-, or 17-minute gradient as described.20-22 Solvents were supplemented with 0.1% formic acid for positive mode runs and 1 mM of ammonium acetate for negative mode runs. Mass spectrometry (MS) acquisition, data analysis, and elaboration was performed as described.20-22
Proteomics
Proteomic analyses were performed via filter aided sample preparation digestion and nano–ultrahigh-pressure LC–MS/MS identification (nanoEasy LC 1000 coupled to Q Exactive HF; Thermo Fisher Scientific) as previously described.23 Redox proteomic analyses were performed with a switch-tag approach that first uses alyklation of free cysteines with N-ethylmaleimide, followed by reduction of disulfide and oxidized cysteines with dithiothreitol and subsequent alkylation with iodoacetamide before filter aided sample preparation digestion and LC-MS/MS analysis, as previously described.24
Imaging flow cytometry
Fetal blood samples were stained with Hoechst 33342 (Molecular Probes, Eugene, OR) and MitoTracker Deep Red (Invitrogen) according to manufacturer directions. Cells were then blocked and stained in 5% rat whole serum (Invitrogen) prepared in PB2 (Dulbecco PBS and 0.1% glucose [Invitrogen] and 0.3% BSA [Gemini BioProducts]) with 1:200 dilutions of PE-CD71, Biotin-Ter119 (eBioscience, San Diego, CA), and 2 μg/mL of thiazole orange (Sigma-Aldrich). After washing, cells were stained with 1:250 PE-Texas Red streptavidin (BD Biosciences, San Jose, CA). Data were collected on the ImageStreamX and analyzed using IDEAS 6.2 (Luminex, Austin, TX); debris, calibration beads, and cell aggregates were excluded by gating on size and aspect ratios, and focused cells were selected based on sharpness of the brightfield stain (gradient root mean square) as previously described.25
ROS staining with 2′,7′-dichlorofluorescin diacetate
Basophilic and orthochromatic primitive erythroblasts (E10.5 and E12.5) were washed with PBS/10% fetal calf serum and then incubated at 37°C for 15 minutes. CM-H2DCFDA (2′,7′-dichlorofluorescin diacetate [DCF]; Invitrogen) was freshly reconstituted and added to a final concentration of 5 μM to stain for 30 minutes according to manufacturer instructions. Cells were also stained with the erythroid-specific Ter119-APC (Thermo Fisher Scientific), and 4′,6-diamidino-2-phenylindole (Invitrogen) was used for live/dead discrimination. Cells were challenged with freshly diluted hydrogen peroxide (H2O2) at concentrations ranging from 0 to 30 μM for 15 minutes at 20°C and then assayed for DCF fluorescence, viability, and presence of Ter119 using an LSRFortessa cell analyzer (BD Biosciences). Cell analysis determining the mean fluorescence intensity of DCA in live basophilic and orthochromatic erythroblasts was calculated using FlowJo 10.8.1 (BD Biosciences). At least 3 biologic replicates were used.
Statistical analyses
Graphs and statistical analyses (either t test or repeated measures analysis of variance) were prepared with GraphPad Prism 5.0 (GraphPad Software, Inc., La Jolla, CA) and MetaboAnalyst 4.0.26
Figures
Pathway illustrations were generated using Biorender (www.biorender.com).
Results
Primary primitive erythroid precursors undergo widespread proteome changes during terminal maturation
Proteomic analyses were performed on primitive BasoEs and OrthoEs isolated from murine embryos at E10.5 and E12.5, respectively (Figure 1A). Results are reported extensively in supplemental Table 1. Unsupervised PC analysis revealed significant differences between the proteomes of the 2 populations, with PC1 explaining 71.7% of the total variance (Figure 1B). Variable importance in projection scores for proteins with the highest loading weights across PC1 are reported in Figure 1C and include several components enriched in E12.5 OrthoEs, including hemoglobins (Hba and Hbb-b2), spectrin β, metabolic enzymes involved in redox homeostasis (phosphogluconate dehydrogenase, catalase [CAT], and glutamate-cysteine ligase regulatory subunit), and several components of the ubiquitin system (ubiquitin-conjugating enzyme E2 D2 and E2/E3 hybrid ubiquitin-protein ligase [UBE2O]; Figure 1C). A hierarchicclustering analysis of the top 1000 proteins based on significance (t test) is shown in Figure 1D, with a highlight of the top 75 entries by statistical significance in Figure 1E. This analysis highlights the massive downregulation of proteins that occurs during terminal erythroid maturation. To gather biologic clues from this analysis, gene ontology (GO) pathway analyses were performed to identify pathways enriched in E10.5 vs E12.5 cell populations (supplemental Figure 1A-B, respectively). Pathways related to transcriptional and translational regulation, as well as mitochondrial and nucleic acid metabolism, were enriched in BasoEs (supplemental Figure 1A). On the other hand, several pathways involved in redox homeostasis and ROS detoxification, including glutathione metabolism, were enriched in proerythroblasts (supplemental Figure 1B). Protein levels were also compared with their respective published transcript levels (ErythronDB8 ; supplemental Table 1). Nearly 1 quarter (25.7%) of the pairs demonstrated correlation (Pearson correlation coefficient R > 0.7), whereas 4% of the pairs were anticorrelated (R < −0.7). GO analysis of the positively associated transcripts and proteins highlighted enrichment in processes of nuclear trafficking of protein translational machinery (ribosomes and transfer RNA) and nucleotide metabolism (IMP, XMP, and AMP). In addition, a number of nuclear processes, including DNA replication and chromosome architecture, were positively correlated, mirroring ongoing nuclear condensation and enucleation (supplemental Figure 2).
![Proteomic analyses of primitive erythroid precursors at E10.5 and E12.5 of gestation. (A) Erythroid precursors were isolated from the bloodstream of murine embryos at E10.5 and E12.5 of development, predominantly consisting of BasoEs and OrthoEs, respectively, and analyzed by LC-MS/MS proteomics. (B-D) Significant changes between the 2 groups (n = 5) were observed by unsupervised principal component analysis (PCA) (B), partial least square discriminant analysis (variable importance in projection [VIP] plots for PC1 are shown) (C), and hierarchical clustering analysis of the top 1000 significantly different proteins (t test) (D). (E) Highlight of the top 75 significantly different entries from this analysis is provided in the heat map.](https://ash.silverchair-cdn.com/ash/content_public/journal/bloodadvances/6/10/10.1182_bloodadvances.2021005975/3/m_advancesadv2021005975f1.png?Expires=1767983870&Signature=hsPigUqzcMeZAYK0jDzguczfIgaaA~2USKx235bvytbRehM7Fdo6A8WJVSdECS4MCv-Jm1dcoXgoEETJAEkBwlvuvaOSQGar3IAST1I-wBsqFLTEoKPVPPYGPyqQhc2w-iTl3HZ08kXYlZFMQ5ssIPiibmRNb-V32wk2XENYpcWG4unSGb8RsaflVFq~7UG3sZGw83Inj7Y9RrEUlA6uVxwTfZ0JoNiUHYUWL9AuikgRLL2nQg5yAcXif5S3BqLlHmCwM6VUgppa6kJbhdabbEWMwL3X6unn-JJtXuRHTq-rVOy0aMVKWkUskOnWRGnlpwCNjw1IJR7QK4NyNqEUpA__&Key-Pair-Id=APKAIE5G5CRDK6RD3PGA)
Proteomic analyses of primitive erythroid precursors at E10.5 and E12.5 of gestation. (A) Erythroid precursors were isolated from the bloodstream of murine embryos at E10.5 and E12.5 of development, predominantly consisting of BasoEs and OrthoEs, respectively, and analyzed by LC-MS/MS proteomics. (B-D) Significant changes between the 2 groups (n = 5) were observed by unsupervised principal component analysis (PCA) (B), partial least square discriminant analysis (variable importance in projection [VIP] plots for PC1 are shown) (C), and hierarchical clustering analysis of the top 1000 significantly different proteins (t test) (D). (E) Highlight of the top 75 significantly different entries from this analysis is provided in the heat map.
Proteomic analyses of primitive erythroid precursors at E10.5 and E12.5 of gestation. (A) Erythroid precursors were isolated from the bloodstream of murine embryos at E10.5 and E12.5 of development, predominantly consisting of BasoEs and OrthoEs, respectively, and analyzed by LC-MS/MS proteomics. (B-D) Significant changes between the 2 groups (n = 5) were observed by unsupervised principal component analysis (PCA) (B), partial least square discriminant analysis (variable importance in projection [VIP] plots for PC1 are shown) (C), and hierarchical clustering analysis of the top 1000 significantly different proteins (t test) (D). (E) Highlight of the top 75 significantly different entries from this analysis is provided in the heat map.
Primitive erythroid maturation is characterized by the loss of protein components of translational/transcriptional machinery and mitochondria
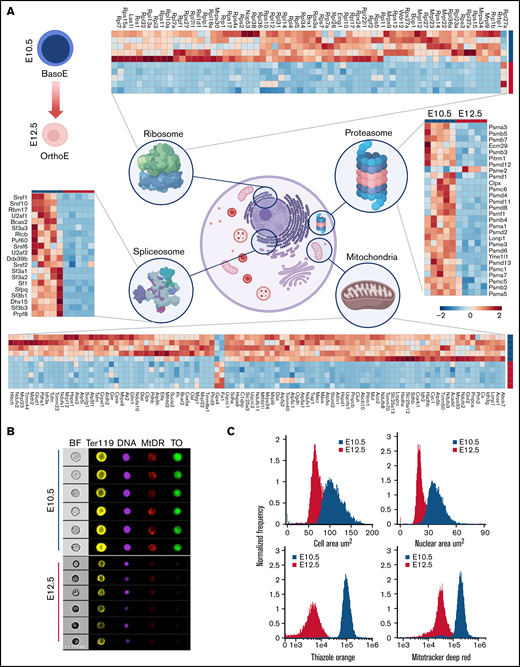
To further the GO annotation analyses, proteomic data were submitted to the Kyoto Encyclopedia of Genes and Genomes pathway mapper tool (https://www.genome.jp/kegg/mapper.html) to map which protein components were affected as primitive BasoEs matured to OrthoEs. Results are extensively reported in the data supplement (supplemental Figures 4-20), in which we highlight in red the protein components that were identified to be decreased in primitive OrthoEs compared with BasoEs. Top results from these figures were distilled and plotted in the form of heat maps in Figure 2A. Interestingly, primitive erythroblast maturation was characterized by significant decreases in the expression levels of several components of the messenger RNA (mRNA) surveillance pathway, mRNA maturation (spliceosome), and ribosome biogenesis and assembly (Figure 2; details of these pathways are provided in supplemental Figures 3-7), suggesting an adaptation in these cells toward use of already-synthesized proteins rather than reliance on de novo protein synthesis. Given these findings, we analyzed E10.5 and E12.5 primitive erythroblasts using imaging flow cytometry, staining for RNA (thiazole orange), DNA (DRAQ5), and mitochondria (MitoTracker Red). As shown in representative images in Figure 2B and quantitated in Figure 2C, primitive OrthoEs at E12.5 were smaller, with a more condensed nucleus and markedly less staining of ribosomes and mitochondria, compared with primitive BasoEs at E10.5.

Proteomic analyses highlight a significant loss of organelle protein components as primitive BasoEs at E10.5 transition into OrthoEs at E12.5. (A) Erythroid precursors were isolated from the bloodstream of murine embryos at E10.5 and E12.5 and analyzed by LC-MS/MS proteomics. A widespread loss of organelle protein components, especially in mitochondria, ribosomes, and spliceosome and proteasome components, occurs during terminal erythroid maturation (further detailed view of these pathways is provided in supplemental Figures 3-8). (B) Representative imaging flow cytometric images of E10.5 and E12.5 primitive erythroblasts stained with the erythroid marker Ter119, the DNA stain Hoechst 33342, the mitochondrial stain MitoTracker Deep Red (MtDR), and the RNA stain thiazole orange (TO). (C) Histogram plots of cell and nuclear areas (upper panels) and RNA and mitochondrial signal intensity distributions of 13 064 E10.5 and 10 648 E12.5 erythroid precursors. BF, brightfield.
Proteomic analyses highlight a significant loss of organelle protein components as primitive BasoEs at E10.5 transition into OrthoEs at E12.5. (A) Erythroid precursors were isolated from the bloodstream of murine embryos at E10.5 and E12.5 and analyzed by LC-MS/MS proteomics. A widespread loss of organelle protein components, especially in mitochondria, ribosomes, and spliceosome and proteasome components, occurs during terminal erythroid maturation (further detailed view of these pathways is provided in supplemental Figures 3-8). (B) Representative imaging flow cytometric images of E10.5 and E12.5 primitive erythroblasts stained with the erythroid marker Ter119, the DNA stain Hoechst 33342, the mitochondrial stain MitoTracker Deep Red (MtDR), and the RNA stain thiazole orange (TO). (C) Histogram plots of cell and nuclear areas (upper panels) and RNA and mitochondrial signal intensity distributions of 13 064 E10.5 and 10 648 E12.5 erythroid precursors. BF, brightfield.
Primitive OrthoEs were also characterized by decreases in components of the protein processing pathway in the endoplasmic reticulum and proteasome (Figure 2; details of these pathways are provided in supplemental Figures 7-8), further supporting a progressive decline in the reliance on de novo protein synthesis as these cells terminally mature. Most notably, the top pathways that were upregulated in primitive BasoEs compared with OrthoEs involved 128 metabolic enzymes, mapped in red in supplemental Figure 10 against the comprehensive Kyoto Encyclopedia of Genes and Genomes map 01100 of all metabolic reactions in human cells. Top metabolic pathways affected included several mitochondrial components (Figure 2), such as the electron transport chain and the tricarboxylic acid (TCA) cycle (supplemental Figures 11-12). In addition to these mitochondrial pathways, glycolysis/gluconeogenesis, cofactor synthesis and metabolism, amino acid (especially arginine, proline, cysteine, and methionine) and fatty acid metabolism, and pyrimidine and purine metabolism for nucleoside synthesis ranked among the top differentially regulated pathways as primitive BasoEs transitioned to OrthoEs (supplemental Figures 12-19).
Metabolomic analyses confirm proteomic and transcriptomic evidence of metabolic rewiring upon maturation of primitive BasoEs to OrthoEs
To expand on the proteomic evidence of metabolic rewiring during terminal erythroid maturation, metabolomic analyses were also performed on primitive BasoEs and OrthoEs (Figure 3A; supplemental Table 1). Unsupervised PC analysis confirmed distinct metabolic phenotypes between the 2 populations, with PC1 explaining 45.7% of the total variance (Figure 3B). Top metabolites by loading weights on PC1 included several metabolites from the pentose phosphate pathway (PPP; pentose phosphate isobars, 6-phosphogluconate, and sedoheptulose phosphate), glutathione synthesis and metabolism (glutamine, γ-glutamyl-Se-cysteine, and 5-oxoproline), TCA cycle metabolites (citrate, fumarate, and malate), and other metabolites involved in the metabolism of amino acids and lipids (creatine, aspartate, and ethanolamine phosphate; Figure 3C). An overview of the top 75 significant metabolites by t test is provided in the heat map in Figure 3D for normalized data (ie, normalized to the pool of measurements in BasoEs and autoscaled by mean centering and divided by the standard deviation of each variable). This analysis also highlighted key differences in free fatty acids and acylcarnitine metabolism between the 2 populations. Raw data are further graphed in the form of a volcano plot in Figure 3E.
![Metabolomic analyses of primitive erythroid precursors at E10.5 and E12.5 of gestation. (A) Erythroid precursors were isolated from the bloodstream of murine embryos at E10.5 and E12.5 and analyzed by LC-MS metabolomics. (B-D) Significant changes between the 2 groups (n = 5) were observed by unsupervised PCA analysis (B), partial least square discriminant analysis (variable importance in projection [VIP] plots for PC1 are shown) (C), and hierarchical clustering analysis (HCA) of the top 75 significantly different proteins (t test) (D). Analyses in panels B to D were performed upon normalization against a pool of data obtained from E10.5 samples and autoscaled. (E) Volcano plot representation of original raw data.](https://ash.silverchair-cdn.com/ash/content_public/journal/bloodadvances/6/10/10.1182_bloodadvances.2021005975/3/m_advancesadv2021005975f3.png?Expires=1767983870&Signature=nX0ifsiPXZTglDwT~U79afmSqx~bj~pSWgoPkQ09LE33JwIrJCa1UwOAXM5HfsiDyZubSiKI5yTePkHLrlB5VgB3l0MeDWqiMvgHJkLLOMA2HEp27sNiX1rYMBS15nkVHIJxzthLVsfEgJFThcXbz4vTQmz9vUf4Wm-M7QjOwqt36fOI1pZYuVv-dasorF6RNjJRqqyRDPp0y1K9L5xCe95sEPzov6BQTjsBeLKsopkxx0KSCTZcz0AChd~fz50JaAaaBxTUUKj5AJGh8dnvjGOhLqiZ~iWNswS4GJ-QUJhQDrN~55XRzSS0M8wz-XlujP9QC7AEH45T9l8NZFB2ig__&Key-Pair-Id=APKAIE5G5CRDK6RD3PGA)
Metabolomic analyses of primitive erythroid precursors at E10.5 and E12.5 of gestation. (A) Erythroid precursors were isolated from the bloodstream of murine embryos at E10.5 and E12.5 and analyzed by LC-MS metabolomics. (B-D) Significant changes between the 2 groups (n = 5) were observed by unsupervised PCA analysis (B), partial least square discriminant analysis (variable importance in projection [VIP] plots for PC1 are shown) (C), and hierarchical clustering analysis (HCA) of the top 75 significantly different proteins (t test) (D). Analyses in panels B to D were performed upon normalization against a pool of data obtained from E10.5 samples and autoscaled. (E) Volcano plot representation of original raw data.
Metabolomic analyses of primitive erythroid precursors at E10.5 and E12.5 of gestation. (A) Erythroid precursors were isolated from the bloodstream of murine embryos at E10.5 and E12.5 and analyzed by LC-MS metabolomics. (B-D) Significant changes between the 2 groups (n = 5) were observed by unsupervised PCA analysis (B), partial least square discriminant analysis (variable importance in projection [VIP] plots for PC1 are shown) (C), and hierarchical clustering analysis (HCA) of the top 75 significantly different proteins (t test) (D). Analyses in panels B to D were performed upon normalization against a pool of data obtained from E10.5 samples and autoscaled. (E) Volcano plot representation of original raw data.
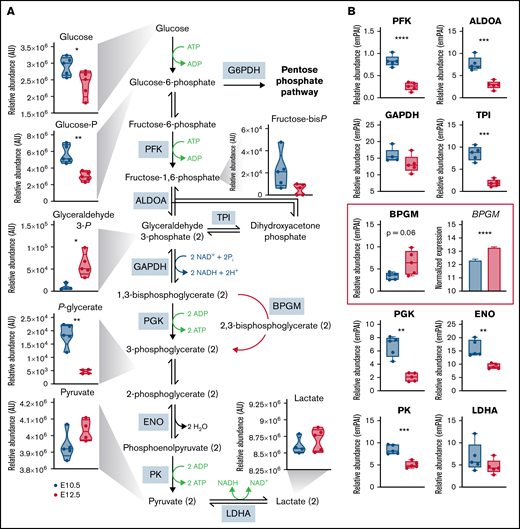
Primitive OrthoEs are characterized by upregulation of late glycolysis despite decreases in the levels of several glycolytic enzymes
In line with decreased levels of TCA cycle intermediates and an apparent shift toward the PPP, we next examined metabolite and protein levels within the glycolytic pathway, which serves as a functional intermediary between these 2 pathways (Figure 4). Although the steady-state levels of early glycolytic intermediates, including glucose and glucose 6-phosphate, decreased, the late glycolytic intermediate glyceraldehyde 3-phosphate was higher in primitive OrthoEs compared with BasoEs, whereas the downstream phosphoglycerate pool (a mixture of the 2- and 3-phospho isomers) was lower, and pyruvate and lactate remained constant (Figure 4A). These metabolic changes were accompanied by significant maturation-dependent decreases in several rate-limiting glycolytic enzymes, including phosphofructokinase, aldolase A, triose phosphate isomerase, phosphoglycerate kinase, enolase, and pyruvate kinase (Figure 4B). Although inferred from steady-state measurements, these results are suggestive of an increased flux rate through glycolysis, resulting in faster consumption of upstream substrates in conjunction with the accumulation of glycolytic end products. Interestingly, the proteomic data presented here agree with previous transcriptional evidence from our group8 about a maturation-dependent increase in the expression levels of the rate-limiting enzyme of the Rapoport-Luebering shunt, bisphosphoglycerate mutase (P = .06; Figure 4B, highlighted in red boxes). This observation is functionally relevant, given the role of this metabolite in the promotion of hemoglobin oxygen offloading to counteract hypoxia.27

Glycolysis is differentially regulated between E10.5 and E12.5 erythroid precursors. (A-B) Relative levels of metabolites (A) and proteins (B) involved in glycolysis are shown. Metabolites are graphed as violin plots, proteins as box-whisker plots, and RNA transcripts as bar plots. *P < .05, **P < .01, ***P < .001, ****P < .0001. ALDOA, aldolase A; AU, arbitrary unit; BPGM, bisphosphoglycerate mutase; emPAI, exponentially modified protein abundance index; ENO, enolase; GAPDH, glyceraldehyde-3-phosphate dehydrogenase; LDHA, lactate dehydrogenase-A; PFK, phosphofructokinase; PGK, phosphoglycerate kinase; PK, pyruvate kinase; TPI, triose phosphate isomerase.
Glycolysis is differentially regulated between E10.5 and E12.5 erythroid precursors. (A-B) Relative levels of metabolites (A) and proteins (B) involved in glycolysis are shown. Metabolites are graphed as violin plots, proteins as box-whisker plots, and RNA transcripts as bar plots. *P < .05, **P < .01, ***P < .001, ****P < .0001. ALDOA, aldolase A; AU, arbitrary unit; BPGM, bisphosphoglycerate mutase; emPAI, exponentially modified protein abundance index; ENO, enolase; GAPDH, glyceraldehyde-3-phosphate dehydrogenase; LDHA, lactate dehydrogenase-A; PFK, phosphofructokinase; PGK, phosphoglycerate kinase; PK, pyruvate kinase; TPI, triose phosphate isomerase.
PPP is activated during terminal erythroid maturation
An alternative explanation can reconcile the observations of an apparent decrease in the early glycolytic intermediates and accumulation of late products of glycolysis: rerouting of early hexose phosphates to the hexose monophosphate shunt pathway, also known as the PPP (Figure 5A). Consistent with this hypothesis, proteomic (Figure 5B) analysis highlighted a maturation-dependent increase in the expression of the nonoxidative PPP rate-limiting enzyme, transaldolase (Figure 5B). The changes of these proteins were accompanied by increases in PPP metabolites 6-phosphogluconate, pentose phosphate isobars, and sedoheptulose phosphate (Figure 5C), despite decreases in free glutathione pools, both reduced and oxidized (Figure 5D). As expected, primitive OrthoEs contained increased intracellular levels of α (ζ and α) and β (ɛγ, βH1, β1, and β2) hemoglobin subunits, as well as the band 3 anion exchanger 1 protein, which constitute the most abundant proteins in the cytosol and membranes of mature red blood cells, respectively (Figure 5E). A peptide coverage map for each globin chain is provided in supplemental Figure 21.
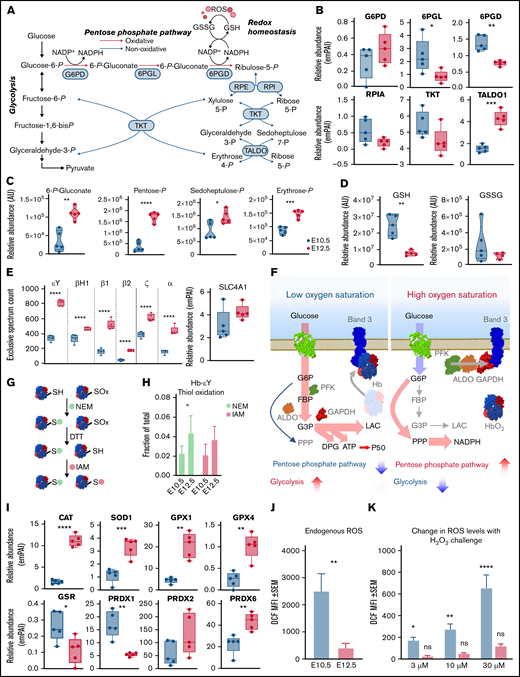
The PPP is differentially regulated between E10.5 and E12.5 erythroid precursors. (A) Pathway map of the interplay between glycolysis and the PPP is shown. (B) Relative abundance of PPP enzymes between E10.5 and E12.5 populations. (C-D) Relative abundance of PPP metabolites (C) and reduced (GSH) and oxidized (GSSG) glutathione (D) in E10.5 and E12.5 populations. (E) Increased expression of hemoglobin (Hb) chains and band 3 (or solute carrier protein 4A1-SLC4A1). (F) These proteins are involved in the phenomenon of oxygen-dependent metabolic modulation, which regulates metabolic fluxes through glycolysis and the PPP as a function of Hb oxygenation status and competitive binding of deoxyhemoglobin and glycolytic enzymes for the N-terminus cytosolic domain of SLC4A1 band 3.59,73,74 (G-I) Switch-tag proteomic approach (G) revealed differing cysteine oxidation status (H) in the 2 cell populations; these differences were accompanied by altered expression levels of many redox enzymes (I), including CAT, superoxide dismutase 1 (SOD1), glutathione peroxidase 1 (GPX1) and GPX4, glutathione reductase (GSR), and peroxiredoxin 1 (PRDX1), PRDX2, and PRDX6. Metabolites are graphed as violin plots and proteins as box-whisker plots. (J-K) Levels of ROS in E10.5 or E12.5 cells endogenously after collection (J) or after exogenous challenge (K) with 3, 10, or 30 μM H2O2. *P < .05, **P < .01, ***P < .001, ****P < .0001. ALDO, aldolase; ATP, adenosine triphosphate; AU, arbitrary unit; DPG, diphosphoglycerate; DTT, dithiothreitol; emPAI, exponentially modified protein abundance index; FBP, fructose-1,6-bisphosphate; GAPDH, glyceraldehyde-3-phosphate dehydrogenase; G3P, glyceraldehyde 3-phosphate; IAM, iodoacetamide; LAC, lactate; MFI, mean fluorescence intensity; NADP, NAD phosphate; NADPH, reduced NADP; NEM, N-ethylmaleimide; ns, not significant; PFK, phosphofructokinase; PPP, Pentose phosphate pathway; 6PGD, 6-phosphogluconate dehydrogenase; 6PGL, 6-phosphogluconolactonase; RPE, ribulose-phosphate 3-epimerase; RPI, ribose-5-phosphate isomerase; RPIA, ribose-5-phosphate isomerase A; SEM, standard error of the mean; TALDO, transaldolase; TKT, transketolase.
The PPP is differentially regulated between E10.5 and E12.5 erythroid precursors. (A) Pathway map of the interplay between glycolysis and the PPP is shown. (B) Relative abundance of PPP enzymes between E10.5 and E12.5 populations. (C-D) Relative abundance of PPP metabolites (C) and reduced (GSH) and oxidized (GSSG) glutathione (D) in E10.5 and E12.5 populations. (E) Increased expression of hemoglobin (Hb) chains and band 3 (or solute carrier protein 4A1-SLC4A1). (F) These proteins are involved in the phenomenon of oxygen-dependent metabolic modulation, which regulates metabolic fluxes through glycolysis and the PPP as a function of Hb oxygenation status and competitive binding of deoxyhemoglobin and glycolytic enzymes for the N-terminus cytosolic domain of SLC4A1 band 3.59,73,74 (G-I) Switch-tag proteomic approach (G) revealed differing cysteine oxidation status (H) in the 2 cell populations; these differences were accompanied by altered expression levels of many redox enzymes (I), including CAT, superoxide dismutase 1 (SOD1), glutathione peroxidase 1 (GPX1) and GPX4, glutathione reductase (GSR), and peroxiredoxin 1 (PRDX1), PRDX2, and PRDX6. Metabolites are graphed as violin plots and proteins as box-whisker plots. (J-K) Levels of ROS in E10.5 or E12.5 cells endogenously after collection (J) or after exogenous challenge (K) with 3, 10, or 30 μM H2O2. *P < .05, **P < .01, ***P < .001, ****P < .0001. ALDO, aldolase; ATP, adenosine triphosphate; AU, arbitrary unit; DPG, diphosphoglycerate; DTT, dithiothreitol; emPAI, exponentially modified protein abundance index; FBP, fructose-1,6-bisphosphate; GAPDH, glyceraldehyde-3-phosphate dehydrogenase; G3P, glyceraldehyde 3-phosphate; IAM, iodoacetamide; LAC, lactate; MFI, mean fluorescence intensity; NADP, NAD phosphate; NADPH, reduced NADP; NEM, N-ethylmaleimide; ns, not significant; PFK, phosphofructokinase; PPP, Pentose phosphate pathway; 6PGD, 6-phosphogluconate dehydrogenase; 6PGL, 6-phosphogluconolactonase; RPE, ribulose-phosphate 3-epimerase; RPI, ribose-5-phosphate isomerase; RPIA, ribose-5-phosphate isomerase A; SEM, standard error of the mean; TALDO, transaldolase; TKT, transketolase.
Given the role of the N-terminus of band 3 as a docking site for competitive binding of either glycolytic enzymes or deoxyhemoglobin, increased expression levels of all components involved in this network suggest the potential activation at the OrthoE stage of the so-called oxygen-dependent metabolic modulation mechanism (Figure 5F).28,29 In mature erythrocytes, this metabolic switch functions to balance the catabolic routes of glucose toward promotion of tissue oxygen delivery under low oxygen saturation conditions (by way of the production of diphosphoglycerate, adenosine triphosphate, and lactate through glycolysis) or management of erythrocyte intracellular oxidative stress that occurs under high oxygen conditions (by way of reduced NADP production through the PPP). In light of decreased glutathione pools in OrthoEs, we assessed the oxidation of labile cysteine residues in hemoglobin chains as a measure of cellular redox status, because these sites are prone to oxidation.30 A switch-tag redox proteomic approach24 (Figure 5G) revealed that primitive OrthoEs compared with BasoEs were characterized by a higher degree of both reduced and reversibly oxidized functional thiols on hemoglobin chains. The relative rates of thiol oxidation for the most abundant chain, ɛγ-globin, are shown in Figure 5G. This finding suggests an increased capacity to protect and/or recycle oxidatively modified cysteine residues, in keeping with the functional annotation of the differential proteomes between the 2 populations of primitive erythroid precursors (supplemental Figure 1B). In support, a marked increase in the levels of redox-modulating enzymes, including CAT, superoxide dismutase 1, GPX1 and GPX4, and PRDX1, PRDX2, and PRDX6, in primitive OrthoEs points toward a strengthening of the redox defense system at terminal stages of erythroblast maturation (Figure 5I). However, decreased abundance of glutathione reductase, in combination with lower total glutathione pools, may indicate a lower level of ROS produced in OrthoE cells relative to BasoEs. We therefore measured endogenous ROS levels using DCF fluorescence and after incubation with progressively increasing amounts of H2O2 from 3 to 30 μM. Indeed, OrthoEs have higher transcript levels of Aqp8 relative to BasoEs, and primitive erythroblasts have higher basal levels and uptake capacity of ROS in comparison with definitive erythroblasts.8 We found here that E10.5 cells had higher levels of ROS at baseline (Figure 5J) and increased levels in response to challenge with H2O2 (Figure 5K). Meanwhile, E12.5 cells treated with the same amount of H2O2 did not exhibit elevated intracellular ROS levels, indicating enhanced ability to neutralize H2O2 (Figure 5K). In mature erythrocytes devoid of mitochondria, ROS are primarily derived from autoxidation of heme and subsequent Fenton and Haber-Weiss reactions.31 However, in most other cells, ROS are produced largely as a result of mitochondrial function. Therefore, we next focused on mitochondrial networks during this maturational progression.
Primitive OrthoEs are characterized by decreased levels of mitochondrial protein components and depression of mitochondrial metabolism
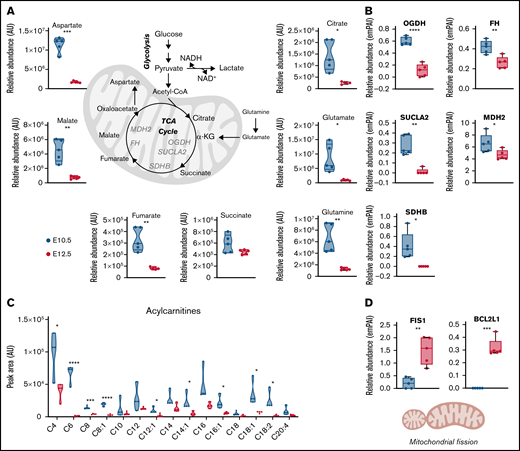
Metabolomic analyses of primitive BasoEs and OrthoEs indicated a significant decrease in TCA intermediates, including citrate, fumarate, and malate, along with the levels of respective amino acid transaminase substrates aspartate glutamate and glutamine, with maturation (Figure 6A). Mirroring these changes, mitochondrial enzymes involved in the TCA cycle, including oxoglutarate dehydrogenase, succinyl-CoA ligase, succinate dehydrogenase B, fumarate hydratase, and malate dehydrogenase 2, also significantly decreased (Figure 6B). Furthermore, acylcarnitines, which are produced during fatty acid oxidation to fuel the TCA cycle through the generation of acetyl-CoA, also significantly decreased in OrthoEs (Figure 6C). Together, these results are consistent with the loss of mitochondrial mass that occurs during terminal erythroblast maturation (Figure 2B-C). Interestingly, despite decreases in OrthoEs of virtually all mitochondrial proteins we tested in this study (Figure 2A), the levels of mitochondrial fission regulators (FIS1) and the apoptotic cascade component BCL2L1 were increased (Figure 6D).

Mitochondrial metabolism decreases in primitive OrthoEs, in line with an increased mitophagy signature. (A-C) Decreased TCA cycle carboxylic acids and amino acids (A) and proteins (B), along with depleted levels of fatty acid oxidation intermediates acylcarnitines (C), are shown. (D) Despite decreases in all mitochondrial enzymes and metabolites, OrthoE cells were characterized by higher levels of mitochondrial fission and antiapoptotic pathways FIS1 and BCL2L1. *P < .05, **P < .01, ***P < .001, ****P < .0001. AU, arbitrary unit; FH, fumarate hydratase; MDH, malate dehydrogenase; NADH, reduced NAD with hydrogen; OGDH, oxoglutarate dehydrogenase; SDHB, succinate dehydrogenase B; SUCLA, succinyl-CoA ligase.
Mitochondrial metabolism decreases in primitive OrthoEs, in line with an increased mitophagy signature. (A-C) Decreased TCA cycle carboxylic acids and amino acids (A) and proteins (B), along with depleted levels of fatty acid oxidation intermediates acylcarnitines (C), are shown. (D) Despite decreases in all mitochondrial enzymes and metabolites, OrthoE cells were characterized by higher levels of mitochondrial fission and antiapoptotic pathways FIS1 and BCL2L1. *P < .05, **P < .01, ***P < .001, ****P < .0001. AU, arbitrary unit; FH, fumarate hydratase; MDH, malate dehydrogenase; NADH, reduced NAD with hydrogen; OGDH, oxoglutarate dehydrogenase; SDHB, succinate dehydrogenase B; SUCLA, succinyl-CoA ligase.
Nitrogen, purine, and 1-carbon metabolism are modulated during terminal erythroblast maturation
Given the apparent downregulation of mitochondrial activity evidenced by the loss of mitochondrial mass and by the decreased levels of TCA cycle intermediates, we next assessed the urea cycle that is also localized to mitochondria (supplemental Figure 22A). The transition from primitive BasoEs to OrthoEs was accompanied by depression of arginine levels, along with downstream metabolites such as creatine, phosphocreatine, and their precursor guanidinoacetate (supplemental Figure 22B). Although no significant changes were observed in the levels of ornithine and citrulline, an increase in the citrulline/arginine ratio, but not in the ornithine/arginine ratio, suggests increased nitric oxide synthase activity. Notably, decreases in spermine were accompanied by increases (P = .06) in spermidine, suggesting that polyamine metabolism may be modified during terminal erythropoiesis. Indeed, its production was fueled directly by arginine, which was capable of contributing to nearly 20% of spermidine after 72 hours, as revealed by 13C6,15N4-arginine tracing (supplemental Figure 23). Because polyamine synthesis is tied to S-adenosylmethionine as a methyl group donor, we observed significant decreases in S-adenosylmethionine precursor methionine and serine, another key metabolite in 1-carbon metabolism (supplemental Figure 22C). One-carbon metabolism provides carbon atoms as building blocks for de novo nucleotide synthesis. Notably, the transition from primitive BasoEs to OrthoEs was characterized by increases in adenine (not significant) that were accompanied by significant decreases in AMP and its oxidation products, including the end product (in mice) allantoate (supplemental Figure 22D). Of note, when combining metabolomic data from the present study with transcriptomic data from Kingsley et al,8 purine metabolism emerged as the top metabolic pathway affected by terminal erythroblast maturation (supplemental Figure 3A-D). Among the top 10 pathways from this analysis, we also noted several classes of lipids (glycosphingolipids, sphingolipids, and linoleic acid metabolism; supplemental Figure 16). Therefore, we next decided to analyze the lipidome of maturing primitive erythroblasts.
Maturation of primitive erythroid precursors is accompanied by decreases in many but not all lipid classes, indicating complex remodeling of the lipidome
Acquisition of MS2 fragmentation spectra improved lipid identification confidence and enabled identification of lipid acyl chains and the relative abundance of 1084 lipids (supplemental Table 1) in primitive BasoEs and OrthoEs. A systems analysis revealed that the abundance of many lipid classes, including phosphatidylcholines and phosphatidylethanolamines, the 2 most abundant lipid classes in red blood cell membranes, decreased as primitive BasoEs transitioned to OrthoEs (Figure 7A). Although speculative at this stage, this change may reflect either a decrease in membrane surface area as these cells mature and decrease in size8 or an alteration in relative membrane lipid composition, which is dependent upon lipid synthesis or extracellular lipid availability.32 Interestingly, the significant decrease in phosphatidylcholine species was mirrored by an increase in lyophosphatidylcholines in primitive OrthoEs, indicating activation of the Lands cycle, which serves to recycle oxidized membrane lipids because of the lack of capacity for de novo lipid synthesis. Reprogramming in membrane repair was further evident here, because primitive OrthoEs were also characterized by lower levels of fatty acid synthase (Figure 7B). The Lands cycle uses a network of phospholipase and acyl-CoA transferase proteins to remove oxidatively damaged acyl chains and replace them with new fatty acids mobilized by CoA or stored as acylcarnitines.33,34 This process involves fatty acid desaturases, which become activated in mature red blood cells in environments of increasing oxidative stress.35 Although the transcript levels of SCD1, SCD2, and SCD3 only modestly decreased in primitive OrthoEs (Figure 7C), the amount of unsaturated fatty acyl chains in the lipidome increased (Figure 7C), evidencing accumulation of oxidative stress to membranes within this cell population. In parallel, the levels of all free fatty acids, saturated and polyunsaturated, decreased during maturation, except for docosahexaenoic acid (Figure 7E). On the other hand, several oxylipins (including 9- and 13-hydroxyoctecedenoic acids and leukotriene B4) were found to accumulate in primitive OrthoEs (Figure 7E). Of note, p53, a negative indirect repressor of cholesterol synthesis as a result of direct transcriptional regulation of the cholesterol transporter ABCA1,36 was significantly downregulated in primitive OrthoEs compared with BasoEs at the transcript level (Figure 7F). In contrast, the expression levels and activity of the ferrireductase STEAP3, a transcriptional target of p5337 that regulates secretion of exosomal38 and autophagic endosomal vesicles,39 have been shown to correlate with oxylipin accumulation in mature murine red blood cells.40 Despite the accumulation of oxylipins and increases in the transcriptional levels of STEAP3 during the transition from BasoEs to OrthoEs, STEAP3 protein levels were found to decrease during maturation (Figure 7G). Given the role of the p53 signaling axis in ferroptosis,41 it is interesting to note that the protein levels of ferroptosis-related mitochondrial GPX4 were significantly higher in primitive OrthoEs compared with BasoEs (Figure 5I). In addition, unexpected increases in transcriptional levels of ABCA1 and decreases in transcripts for several rate-limiting enzymes of the cholesterol synthesis pathway, including hydroxymethyl-glutaryl-CoA reductase and mevalonate and phosphomevalonate kinases (Figure 7H), suggest that cells rely on cholesterol uptake from the milieu rather than at terminal stages of primitive erythropoiesis. Although these proteins were not observed in our proteomic data set, they have been found to progressively decrease during definitive ex vivo erythroid maturation in murine cells17 (supplemental Figure 24). In support of this conjecture, we observed the accumulation of cholesteryl esters (16:0, 16:1, 18:0, 18:1, 20:1, and 20:4 above all), which functioned to store cholesterol as it accumulated (Figure 7I). This consideration may have implications for the ex vivo culturing of erythroid precursors for expansion and/or maturation.10
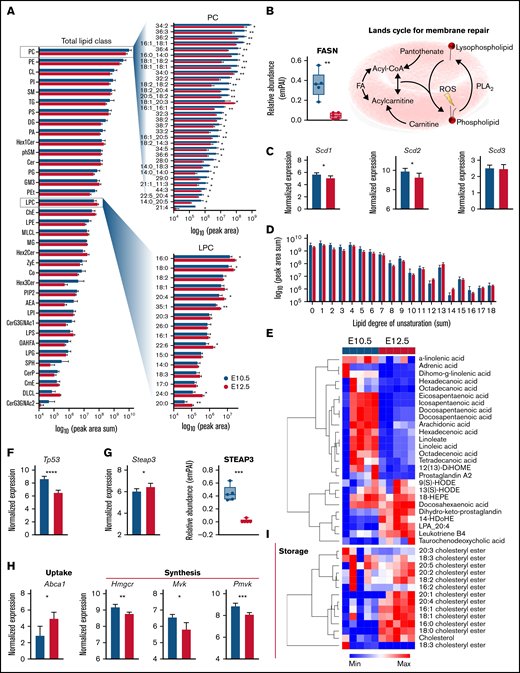
Lipidomic analysis of primitive erythroid precursors at E10.5 and E12.5 of gestation. (A) Peak areas for detected lipids were summed according to head groups and classes plotted as horizontal bar plots according to log10 (peak area sum). Top significant lipids from phophatidylcholines (PCs) and lysophosphatidylcholines (LPCs) are highlighted. (B) Relative protein levels for fatty acid (FA) synthase (FASN) along with an illustration of the Lands cycle are shown. (C) Relative transcript levels for steayl-CoA desaturase 1 (SCD1), SCD2, and SCD3 are plotted. (D) Peak areas for lipids were consolidated by the cumulative degree of unsaturation in acylchains and plotted as bar graphs. (E) Heat map depicting z score normalized values for FAs and oxylipins. (F-G) Transcript levels of Tp53 (F) and STEAP3 (G) along with protein levels are shown. (I) Transcript levels for cholesterol pathway proteins (ABCA1), HMG-CoA reductase (Hmgcr), mevalonate kinase (Mvk), and phosphomevalonate kinase (Pvmk) are shown. (J) Heat map depicting z score normalized values for cholesteryl esters. *P < .05, **P < .01, ***P < .001, ****P < .0001.
Lipidomic analysis of primitive erythroid precursors at E10.5 and E12.5 of gestation. (A) Peak areas for detected lipids were summed according to head groups and classes plotted as horizontal bar plots according to log10 (peak area sum). Top significant lipids from phophatidylcholines (PCs) and lysophosphatidylcholines (LPCs) are highlighted. (B) Relative protein levels for fatty acid (FA) synthase (FASN) along with an illustration of the Lands cycle are shown. (C) Relative transcript levels for steayl-CoA desaturase 1 (SCD1), SCD2, and SCD3 are plotted. (D) Peak areas for lipids were consolidated by the cumulative degree of unsaturation in acylchains and plotted as bar graphs. (E) Heat map depicting z score normalized values for FAs and oxylipins. (F-G) Transcript levels of Tp53 (F) and STEAP3 (G) along with protein levels are shown. (I) Transcript levels for cholesterol pathway proteins (ABCA1), HMG-CoA reductase (Hmgcr), mevalonate kinase (Mvk), and phosphomevalonate kinase (Pvmk) are shown. (J) Heat map depicting z score normalized values for cholesteryl esters. *P < .05, **P < .01, ***P < .001, ****P < .0001.
Discussion
In the present study, we performed proteomic and metabolomic analyses of primary erythroid precursor populations isolated from E10.5 and E12.5 mouse embryos, which predominantly contain semisynchronously maturing primitive BasoEs and OrthoEs, respectively7,8 (the traits of erythroid precursor populations was reviewed by Palis5 ). The main results for protein and metabolite levels involved in central carbon and nitrogen metabolism are summarized in Figure 8. A substantial upregulation of the PPP was observed during primitive erythroid maturation, both at the protein and metabolite levels. This finding supports a central role for the management of ROS during the course of erythropoiesis rather than anabolism, because the decreasing levels of many anabolic enzymes and organelles suggest a diminishing synthetic capacity of OrthoEs. Furthermore, PPP activation suggests that G6PD deficiency, which is the most common enzymopathy in humans, affecting ∼400 million people worldwide, may affect not only mature red blood cells with a reduced redox capacity42,43 but maturing erythroid precursors as well. Because the redox regulator ataxia telangiectasia mutated (ATM) is a direct transcriptional regulator of G6PD,44 with a role in chemoresistance in malignant hematopoiesis,45 it is interesting to note that ATM is downstream of FOXO3 in the bone marrow and participates in the regulation of ROS in erythropoiesis.46,47 Interestingly, the most upregulated pathway in primitive OrthoEs compared with BasoEs involved components related to the regulation of ROS, both in the soluble (CAT and peroxiredoxins) and lipid fractions (GPX4). Indeed, despite increases in oxylipins and decreases in free glutathione, primitive OrthoEs were characterized by lower levels of ROS at baseline and after H2O2 supplementation.
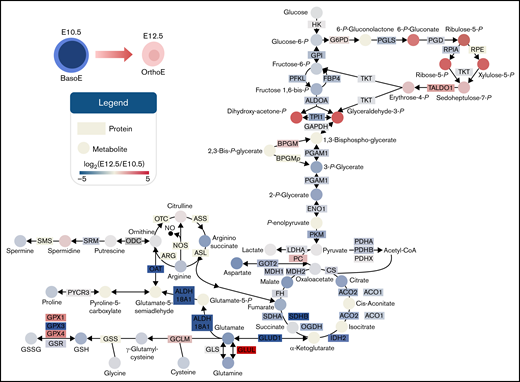
Summary of metabolic and protein changes in central carbon metabolism in primitive BasoEs at E10.5 vs primitive OrthoEs at E12.5 of mouse gestation. Proteins are indicated by rectangles, and metabolites are indicated by circles. The filled color of each is proportional to the log2(fold change) at E12.5 with respect to E10.5 level, where blue to red represents a log2(fold change) of −5 to 5, respectively. Gene symbols are provided for each protein. ALDO, aldolase; BPGM, bisphosphoglycerate mutase; ENO, enolase; FH, fumarate hydratase; GAPDH, glyceraldehyde-3-phosphate dehydrogenase; GSH, reduced glutathione; GSSG, oxidized glutathione; LDHA, lactate dehydrogenase-A; OGDH, oxoglutarate dehydrogenase; PFKL, phosphofructokinase, liver type; PGD, phosphogluconate dehydrogenase; RPE, ribulose-phosphate 3-epimerase; RPIA, ribose-5-phosphate isomerase A; SDH, succinate dehydrogenase; TALDO, transaldolase; TKT, transketolase.
Summary of metabolic and protein changes in central carbon metabolism in primitive BasoEs at E10.5 vs primitive OrthoEs at E12.5 of mouse gestation. Proteins are indicated by rectangles, and metabolites are indicated by circles. The filled color of each is proportional to the log2(fold change) at E12.5 with respect to E10.5 level, where blue to red represents a log2(fold change) of −5 to 5, respectively. Gene symbols are provided for each protein. ALDO, aldolase; BPGM, bisphosphoglycerate mutase; ENO, enolase; FH, fumarate hydratase; GAPDH, glyceraldehyde-3-phosphate dehydrogenase; GSH, reduced glutathione; GSSG, oxidized glutathione; LDHA, lactate dehydrogenase-A; OGDH, oxoglutarate dehydrogenase; PFKL, phosphofructokinase, liver type; PGD, phosphogluconate dehydrogenase; RPE, ribulose-phosphate 3-epimerase; RPIA, ribose-5-phosphate isomerase A; SDH, succinate dehydrogenase; TALDO, transaldolase; TKT, transketolase.
With a direct role in ROS management, ATM is an upstream positive regulator of the tumor suppressor protein p53.48 Despite decreases in the transcription of p53, primitive OrthoEs were characterized by increases in the cholesterol transporter ABCA1, a p53 target,36 and were mirrored by increases in intracellular esterified cholesterol and corresponding decreases in transcript levels of several rate-limiting cholesterol synthesis enzymes that are regulated by p53 (hydroxymethyl-glutaryl-CoA reductase and mevalonate and phosphomevalonate kinases).36 These observations highlight an additional role for p53 in erythropoiesis, in addition to its function of driving a transcriptional program in maturing progenitors in coordination with arrested ribosome biogenesis.49 A role for p53 in modulating cholesterol dynamics36 highlights complex reprogramming for membrane dynamics as well. Indeed, mature erythrocytes are incapable of synthesizing new lipids and must replace oxidatively damaged lipids using scavenged fatty acids from surrounding environments through the Lands cycle.34 We observed a putative activation of this process that was evident from decreasing phosphatidylcholine species and increasing lyophosphatidylcholine species, indicating increased phospholipase activity. Although this process has been characterized in circulating erythrocytes in the contexts of health (such as in exercise50 ) and disease (including sickle cell disease51 and hemodialysis for kidney dysfunction52 ), its role in terminal erythropoiesis has not yet been studied in depth.
Membrane oxidative stress is in part managed by GPX4. In addition to this role, GPX4 is also an inhibitor of p53-inducible41 ferroptosis. Its increased levels observed here in primitive OrthoEs perhaps indicate a compensatory mechanism to counteract the accumulation of oxylipins in this population. Notably, decreases in the protein levels of the p53-regulated ferrireductase STEAP353 were accompanied by increases in the levels of its transcript. Increased STEAP3 activity has been associated with accumulation of oxylipins in mature erythrocytes upon storage in the blood bank, as well as with their capacity to circulate upon transfusion into the recipient.40 Collectively, these results indicate that p53 signaling may play a regulatory role in terminal erythroblast maturation, a hypothesis that will warrant further investigation in genetically ablated mice. In support of this hypothesis, it is worth noting that p53 is a target of the master regulator of hematopoiesis PU.1,54 which promotes p53 transcriptional activity by mediating phosphorylation at S1555 and regulates the proliferation of immature erythroid progenitors.56
Perhaps the most striking observation in this study is that terminal erythroblast maturation was accompanied by widespread loss of the protein machinery components responsible for mRNA maturation, translation, and posttranscriptional regulation. Proteome remodeling in this context was driven largely by proteasomal degradation, which was dependent on the activity of UBE2O, a broad-spectrum ubiquitin-conjugating enzyme that targets ribosomal proteins for degradation during terminal erythroid maturation.57 Of the 2112 proteins measured in this study, UBE2O was one of the most significantly increased proteins in OrthoE cells, thereby reinforcing its central role in this developmental process. Furthermore, these results confirm and expand upon our previous observations of erythropoiesis at the transcriptional level,8 in that they also highlight a parallel increase in the levels of hemoglobin subunits,58 band 3, and antioxidant enzymes. By augmenting an extant transcriptomic database8 with original proteomic and metabolomic analyses, our results complement elegant studies from other groups who focused on the transcriptome and proteomes of erythroid precursors during maturation of in vitro cultured definitive erythroid precursors.17 Of note, concomitant increases in the expression of band 3 and hemoglobin could help explain the activation of the PPP as a function of environmental oxygen levels, a phenomenon termed oxygen-dependent metabolic modulation.59 In this view, it is worth noting that primitive OrthoEs were characterized by higher levels of biphosphoglycerate mutase at the transcript and protein levels, which regulate bisphosphoglycerate synthesis and, in so doing, hemoglobin oxygen binding curves.27 It remains to be assessed whether rare genetic anomalies affecting the N-terminus of band 3 also result in impaired primitive erythropoiesis, in addition to well-established defects in mature red blood cell redox homeostasis (eg, band 3 Neapolis is accompanied by reticulocytosis and erythrocytes with a compromised structure and metabolism).60,61 Because this mechanism can also be regulated by phosphorylation of the N-terminus of band 3 by Lyn and Syk kinases, it will be interesting to probe whether the activity of these enzymes plays a role in primitive erythroid maturation by regulating the band 3 respiratory metabolon28,62 and overall interactome,63 in addition to their well-established role in definitive erythroid expansion, maturation, and differentiation via phosphorylation of GAB2/Akt/FoxO3 and STAT5.64,65
Significant depletion of mitochondrial proteins, including structural components, proteins involved in mitochondrial RNA metabolism, electron transport chain components, and TCA cycle enzymes, was accompanied by a significant depression of steady-state levels of carboxylic acids, amino acids, acylcarnitines, and free fatty acids. These results point to a loss of mitochondrial metabolism, which contributes to explaining the progressive activation of glycolysis despite decreases in the levels of glycolytic enzymes. Increases in the levels of FIS1, a key mediator of mitochondrial fission and mitophagy through the AMPK/FIS1 axis in malignant hematopoiesis66 and erythropoiesis,67 signal ongoing mitophagy during the later stages of erythroid maturation. In particular, FIS1 drives peripheral (rather than midzone) mitochondrial fission to promote cell survival under stress rather than promoting mitochondrial biogenesis during proliferation, and its function is preceded by loss of mitochondrial membrane potential and increased ROS.68 Although loss of membrane potential is elicited by numerous mechanisms, it is interesting to consider the role that spermidine plays in inducing mitophagy via accumulation of ROS and subsequent activation of ATM.69 Our observations here of persistent spermidine levels at the OrthoE stage despite decreases of the neighboring polyamine spermine suggest a mechanistic role for this metabolite in erythroid maturation that merits further exploration.
Combined analysis of metabolomic and transcriptomic data also highlighted a potential role of linoleic acid metabolism in primitive erythroid maturation. Recently, a role was suggested for linoleic acid metabolism in hematopoietic stem cell function with aging, as constrained by the activity of fatty acid desaturase 2 and its lysosomal degradation mediated by LAMP2A.70 Of note, this pathway also contributes to chemoresistance in malignant hematopoiesis.71 However, we noted increases in very long chain, highly unsaturated fatty acids in primitive OrthoEs that mirrored decreased catabolism, in a manner similar recent observations in malignant hematopoietic stem cells.72 Further characterization of this aspect of a requisite developmental process in comparison with hematopoietic malignancy may reveal new insights into understanding carcinogenesis.
This study is not without limitations. Here, we focused specifically on 2 stages of primitive erythroblast maturation that can be isolated at relatively high purity and in sufficient numbers from staged mouse embryos to facilitate proteomic and metabolomic studies. However, the collection of cells from the bloodstream likely led to some contamination of the E12.5 samples with platelets, as evidenced by the identification of a small set of upregulated proteins associated with platelet activation and aggregation (Figure 1E; supplemental Figure 1B). A more extensive overview of primitive erythropoiesis would have provided a better clue on the stage-specific sequence of metabolic/proteomic events that occur as this unique lineage emerges at E7.5 to E9.5 and ultimately transitions to enucleated erythrocytes between E12.5 and E16.5. It would be of interest to compare our findings in primitive erythroid cells with their definitive counterparts, as well as with cells from other mammalian and nonmammalian species, to determine which changes are common to erythroid precursor maturation. Finally, clues to the potential functional roles of PPP activation, altered membrane repair mechanisms, increased oxylipin metabolism, and cholesterol uptake will all need to be tested with a combination of pharmacologic or genetic interventions, ideally in the presence of stable isotope–labeled tracers in vivo and ex vivo.
Acknowledgments
Research reported in this publication was funded by National Institute of General and Medical Sciences, National Institutes of Health (NIH), grant RM1GM131968 (A.D.A.); National Heart, Lung, and Blood Institute, NIH, grants R01HL146442, R01HL149714, R01HL148151, and R21HL150032 (A.D.A.) and R01HL130670 (J.P., P.D.K., K.E.M.); and National Institute of Diabetes and Kidney Diseases, NIH, grant R01DK119285 (J.P., P.D.K., K.E.M.).
The content is solely the responsibility of the authors and does not necessarily represent the official views of the National Institutes of Health.
Authorship
Contribution: P.D.K. and J.P. designed methods to collect primitive erythroid cells and performed in vivo animal studies with K.E.M. T.N. and A.D.A. performed metabolomic analyses, and M.D. and K.C.H. performed proteomic analyses; T.N., A.D.A., and K.E.M. prepared figures; T.N., J.P., and A.D.A. wrote the manuscript; and all authors critically contributed to the progress of the project and finalization of this manuscript.
Conflict-of-interest disclosure: A.D.A. and T.N. are founders of Omix Technologies, Inc., and Altis Biosciences, LLC; A.D. is a scientific advisory board member for Hemanext, Inc., and FORMA Therapeutics, Inc.; and A.D.A. and J.P. are consultants for Rubius Therapeutics, all unrelated to the contents of this manuscript. The remaining authors declare no competing financial interests.
Correspondence: James Palis, Department of Pediatrics, Box 777, University of Rochester Medical Center, 601 Elmwood Ave, Rochester, NY 14642; e-mail: james_palis@urmc.rochester.edu; and Angelo D’Alessandro, Department of Biochemistry and Molecular Genetics, University of Colorado Anschutz Medical Campus, 12801 East 17th Ave, Aurora, CO 80045; e-mail: angelo.dalessandro@ucdenver.edu.

![Proteomic analyses of primitive erythroid precursors at E10.5 and E12.5 of gestation. (A) Erythroid precursors were isolated from the bloodstream of murine embryos at E10.5 and E12.5 of development, predominantly consisting of BasoEs and OrthoEs, respectively, and analyzed by LC-MS/MS proteomics. (B-D) Significant changes between the 2 groups (n = 5) were observed by unsupervised principal component analysis (PCA) (B), partial least square discriminant analysis (variable importance in projection [VIP] plots for PC1 are shown) (C), and hierarchical clustering analysis of the top 1000 significantly different proteins (t test) (D). (E) Highlight of the top 75 significantly different entries from this analysis is provided in the heat map.](https://ash.silverchair-cdn.com/ash/content_public/journal/bloodadvances/6/10/10.1182_bloodadvances.2021005975/3/m_advancesadv2021005975f1.png?Expires=1768098354&Signature=3tBcd-mVBWeMvtRgOc51CLSc7KPrBd3n6dYRCHCY9d5vPUUTEMz7Tdyxb6wBbu8GPM-GW9axVBHDZeM6HSDY0YHm0dQHH2d~xCtOhByi1YVZtUe6qEzMRJi8rT2eryLxtqEtMzXlPPE3ABkUA-H~XXIlyXeebnbWeZKf2ChzyF~iDfdewpW7UOVNr1D9lo9ZXXXsRJlo4VIjHsbD1cVYpX92CxYQrcPx0xa6iV~IAjWV4hzZgj0nnZ7NOzuL5NWOYt-tUGOTSYEWtytTQbHCdrY2mC4wLcgZc2FxSwRkxSC0-Ig9-UEn3VrG69B5BA-1ekZrXc~r3CjycQMW2dWrLQ__&Key-Pair-Id=APKAIE5G5CRDK6RD3PGA)
![Metabolomic analyses of primitive erythroid precursors at E10.5 and E12.5 of gestation. (A) Erythroid precursors were isolated from the bloodstream of murine embryos at E10.5 and E12.5 and analyzed by LC-MS metabolomics. (B-D) Significant changes between the 2 groups (n = 5) were observed by unsupervised PCA analysis (B), partial least square discriminant analysis (variable importance in projection [VIP] plots for PC1 are shown) (C), and hierarchical clustering analysis (HCA) of the top 75 significantly different proteins (t test) (D). Analyses in panels B to D were performed upon normalization against a pool of data obtained from E10.5 samples and autoscaled. (E) Volcano plot representation of original raw data.](https://ash.silverchair-cdn.com/ash/content_public/journal/bloodadvances/6/10/10.1182_bloodadvances.2021005975/3/m_advancesadv2021005975f3.png?Expires=1768098354&Signature=b0N9paCdypstARrKid4IUAGZNpsjBaojyf0XfkI3oQxi0Saz9YIaZppRVRIoaovSIR5qTaHeY6NLQBCFy9pVTV4JrqtsTNy-HRZYo0UgtA8uYIEwFzsXb~aAzxJ~PL1ReNCkRCqgbTQJKcxhEdSN1kTZrn-ZVrvt2z33KMBihzVK6JBXcIK-vKX82bx-JL-BluagujSXCdyRFMlwbIK2VUrKfOlLuzegb3Wt2bXH-0UPyl3z7d0y5OuwXedJWUQJFUJ9VHI99SJAR~9~o2q~NRZak9cviRp5M6zL-ZtmkU0ZB-bB6xN~CbazP092BTLNPRkfZ~jriaarp46ZAimYOg__&Key-Pair-Id=APKAIE5G5CRDK6RD3PGA)