Key Points
LncRNAs regulate erythroid differentiation through coordinating with chromatin accessibility.
The integrative multi-omics analysis reveals stage-specific regulatory association of lncRNAs and chromatin accessibility in erythropoiesis.

Abstract
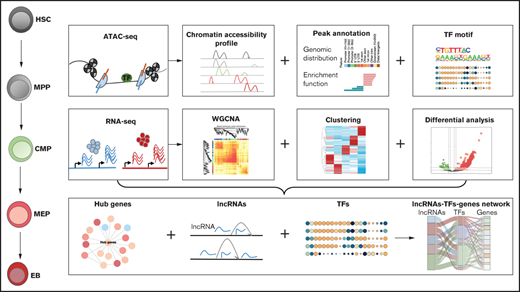
Erythroid differentiation is a dynamic process regulated by multiple factors, whereas the interaction between long noncoding RNAs (lncRNAs) and chromatin accessibility and its influence on erythroid differentiation remains unclear. To elucidate this interaction, we used hematopoietic stem cells, multipotent progenitor cells, common myeloid progenitor cells, megakaryocyte-erythroid progenitor cells, and erythroblasts from human cord blood as an erythroid differentiation model to explore the coordinated regulatory functions of lncRNAs and chromatin accessibility by integrating RNA-seq and ATAC-seq data. We revealed that the integrated network of chromatin accessibility and lncRNAs exhibits stage-specific changes throughout the erythroid differentiation process and that the changes at the erythroblast stage of maturation are dramatic. We identified a subset of stage-specific lncRNAs and transcription factors (TFs) that associate with chromatin accessibility during erythroid differentiation, in which lncRNAs are key regulators of terminal erythroid differentiation via an lncRNA-TF-gene network. LncRNA PCED1B-AS1 was revealed to regulate terminal erythroid differentiation by coordinating GATA1 dynamically binding to the chromatin and interacting with the cytoskeleton network during erythroid differentiation. DANCR, another lncRNA that is highly expressed at the megakaryocyte-erythroid progenitor cell stage, was verified to promote erythroid differentiation by compromising megakaryocyte differentiation and coordinating with chromatin accessibility and TFs, such as RUNX1. Overall, our results identify the associated network of lncRNAs and chromatin accessibility in erythropoiesis and provide novel insights into erythroid differentiation and abundant resources for further study.
Introduction
The human body produces approximately 2 × 10¹¹ erythroid cells per day to meet the requirements for oxygen delivery and carbon dioxide exchange.1 In adults, the process of erythropoiesis is generated from hematopoietic stem cells (HSCs) in bone marrow, which differentiate into multipotent progenitor (MPP) cells and common myeloid progenitor (CMP) cells, followed by differentiation into megakaryocyte-erythroid progenitor (MEP) cells, erythroid progenitor cells, and erythroblasts (EBs), which then denucleate to form reticulocytes that are released into the bloodstream, where they eventually become erythrocytes.2
Erythroid differentiation is a dynamic and precisely regulated process at multiple levels. Any abnormal regulation may damage the formation of erythroid cells, which will cause erythropoiesis-related diseases. Previous studies have made advancements in elucidating the roles of cytokines, transcription factors (TFs), microRNAs, epigenetic modifiers, and signaling pathways,3-6 but the regulatory mechanisms of the interactivity of long noncoding RNAs (lncRNAs) and chromatin accessibility lack comprehensive exploration during erythroid differentiation.
The chromatin structure is essential for gene expression. Chromatin accessibility enables access to TFs that specify the transcriptional regulation in certain cell type, and this epigenetic variance determines lineage commitment and hematopoietic differentiation process.7-11 Previous studies defined some characteristics regarding transcriptome and chromatin accessibility during erythroid differentiation and explored the regulatory mechanism of erythropoiesis at multiple omics levels.10-13 However, few studies have focused on the interaction between lncRNA and chromatin accessibility during erythroid differentiation that will provide a novel mechanism underlying erythropoiesis in a different way.
LncRNAs have a length >200 nt and are noncoding RNAs with a wide range of mechanisms that combine with DNA, RNA, and protein to regulate gene expression and modify chromatin formation.14,15 Previous studies found that lncRNAs are involved in the regulation of hematopoiesis and erythroid differentiation.14-17 Similar to chromatin accessibility, lncRNA expression in erythroid differentiation presents strong stage specificity and poor conservation in species.10,18,19 We infer that lncRNAs could associate with chromatin accessibility during erythroid differentiation, which has not been clarified in this field.
To better understand the regulatory functions of chromatin accessibility and lncRNAs during erythroid differentiation, we performed an integrative analysis of the chromatin accessibility and transcriptome data. We established a comprehensive landscape of chromatin accessibility and the dynamics of lncRNAs during erythroid differentiation. We observed that dynamic interactions between lncRNAs and chromatin accessibility are stage specific throughout the erythroid differentiation process and first computationally identified an lncRNA-TF-gene interactive network that regulates terminal erythroid differentiation. Two lncRNAs, including DANCR and PCED1B-AS1, were functionally characterized as regulators at specific cell stages in coordination with chromatin accessibility and the TFs during erythroid differentiation. Our findings provide new insights into the dynamic interactive network of lncRNA and chromatin in human erythropoiesis, which may lead to the discovery of biomarkers for preventing or treating erythropoietic or hematopoietic diseases.
Methods
Cell models and data availability
We used HSCs, MPP cells, CMP cells, MEP cells, and EBs from human cord blood as a cell model of erythroid differentiation. EBs represent the erythroblastic series of erythropoiesis, including pro-E, baso-E, poly-E, and ortho-E. The different cell stages during erythroid differentiation were defined based on BLUEPRINT project, and the raw RNA-seq data were obtained from the BLUEPRINT20 database, which include EGAD00001000907, EGAD00001000911, EGAD00001000915, EGAD00001000919, EGAD0000100939, EGAD00001001140, EGAD00001001156, EGAD00001001169, EGAD00001001177, EGAD00001001186, EGAD00001001492, EGAD00001001515, EGAD00001001538, EGAD00001001550, EGAD00001001561, EGAD00001002316, EGAD00001002358, EGAD00001002363, EGAD00001002433, and EGAD00001002478. The ChIP-seq data were downloaded from the BLUEPRINT Data Coordination Center portal. The ATAC-seq data were derived from the GSE74912 dataset. The members of the ethics committee at Beijing Institute of Genomics, Chinese Academy of Sciences unanimously agreed that the research scheme is scientific and in line with the requirements of ethical principles. The data of the subject were kept confidential. The subject signed the informed consent form and was clearly informed of rights and interests.
Data preprocessing of RNA-seq data and ATAC-seq
FastQC was used to check the quality of RNA-seq and ATAC-seq raw data. Trimmomatic and TrimGalore were used to remove the adapters and low-quality reads. RNA-seq and ATAC-seq reads were then aligned to the human genome (GRCh37/hg19) using STAR21 and bowtie2, respectively, with the default parameters. RSEM22 was then used to quantify the transcripts of RNA-seq data, from which a gene expression matrix and transcriptional expression matrix were constructed. We used picard-tools to mark polymerase chain reaction (PCR) duplicates with the parameter “REMOVE_DUPLICATES=true” for ATAC-seq data. We then filtered the mitochondrial reads of processed ATAC-seq data using samtools and “grep -v′chrM′” command. ATAC-seq peaks were finally obtained using callpeak function in MACS223 with parameters “–nomodel, –shift 100 and –extsize 200.” The phantompeakqualtools package was used to calculate the chain cross-correlation24 for evaluating the ATAC-seq data quality. Bioconductor package ChIPQC was also used to evaluate the signal distribution of the ATAC-seq.25
Functional enrichment analysis of differentially expressed genes
The raw counts matrix was filtered with rowSums equal to 0, and DESeq2 was used for differential analysis. P adjust value <.05 and |log2FoldChange|>1 were used as the threshold. The cluterProfiler R package26 was used to analyze and visualize functional profiles of gene. We combined the results from molecular function, cellular component, and biological process classes of gene ontology and retained the function terms based on enrichment score and P value.
Weighted gene coexpression network analysis
Weighted gene coexpression network analysis (WGCNA) is performed to analyze gene expression patterns of multiple samples, by which genes with similar expression patterns can be clustered into 1 module, so that the correlation between the module and specific traits can be calculated, which facilitates identification of key regulation factors and elucidates mechanisms of biology development, tumorigenesis, and other diseases.27 We constructed 14 gene coexpression modules of each lineage during erythroid differentiation using WGCNA R package.
The connectivity of an intramodule network refers to the sum of the correlations among genes in that module. Genes with high connectivity within a module are considered hub genes. Hub genes are usually regulatory factors and thus are located upstream in the regulatory network.27 We selected the modules that were significantly correlated with each cell type and calculated the intraconnectivity among the modules. The hub genes in each module were then screened according to the threshold of module with a connectivity >0.8.
Differential peak analysis and peak annotation
We chose DiffBind R package for differential peak based on DESeq228 and ChIPseeker R package for peak annotation.29 We first defined the range of promoter as 1 kb upstream or downstream of the transcription start site. AnnotatePeak function was used to annotate peaks. We obtained the genomic distribution feature of the peaks and lncRNAs (ie, promoter, intron, or exon). We annotated the adjacent genes of peaks and extracted all the genes in the promoter and distal regions as well as the annotated genes and then conducted functional enrichment analysis using the clusterProfiler R package.26
TF motif analysis
Motif enrichment analysis of each stage and the differential peaks was performed using HOMER software. The command module “findmotifsgenome.pl” with the parameter “-len 8,10,12” was used to identify motif sequences with lengths of 8, 10, and 12 bp. The motif files were then filtered based on P value <1e-10 threshold. The corresponding TFs of the motif were also filtered according to the threshold of FPKM >5. We identified 65 TF motifs enriched in each cell phase during erythroid differentiation and 43 TFs motif enriched in differential peaks. We then selected some TFs with more stage-specific and plotted them with ggplot2 in R.
Identification of mRNA and lncRNAs
We extracted mRNAs and lncRNAs based on genome annotation files from ensembl. Clustering analyses of mRNAs and lncRNAs were performed using hclust. We then screened for significant lncRNAs that may regulate erythroid differentiation, which integrated the stage-specific lncRNAs with differentially expressed lncRNAs and the lncRNAs intersecting in the accessible chromatin region. We constructed a diagram of the intersection of the three datasets using UpSet plot with TBtools.
Establishment of lncRNA-TF-gene regulatory network
We predict regulation factors within 1 kb of the lncRNAs and hub genes combining the ChIP-seq/DNase I-seq/ATAC-seq data of EBs from the Cistrome Data Browser toolkit (http://dbtoolkit.cistrome.org) with the previously screened lncRNAs.30-32 Regulatory factors that corresponded to EBs with regulatory potential (RP) scores >0.5 were retained. RP scores are defined by the binding and expression target analysis algorithm,33 which is used to evaluate how likely factors regulate interested genes or lncRNAs. Factors with high RP scores represent high potential to regulate the given lncRNAs or genes.33 We then construct a potential lncRNA-TF-gene regulatory network by integrating the TFs, hub genes, and lncRNAs identified before.
Results
Dynamics of chromatin accessibility and transcriptome during erythroid differentiation
The peaks number for chromatin accessibility reflects changes of chromatin state. The average peaks of HSCs, MPP cells, and CMP cells are similar, with >100 000 peaks each, whereas the peaks number for MEP began to gradually decrease and then sharply decreased at EB stage, with an average of only 33 457 peaks (Figure 1A). Chromatin accessibility condenses in terminal erythroid differentiation, and erythroid-specific TFs were active to participate in erythroid differentiation, such as GATA1 and KLF1.34-38 The dramatically decreased peaks may be related to condensed chromatin and/or TF binding. To verify whether the changes at the transcriptome level correspond with chromatin accessibility, we counted the number of genes and lncRNAs. The number of expressed genes in EBs was significantly lower than that at other differentiation stages (Figure 1B). The decreased number of expressed genes may be related to the process of terminal erythroid differentiation and development. However, the number of lncRNAs in EBs increased significantly compared with numbers in adjacent stages, which is different from the changes in chromatin accessibility and expressed genes (Figure 1C). LncRNAs have been observed to act in various ways, including binding to DNA and RNA, regulating TFs and chromatin structures,39-41 and regulating terminal erythroid differentiation.39,42,43 Moreover, the average number of lncRNAs in HSCs is also higher than that of adjacent stages (Figure 1C). Previous studies also showed that lncRNAs hosted in HSCs are involved in the regulation of HSC stemness and differentiation.19,44
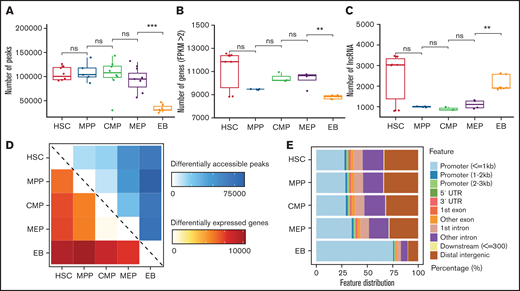
Dynamic changes in chromatin accessibility and the transcriptome during erythroid differentiation. (A) Peaks in ATAC-seq data. The boxplot illustrates the number of accessible chromatin regions at each stage during erythroid differentiation. (B) Number of genes at each stage from RNA-seq data with FPKM >2. (C) Number of lncRNAs at each stage during erythroid differentiation. (D) Heatmap showing the number correlation of differentially accessible peaks of chromatin (top, blue) and differentially expressed genes (bottom, red) during erythroid differentiation. (E) Genomic distribution features of accessible chromatin. The bar plot shows the percentage of ATAC-seq peaks intersecting with the promoter, UTR, exon, intron, and distal intergenic. Statistical results were analyzed using a Kruskal-Wallis test.
Dynamic changes in chromatin accessibility and the transcriptome during erythroid differentiation. (A) Peaks in ATAC-seq data. The boxplot illustrates the number of accessible chromatin regions at each stage during erythroid differentiation. (B) Number of genes at each stage from RNA-seq data with FPKM >2. (C) Number of lncRNAs at each stage during erythroid differentiation. (D) Heatmap showing the number correlation of differentially accessible peaks of chromatin (top, blue) and differentially expressed genes (bottom, red) during erythroid differentiation. (E) Genomic distribution features of accessible chromatin. The bar plot shows the percentage of ATAC-seq peaks intersecting with the promoter, UTR, exon, intron, and distal intergenic. Statistical results were analyzed using a Kruskal-Wallis test.
We further analyzed the significantly differential accessible peaks, expressed genes, and lncRNAs during erythroid differentiation. We found that the numbers of differentially chromatin accessible peaks highly correlated with the numbers of differentially expressed genes between stages (Figure 1D). Moreover, there were more upregulated lncRNAs than downregulated lncRNAs between MEP cells and EBs (supplemental Figure 1), which exhibited the importance of lncRNAs in terminal erythroid differentiation. The genomic distribution of accessible chromatin showed that the proportion of accessible chromatin in promoters began to increase at the MEP stage and significantly increased at the EB stage by >75% (Figure 1E). This finding suggests that a large proportion of accessible chromatin distributed in promoters may promote gene expression between MEP cells and EBs. Taken together, dynamic changes in chromatin accessibility and lncRNAs were observed during erythroid differentiation, and the changes during the differentiation from MEP to EB stage were dramatic.
Characterization of functions associated with chromatin accessibility and the transcriptome during erythroid differentiation
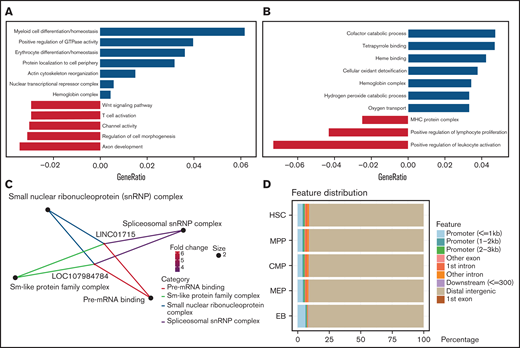
To understand the biological functions of differential chromatin accessibility, differentially expressed lncRNAs, and genes during erythroid differentiation, we performed functional enrichment analysis. Compared with MEP cells, the enhanced accessible chromatins at the EB stage were enriched in the functions of erythroid differentiation (P = 3.18e-6), myeloid differentiation (P = 7.31e-7), actin cytoskeleton reorganization (P = 1.26e-5), and hemoglobin complex (P = 7.84e-5) (Figure 2A), which are essential processes during erythroid differentiation.3 Consistently, the functions of upregulated genes at the EB stage correlated closely with erythroid differentiation, including the functions of tetrapyrrole binding (P = 8.02e-6), heme binding (P = 2.95e-5), hemoglobin complex (P = 1.64e-13), and oxygen transport (P = 1.36e-10) (Figure 2B). Furthermore, we found that higher expression of erythroid-related genes corresponds to more accessible chromatin between MEP cells and EBs (supplemental Figure 2A); however, as control, leukocyte-related genes do not (supplemental Figure 2B).

Function of differentially accessible chromatin and transcriptomes. (A-C) Functional enrichment of differential chromatin accessibility (A), differentially expressed genes (B), and lncRNAs (C) between the MEP cell and EB stages. (D) Distribution features of chromatin accessibility peaks related to lncRNAs.
Function of differentially accessible chromatin and transcriptomes. (A-C) Functional enrichment of differential chromatin accessibility (A), differentially expressed genes (B), and lncRNAs (C) between the MEP cell and EB stages. (D) Distribution features of chromatin accessibility peaks related to lncRNAs.
Interestingly, the enrichment analysis of lncRNAs between MEP cells and EBs showed that only 2 lncRNAs, LOC107984784 and LINC01715, were annotated as relating to the functions of spliceosomal small nuclear ribonucleoprotein complex (P = .69e-2) and pre-mRNA binding (P = .67e-3) (Figure 2C). To explore the relationship between lncRNAs and chromatin, we annotated chromatin accessibility peaks on the lncRNA distribution features and found that peaks related to lncRNA are mainly distributed on distal genomic regions (Figure 2D). In addition to the MEP and EB stage, we also observed the distinct functions underlying the changes in chromatin accessibility and transcriptomes from HSCs to MEP cells (supplemental Figure 2C-D), illustrating that these epigenetic changes represent the stage-specific state during erythroid differentiation.
Stage-specific TFs and hub genes contribute to erythroid differentiation
Open chromatin can be bound by TFs as an essential process in transcriptional regulation.45 By integrating chromatin accessibility and the transcriptome profile, we performed motif enrichment analysis and characterized 65 TFs in each stage (Figure 3A; supplemental Table 2) and 44 TFs enriched in differential chromatin accessibility peaks (Figure 3B; supplemental Table 3), demonstrating that the regulation of TFs or chromatin accessibility is cell stage specific during erythroid differentiation. Some TFs are well known to promote erythroid differentiation, such as GATA1 and KLF1,46,47 whereas the other predicted TFs are also crucial in erythropoiesis, and the underlying mechanism is unclear.
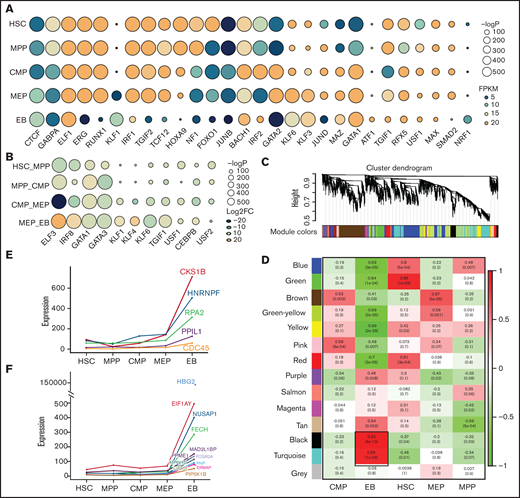
Transcriptional factors and hub gene identification through chromatin accessibility enrichment analysis and weighted gene coexpression network analysis. TF motif enrichment of ATAC-seq peaks during erythroid differentiation. (A) TFs specifically enriched at each stage during erythroid differentiation. (B) TFs enriched at differential peaks. (Some of the TFs are shown in the figure according to their enrichment score). The size of the circle represents the −log P value, which indicates the significance of TF motif enrichment. The color of circle represents the expression (A, FPKM) and differential fold change (B, log2FC) of TFs. (C) Gene cluster dendrogram obtained through linkage hierarchical clustering. The colorful lines below the tree show the modules that were calculated by Dynamic Tree Cutting. (D) The relationships between module and cell type. Each row represents a module eigengene, and each column corresponds to a trait. Each box contains the corresponding correlations and P value. The colors in the figure are based on the correlations. Expression of hub genes in EB, each shown by its significant module: the turquoise module (E) and the black module (F).
Transcriptional factors and hub gene identification through chromatin accessibility enrichment analysis and weighted gene coexpression network analysis. TF motif enrichment of ATAC-seq peaks during erythroid differentiation. (A) TFs specifically enriched at each stage during erythroid differentiation. (B) TFs enriched at differential peaks. (Some of the TFs are shown in the figure according to their enrichment score). The size of the circle represents the −log P value, which indicates the significance of TF motif enrichment. The color of circle represents the expression (A, FPKM) and differential fold change (B, log2FC) of TFs. (C) Gene cluster dendrogram obtained through linkage hierarchical clustering. The colorful lines below the tree show the modules that were calculated by Dynamic Tree Cutting. (D) The relationships between module and cell type. Each row represents a module eigengene, and each column corresponds to a trait. Each box contains the corresponding correlations and P value. The colors in the figure are based on the correlations. Expression of hub genes in EB, each shown by its significant module: the turquoise module (E) and the black module (F).
Hub genes refer to highly interconnected nodes in a module that plays significant roles in the regulatory network.27,48 To further characterize stage-specific hub genes, we clustered genes with similar expression patterns into a module and identified 14 modules (Figure 3C). Each cell stage contains significant coexpression modules (Figure 3D). We selected the modules that were highly related to each stage and identified the hub genes specific to each module. A total of 5 and 12 hub genes were identified in 2 EB modules, the turquoise module and black module, respectively (Figure 3E-F), and 10, 14, 7, and 5 hub genes were identified in the HSC, MPP, CMP, and MEP modules, respectively (supplemental Figure 3A-E). HBG2 and FECH were characterized for globin production at EB stage.49,50 However, more identified hub genes remain to be explored, especially in the turquoise module and black module of EB stage. Taken together, by integrating chromatin accessibility and transcriptome data, we identified stage-specific TFs and hub genes that could be incorporated into interactive networks regulating erythroid differentiation.
Chromatin-associated lncRNAs are involved in regulatory networks during erythroid differentiation
Hundreds of lncRNAs that promote erythroid differentiation and maturation are expressed specifically at each stage.42,51 Our clustering results showed that lncRNAs have better cell specificity than mRNA (Figure 4A-B). We extracted stage-specific lncRNAs during erythroid differentiation and displayed the top 10 lncRNAs with specific expression at each stage on a heatmap (Figure 4C). The differential lncRNA analysis showed a larger proportion of downregulated lncRNAs from HSC to CMP (Figure 4D), whereas the proportion of upregulated lncRNAs increased suddenly at the EB stage (Figure 4D), which indicates that lncRNA may play an important role at the late stage of erythroid differentiation.
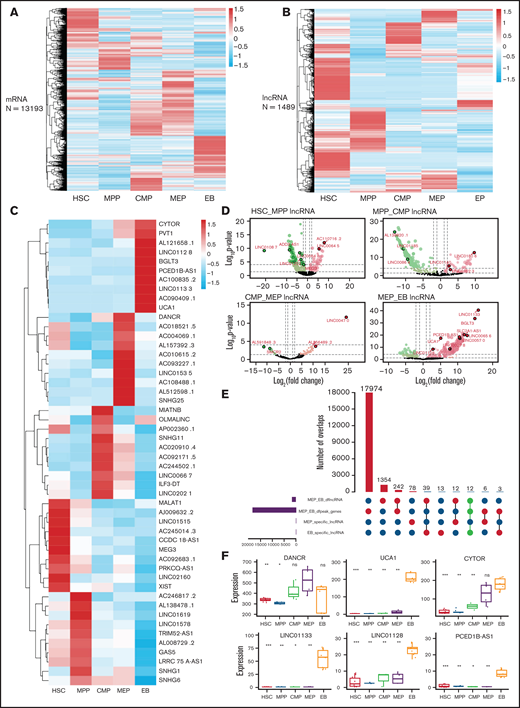
Identification of potential regulatory lncRNAs by integrating transcriptome and chromatin accessibility during erythroid differentiation. Clustering results of mRNAs (A) and lncRNAs (B). (C) Top 10 stage-specific lncRNAs expressed during erythroid differentiation. (D) LncRNAs differentially expressed between adjacent stages during erythroid differentiation. (E) The number of intersecting differentially expressed lncRNAs and the accessible chromatin between the MEP cell and EB stage. Bar plot on the left shows the number of differentially expressed lncRNAs and genes between MEP cell and EB and the number of specific lncRNAs in MEP and EB. The dot plot (bottom right) connected by solid lines represents different intersecting points. The bar plot (top right) represents the number of intersections. (F) The expression of lncRNAs with potential regulatory functions at the MEP cell and EB stages. DANCR is highly expressed at MEP cell stage. UCA1, CYTOR, LINC01133, LINC01128, and PCED1B-AS1 are highly expressed at EB stage.
Identification of potential regulatory lncRNAs by integrating transcriptome and chromatin accessibility during erythroid differentiation. Clustering results of mRNAs (A) and lncRNAs (B). (C) Top 10 stage-specific lncRNAs expressed during erythroid differentiation. (D) LncRNAs differentially expressed between adjacent stages during erythroid differentiation. (E) The number of intersecting differentially expressed lncRNAs and the accessible chromatin between the MEP cell and EB stage. Bar plot on the left shows the number of differentially expressed lncRNAs and genes between MEP cell and EB and the number of specific lncRNAs in MEP and EB. The dot plot (bottom right) connected by solid lines represents different intersecting points. The bar plot (top right) represents the number of intersections. (F) The expression of lncRNAs with potential regulatory functions at the MEP cell and EB stages. DANCR is highly expressed at MEP cell stage. UCA1, CYTOR, LINC01133, LINC01128, and PCED1B-AS1 are highly expressed at EB stage.
We next screened lncRNAs that are differentially expressed, located in the differential accessible chromatin region, stage specific, and highly expressed (Figure 4E; supplemental Figure 4 A-C). We identified 4, 3, 2, 1, and 5 lncRNAs at the HSC (supplemental Figure 5 A-E), MPP (supplemental Figure 5 F-G), CMP (supplemental Figure 5 H-I), MEP (Figure 4F), and EB stages, respectively (Figure 4F), that could be associated with erythropoiesis by coordinating accessible chromatin, of which DANCR is specifically highly expressed at the MEP stage and was further functionally verified in this study.
DANCR promotes erythroid differentiation by compromising megakaryocyte differentiation
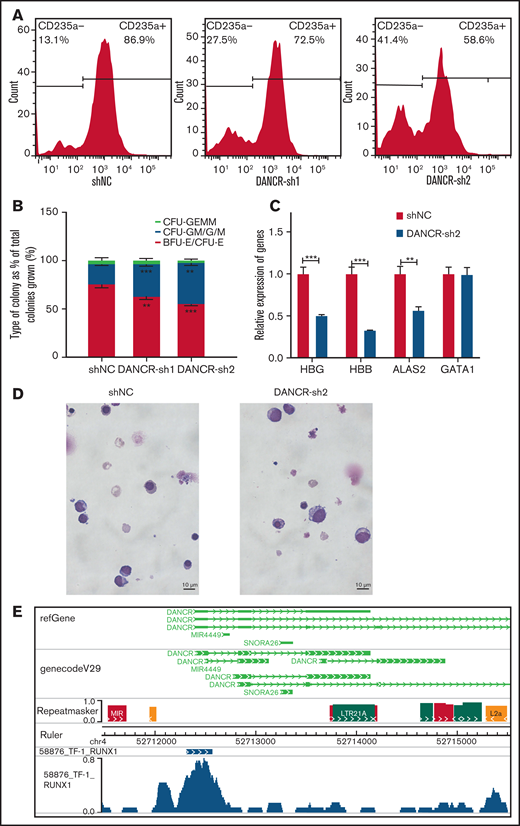
We found that chromatin accessibility and the transcriptome changed dramatically at the MEP stage, which can give rise to megakaryocytes and erythroid cells. DANCR was specifically expressed higher at the MEP stage (Figure 4F). DANCR is a tumor promoter, but little is known about its function in erythroid differentiation.52 In this study, we observed that the knockdown of DANCR leads to the reduction in the proportion of CD235a+ erythroid cells (Figure 5A), the production of erythroid progenitors (Figure 5B), and the expression of erythroid-specific genes, including HBG and HBB (Figure 5C). We also observed the developmental defect of erythroid lineage during erythroid differentiation caused by inhibition of DANCR (Figure 5D). We confirmed the phenotypes caused by the overexpression of DANCR (supplemental Figure 6A-D). In particular, the overexpression of DANCR promotes the expression of globin proteins in differentiated erythroid cells (supplemental Figure 6D). By performing transcriptome sequencing of K562 cells with the overexpression of DANCR, we observed that chromatin-associated functions were disturbed (supplemental Figure 6E), demonstrating that DANCR participates in hematopoiesis by coordinating with chromatin. Interestingly, the colony-forming unit assay revealed that overexpression of DANCR promotes the production of erythroid progenitors while inhibiting megakaryotic progenitor cells (P < .05) (supplemental Figure 6C). Meanwhile, highly enriched negative regulation of megakaryocyte differentiation was also observed in the transcriptome data of K562 cells (supplemental Figure 6E). These observations could indicate that overexpression of DANCR promotes erythroid differentiation by compromising megakaryocyte differentiation. Moreover, we observed strong H3K4me3 and H3K27ac signals around DANCR (supplemental Figure 6F), which indicates that this region has enhancer signal.53

Aberrant expression of DANCR leads to the defects during erythroid differentiation. (A) The detection of CD235a+ cells in differentiated CD34+ cells on day 11 by flow cytometry in green fluorescent protein-positive cells with DANCR-KD. The percentage on the right in each figure represents the proportion of CD235a+ cells. (B) Colony-forming capacity analysis of DANCR knockdown in CD34+ cells. (C) Knockdown of DANCR in CD34+ cells inhibits the accumulation of β-hemoglobin (HBB) and γ-hemoglobin (HBG) proteins and erythroid-specific gene ALAS2 on Day 12. (D) Morphology in differentiated CD34+ cells with DANCR knockdown and control on Day 11 (original magnification ×100; Wright-Giemsa stain) shows vector control (left) and DANCR-KD (right). The size of more differentiated CD34+ cells with DANCR knockdown was larger than that of the control, and the degree of chromatin condensation is reduced. (E) Profile of transcription factor RUNX1 around DANCR in TF-1 cells. Statistical results were analyzed by Student t-test and Kruskal-Wallis test. *P < .05; **P < .01; ***P < .001. Ctrl, control group; KD, knockdown; OE, overexpression.
Aberrant expression of DANCR leads to the defects during erythroid differentiation. (A) The detection of CD235a+ cells in differentiated CD34+ cells on day 11 by flow cytometry in green fluorescent protein-positive cells with DANCR-KD. The percentage on the right in each figure represents the proportion of CD235a+ cells. (B) Colony-forming capacity analysis of DANCR knockdown in CD34+ cells. (C) Knockdown of DANCR in CD34+ cells inhibits the accumulation of β-hemoglobin (HBB) and γ-hemoglobin (HBG) proteins and erythroid-specific gene ALAS2 on Day 12. (D) Morphology in differentiated CD34+ cells with DANCR knockdown and control on Day 11 (original magnification ×100; Wright-Giemsa stain) shows vector control (left) and DANCR-KD (right). The size of more differentiated CD34+ cells with DANCR knockdown was larger than that of the control, and the degree of chromatin condensation is reduced. (E) Profile of transcription factor RUNX1 around DANCR in TF-1 cells. Statistical results were analyzed by Student t-test and Kruskal-Wallis test. *P < .05; **P < .01; ***P < .001. Ctrl, control group; KD, knockdown; OE, overexpression.
To further explore the regulatory mechanism of DANCR in hematopoiesis, we screened ChIP-seq data54 and comprehensively identified TFs that appear in the DANCR genomic region associated with chromatin accessibility in TF-1 cells (supplemental Table 3). Interestingly, we observed that RUNX1 (Figure 5E), a player in regulating the balance between erythroid and megakaryocytic differentiation through modulating the balance between KLF1 and FLI1,55 physically binds to accessible chromatin upstream of DANCR in TF-1 cells through WashU Browser. These results suggest that DANCR may coordinate accessible chromatin to regulate MEP cell differentiation. However, we did not observe the binding of RUNX1 in the corresponding position in the ChIP-seq data of K562 cells in UCSC, which may be the result of TF variability at the chromatin accessibility for specific genes existing in different cell stages and cellular environment between TF-1 and K562 cells.
Regulatory networks of lncRNAs, TFs, and genes involved in terminal erythroid differentiation
EBs are an important stage of erythroid differentiation involving the expulsion of nucleus, which forms reticulocytes that mature into biconcave red blood cells.56 The current results indicate that a regulatory network of lncRNAs, TFs, and genes may regulate terminal erythroid differentiation. We therefore integrated ChIP-seq, DNase I-seq, and ATAC-seq data in Toolkit from Cistrome Data Browser to predict the potential regulatory networks at EB stage (Figure 6A).

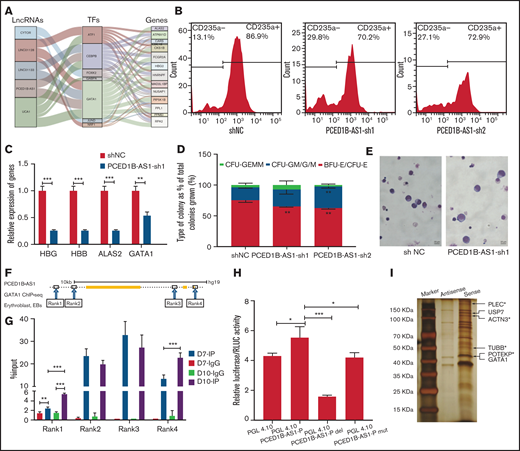
The regulatory networks of lncRNAs, TFs, and genes during terminal erythroid differentiation. (A) The lncRNAs-TF-gene regulatory network in EB: specific lncRNA identified in EB (left column); TFs expressed in EB (middle column); and hub genes in EB (right column). The line between the columns represents the possible regulatory relationship among factors. (B) Detection of CD235a+ cells in differentiated CD34+ cells on day 11 by flow cytometry in green fluorescent protein-positive cells with PCED1B-AS1-KD. The percentage on right in each figure represents the proportion of CD235a+ cells. (C) Relative expression of erythroid-specific genes in differentiated CD34+ cells with PCED1B-AS1-KD on day 12 detected by qPCR assay. (D) Colony-forming capacity analysis of PCED1B-AS1 knockdown in CD34+ cells. (E) Morphology of differentiated CD34+ cells on day 11 (original magnification ×100; Wright-Giemsa stain): vector control (left) and PCED1B-AS1-KD (right). (F) GATA1 binding sites around PCED1B-AS1 locus in EB stage from ENCODE database (ENCFF957CWW). The binding sites are named Rank 1 to 4 from left to right. Rank3 locates in PCED1B-AS1 locus, and the other 3 binding sites locate outside the PCED1B-AS1 locus. (G) GATA1 ChIP-qPCR analyses of IgG and IP on Day 7 and Day 10. The GATA1 binding signal was detected at the 4 regions (Rank1, Rank2, Rank3, and Rank4). (H) Detection of activity of PCED1B-AS1 promoter without any changes or with deletion, mutation on GATA1 binding motif by dual luciferase reporter assay. PGL4.10-PCED1B-AS1-P represents the promoter of PCED1B-AS1 included in the construct of PGL4.10; PGL4.10-PCED1B-AS1-P-del represents the deletion of GATA1 binding motif in the promoter; PGL4.10-PCED1B-AS1-P-mut represents the mutation of GATA1 binding motif in the promoter. (I) Silver staining of the co-precipitated proteins with lncRNA PCED1B-AS1 in the in vitro RNA pull-down assay. Cytoskeleton protein or associated proteins indicated by asterisk (*). Statistical results were analyzed by Student t-test and Kruskal-Wallis test; *P < .05; **P < .01; ***P < .001. Ctrl, control group; KD, knockdown; OE, overexpression.
The regulatory networks of lncRNAs, TFs, and genes during terminal erythroid differentiation. (A) The lncRNAs-TF-gene regulatory network in EB: specific lncRNA identified in EB (left column); TFs expressed in EB (middle column); and hub genes in EB (right column). The line between the columns represents the possible regulatory relationship among factors. (B) Detection of CD235a+ cells in differentiated CD34+ cells on day 11 by flow cytometry in green fluorescent protein-positive cells with PCED1B-AS1-KD. The percentage on right in each figure represents the proportion of CD235a+ cells. (C) Relative expression of erythroid-specific genes in differentiated CD34+ cells with PCED1B-AS1-KD on day 12 detected by qPCR assay. (D) Colony-forming capacity analysis of PCED1B-AS1 knockdown in CD34+ cells. (E) Morphology of differentiated CD34+ cells on day 11 (original magnification ×100; Wright-Giemsa stain): vector control (left) and PCED1B-AS1-KD (right). (F) GATA1 binding sites around PCED1B-AS1 locus in EB stage from ENCODE database (ENCFF957CWW). The binding sites are named Rank 1 to 4 from left to right. Rank3 locates in PCED1B-AS1 locus, and the other 3 binding sites locate outside the PCED1B-AS1 locus. (G) GATA1 ChIP-qPCR analyses of IgG and IP on Day 7 and Day 10. The GATA1 binding signal was detected at the 4 regions (Rank1, Rank2, Rank3, and Rank4). (H) Detection of activity of PCED1B-AS1 promoter without any changes or with deletion, mutation on GATA1 binding motif by dual luciferase reporter assay. PGL4.10-PCED1B-AS1-P represents the promoter of PCED1B-AS1 included in the construct of PGL4.10; PGL4.10-PCED1B-AS1-P-del represents the deletion of GATA1 binding motif in the promoter; PGL4.10-PCED1B-AS1-P-mut represents the mutation of GATA1 binding motif in the promoter. (I) Silver staining of the co-precipitated proteins with lncRNA PCED1B-AS1 in the in vitro RNA pull-down assay. Cytoskeleton protein or associated proteins indicated by asterisk (*). Statistical results were analyzed by Student t-test and Kruskal-Wallis test; *P < .05; **P < .01; ***P < .001. Ctrl, control group; KD, knockdown; OE, overexpression.
PCED1B-AS1 is a novel lncRNA that is specifically expressed at EB stage. Our results showed that knockdown of PCED1B-AS1 leads to the decrease in the proportion of CD235a+ cells (Figure 6B) and the expression of erythroid-specific genes compared with control (Figure 6C). Colony formation assay indicated that knockdown of PCED1B-AS1 results in decreased burst-forming unit-erythroid and colony-forming unit-erythroid colonies (Figure 6D). Morphology analysis showed the developmental delay of erythroid lineage in terminal erythroid differentiation (Figure 6E). The key phenotypes were confirmed with the overexpression of PCED1B-AS1 (supplemental Figure 7). In particular, the overexpression of PCED1B-AS1 promotes the expression of globin proteins in differentiated erythroid cells (supplemental Figure 7D). These results demonstrated that PCED1B-AS1 participates in terminal erythroid differentiation.
Based on the regulatory network constructed, we hypothesize that PCED1B-AS1 regulates terminal erythroid differentiation cooperating with GATA1. We previously revealed the binding of GATA1 in the genomic regions of PCED1B-AS1 in K562 cells.57 In this study, using public ChIP-seq dataset, we screened 4 binding sites of GATA1 in genomic regions of PCED1B-AS1 in EBs and verified the physical binding of GTAT1 in 2 regions (Rank1, Rank4) that gradually increase during erythroid differentiation of CD34+ cells (Figure 6F-G). The abolishment of the GATA1 binding motif leads to the significantly decreased promoter activity of PCED1B-AS1 (Figure 6H). These results demonstrated that PCED1B-AS1 regulates terminal erythroid differentiation coordinating dynamic accessible chromatin or GATA1 binding.
To further explore the underlying mechanism by which PCED1B-AS1 regulates terminal erythroid differentiation, we conducted the in vitro RNA pull-down assay of PCED1B-AS1 in cultured EBs. Downregulating GATA1 protein levels is necessary in terminal erythroid differentiation.58 Interestingly, our pull-down assay demonstrated that GATA1 and its interacting protein USP7 were co-precipitated with PCED1B-AS1 in EBs (supplemental Table 4). USP7 catalyzes the removal of poly-ubiquitylation chains on GATA1 and stabilizes GATA1, by which it ensures the expression level of GATA1 in the late stage of erythroid differentiation and the participation of GATA1 in the regulation in terminal erythroid differentiation59 (Figure 6H). This is 1 possible mechanism in which PCED1B-AS1 participates in terminal erythroid differentiation. Moreover, we observed that a few cytoskeleton and associated proteins, including TUBB, PLEC, ACTN3, and POTEKP, were highly co-precipitated with PCED1B-AS13,60 (Figure 6H; supplemental Table 5). Because membrane skeleton undergoes dynamic remodeling during terminal erythroid differentiation and chromatin condensation,3,60 we speculate that PCED1B-AS1 also could regulate terminal erythroid differentiation by interacting with cytoskeleton network. In all, our study expands the mechanism by which PCED1B-AS1 participates in terminal erythroid differentiation.
A previous study reported that UCA1, whose promoter is occupied by GATA1, functions as a scaffold lncRNA to maintain the stability of ALAS2 mRNA for heme synthesis,61 which is one crucial process for globin biosynthesis during erythroid differentiation. Our results expanded the underlying mechanism of UCA1 to regulate erythroid differentiation by coordinating with more specific TFs, including ATF1, CEBPB, and GABPA, and more potential target genes (Figure 6A). Moreover, the regulatory networks of the other lncRNAs, including CYTOR, LINC01128, and LINC01133, with their TFs and genes were identified for the first time, which need to be further verified for their roles in terminal erythroid differentiation. Taken together, lncRNAs located in the open chromatin region coordinating with TFs participate in erythroid differentiation.
Discussion
In this study, our findings provide a comprehensive landscape of chromatin accessibility, lncRNAs, and hub genes as well as trans-factors at each stage during erythroid differentiation and identify the interactive network of lncRNAs and chromatin accessibility in erythropoiesis, which provides novel insights into erythroid differentiation and abundant resources for further study. We modeled the interactive network of lncRNAs, TFs, and genes in terminal erythroid differentiation and illustrated that several novel lncRNAs are probably involved in terminal erythroid differentiation cooperating with TFs, which provide new regulatory insights for erythropoiesis.
HSCs and MPP cells are progenitor cells of erythroid differentiation with differentiation ability.62 Chromatin accessibility tends to decrease from HSCs differentiated into MPP cells as the expressed genes decrease. Some studies have reported that lncRNAs regulate differentiation and proliferation of HSCs, such as H19 and MEG3.19,63 Interestingly, our results also indicate that downregulated genes in HSCs are associated with noncoding RNA processing. We identified that lncRNA CCDC18-AS1 was highly expressed in HSCs. Studies showed that CCDC18-AS1 involved in the cell cycle is similar to MALAT1, NEAT1, and H19.64 Few studies have been conducted on LINC01252 and LINC00648, which are the other 2 lncRNAs that are highly expressed specific to HSCs. The proportion of enhanced accessible chromatin and upregulated genes is larger during MPP cells differentiated into CMP cells (Figure 1A-B,D), which suggests that transcriptional regulatory activity remains active during MPP cells differentiated into CMP cells and transcriptional regulators can bind to regulate this process.65,66
The MEP cell stage involves a continuous transition from CMP cells, in which the cells are bipotent and can further generate 2 completely different functional cells: erythrocytes and platelets. Our results show that chromatin accessibility changes significantly, with greatly decreased accessible chromatin, which indicates that MEP cells prepare to or already possess some characteristics of mature erythroid cells. The functional annotation of changed chromatin accessibility and transcriptome illustrates their association with the functions of myeloid and erythroid differentiation. The differentiation fate of MEPs depends not only on TFs but also on their target genes. Our findings expand the regulation mechanism of MEP differentiation and verify that DANCR, which is significantly decreased in KLF1-null neonatal anemia,67 could promote erythroid differentiation by compromising megakaryocyte differentiation by coordinating TFs. However, the specific target genes that are involved in this process require further verification.
In addition, we identified many novel hub genes and TFs at each stage (Figure 3) that may play important roles during erythroid differentiation, which could facilitate understanding of the molecular networks underlying erythropoiesis. Importantly, we discovered a cluster of known or novel lncRNAs that play significant roles and interact with TFs and genes during erythroid differentiation. It has been reported that H19 and MEG3 regulate the differentiation and proliferation of HSCs.19,63,68 We also identified that MEG3 is specifically expressed at the HSC stage.
EB is the transition stage between MEP cells and enucleated cells. Chromatin accessibility, lncRNA, and gene expression undergo tremendous changes during the differentiation of MEP cell into EB. Based on the previous study,57 we further demonstrated that PCED1B-AS1, which is significantly decreased in KLF1-null neonatal anemia67 and human erythroid cell line with sickle cell disease mutation,69 regulates erythroid differentiation associated with GATA1, chromatin remodeling, and cytoskeleton network in terminal erythroid differentiation. UCA1 may be involved in erythroid differentiation by recruiting TFs to target genes and chromatin state changes.61 Our results identified the interactive network of lncRNAs and chromatin accessibility in erythropoiesis, and the functions of CYTOR, LINC01128, and LINC01133 remained to be further elucidated in terminal erythroid differentiation.
It was reported that shRNA knockdown led to off-target inhibition of erythropoiesis.70 To enhance the specificity of shRNA knockdown DANCR or PCED1B-AS1, we designed 2 independent shRNAs targeting different regions in DANCR or PCED1B-AS1 and observed consistent phenotypes by different assays. We also confirmed the phenotypes by overexpressing DANCR or PCED1B-AS1. In addition, it can be further verified by choosing different vectors, better titration, different shRNA controls, and gene editing in the future.
Overall, our study characterized the interactive associated network of lncRNAs and chromatin accessibility during erythroid differentiation by multi-omics integrated analysis. We provide new perspectives and rich resources for exploring the regulatory mechanism underlying erythroid differentiation as well as offer potential markers for preventing or treating various erythropoiesis-related diseases.
Acknowledgments
This study makes use of data generated by the Blueprint Consortium. A full list of the investigators who contributed to the generation of the data is available at www.blueprint-epigenome.eu. Funding for the project was provided by the European Union’s Seventh Framework Program (FP7/2007-2013) under grant agreement no 282510–BLUEPRINT.
This research was supported by grants from the Strategic Priority Research Program of the Chinese Academy of Sciences (XDA16010602), National Natural Science Foundation of China (82070114, 81870097, 81670109, 81700097, and 81700116), and National Key R&D Program of China (2017YFC0907400).
Authorship
Contribution: X.F. and Z.Z. conceived and supervised the study; Y.R. designed the study and analyzed the data; Z.Z. and H.Q. designed the experiments; J.Z., Y.H., P.L., and J.W. performed the experiments; Y.R. drafted the manuscript; X.F. and Z.Z. revised the manuscript; and all authors read and approved the final manuscript.
Conflict-of-interest disclosure: The authors declare no competing financial interests.
Correspondence: Xiangdong Fang, Beijing Institute of Genomics, Chinese Academy of Sciences/China National Center for Bioinformation, Beijing 100101, China; e-mail: fangxd@big.ac.cn; and Zhaojun Zhang, Beijing Institute of Genomics, Chinese Academy of Sciences/China National Center for Bioinformation, Beijing 100101, China; e-mail: zhangzhaojun@big.ac.cn.