Key Points
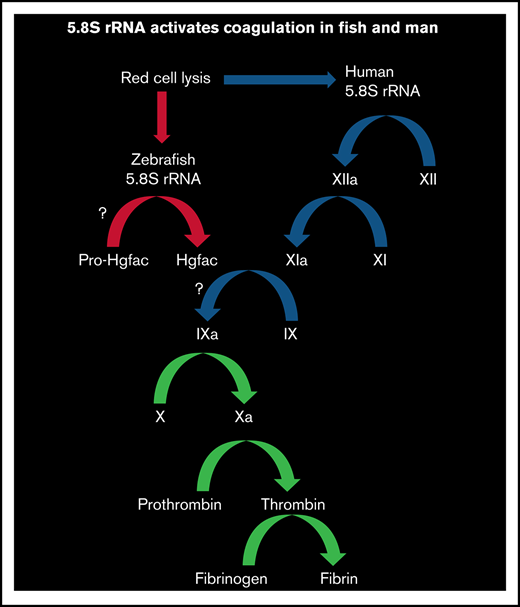
Hemolysis releases 5.8S rRNA and activates blood coagulation in human and zebrafish via FXII and Hgfac, respectively.
Only the 3'-end 26 nucleotides of 5.8S rRNA were necessary and sufficient for this activation.

Abstract
Hemolytic disorders are characterized by hemolysis and are prone to thrombosis. It has previously been shown that the RNA released from damaged blood cells activates clotting. However, the nature of the RNA released from hemolysis is still elusive. We found that after hemolysis, red blood cells from both zebrafish and humans released RNA that contained mostly 5.8S ribosomal RNA (5.8S rRNA), This RNA activated coagulation in zebrafish and human plasmas. By using both natural and synthetic 5.8S rRNA and its truncated fragments, we found that the 3'-end 26-nucleotide-long RNA (3'-26 RNA) and its stem-loop secondary structure were necessary and sufficient for clotting activity. Corn trypsin inhibitor (CTI), a coagulation factor XII (FXII) inhibitor, blocked 3'-26 RNA–mediated coagulation activation in the plasma of both zebrafish and humans. CTI also inhibited zebrafish coagulation in vivo. 5.8S rRNA monoclonal antibody inhibited both 5.8S rRNA– and 3'-26 RNA–mediated zebrafish coagulation activity. Both 5.8S rRNA and 3'-26 RNA activated normal human plasma but did not activate FXII-deficient human plasma. Taken together, these results suggested that the activation of zebrafish plasma is via an FXII-like protein. Because zebrafish have no FXII and because hepatocyte growth factor activator (Hgfac) has sequence similarities to FXII, we knocked down the hgfac in adult zebrafish. We found that plasma from this knockdown fish does not respond to 3'-26 RNA. To summarize, we identified that an rRNA released in hemolysis activates clotting in human and zebrafish plasma. Furthermore, we showed that fish Hgfac plays a role in rRNA-mediated activation of coagulation.
Introduction
Blood diseases such as paroxysmal nocturnal hemoglobinuria, β-thalassemia, and hemolytic anemia are characterized by intravascular hemolysis (IH) and are frequently associated with thrombosis.1-4 The mechanism of how IH activates blood coagulation and induces thrombosis is not yet well understood, although several mechanisms have been suggested. The IH releases hemoglobin which in turn, decreases NO, leading to vasoconstriction and eventually promoting platelet aggregation and blood coagulation.4,5 Furthermore, IH releases negatively charged compounds such as adenosine triphosphate (ATP) and polyphosphate and enhances phosphatidylserine-loaded microparticles in the plasma.6,7 All these components could activate platelets and blood coagulation factors.
It is well known that negatively charged surfaces, including glass, nucleic acids, and polyphosphates, initiate the intrinsic pathway of blood coagulation by activating coagulation factor XII (FXII) in humans.8,9 FXII deficiency does not affect bleeding, but it does protect mice from arterial thrombosis.10 Nucleic acids, especially RNAs released from damaged blood cells, become accessible to the plasma where they activate blood coagulation and promote thrombus formation in vivo.11 In contrast, the cellular DNAs may not activate coagulation because they are entrapped in complexes with the histones.12,13 Although different types of RNAs have been reported to activate blood coagulation, it is still unclear which RNA is critical for coagulation activation in vivo. Interestingly, negatively charged RNA surfaces have also been shown to activate blood coagulation via the tissue factor and FVII-mediated extrinsic pathway by binding to the FVII-activating protease.14
We hypothesized that IH would release a nucleic acid that activates the intrinsic pathway of blood coagulation. In this study, we found that zebrafish and human red blood cell (RBC) lysates selectively released 5.8S ribosomal RNA (5.8S rRNA), which activated coagulation. We found that only the 3'-end 26-nucleotide-long RNA (3'-26 RNA) and its stem-loop secondary structure were necessary and sufficient for activating coagulation. Studies of inhibitors and the use of FXII-deficient human plasma revealed that in humans, this RNA activated coagulation via FXII. Similarly, we found that in zebrafish, activation of coagulation is probably mediated by an FXII-like factor.15 Knockdown of hepatocyte growth factor activator (Hgfac), an evolutionary precursor of FXII, revealed that this protein responds to 3'-26 RNA.16,17 In this study, we determined that 5.8S rRNA released during hemolysis activates clotting in human and zebrafish plasma. Only 26 nucleotides of 5.8S rRNA are needed for activation of coagulation, and Hgfac plays a role in this activation in zebrafish.
Materials and methods
Zebrafish husbandry and breeding
Wild-type adult zebrafish were purchased from a local supplier (Fish and Chirps Pet Center, Denton, TX), and the zebrafish were maintained at 28°C in a circulating system of deionized water supplemented with Instant Ocean sea salt.18 Zebrafish were maintained in 10-hour dark and 14-hour light cycles and fed with live brine shrimp and flakes 3 times per day. For breeding, individual male and female wild-type zebrafish were separated in a breeding tank overnight. The next morning, when the lights were turned on, the separator was removed. After the zebrafish laid eggs, the eggs were collected and maintained in E3 medium containing 5 mM NaCl, 0.17 mM KCl, 0.33 mM MgSO4, 0.33 mM CaCl2·2H2O, and 0.1% methylene blue, and the hatched larvae were used in subsequent experiments.
Zebrafish blood collection
Adult wild-type zebrafish were placed on their lateral side on a clean paper towel, and the skin surface was gently wiped off using a laboratory tissue. By using sharp straight Noyes Scissors 4.7 (World Precision Instruments, Sarasota, FL), a small lateral incision was made at the midpoint between the dorsal and ventral fins. A micropipette tip was used to rapidly collect 2 µL of blood, which was placed in a 1.5-mL centrifuge tube containing 0.5 µL of 3.8% sodium citrate. The tube was gently finger tapped and was kept on ice until further processing.19 The above procedure was approved by the Institutional Animal Care and Use Committee of the University of North Texas, and the animal experiments were performed in compliance with institutional guidelines.
In vitro hemolysis, 5.8S rRNA isolation, and sequencing analysis
The collected blood was centrifuged at 500g at 4°C for 3 minutes. The supernatant plasma was discarded, and the pelleted RBCs were washed 3 times with 1× phosphate-buffered saline (PBS). To lyse this RBC pellet, we added 2.5 blood volumes of diethyl pyrocarbonate (DEPC) water and finger tapped the tube. After 15 seconds, the sample was centrifuged at 500g at 4°C for 3 minutes, and the supernatant was electrophoresed on 5% native polyacrylamide gels and stained with EtBr (EtBr). The stained gel band was then excised, cut into small pieces, and incubated with 0.5 mL elution buffer (0.5 M ammonium acetate, 10 mM magnesium acetate tetrahydrate, 1 mM EDTA [pH 8.0]) overnight with shaking at 4°C. This sample was centrifuged at 5000g and the supernatant was precipitated by ethanol. The RNA pellet was dissolved in nuclease-free water, and the concentration was determined by using an Epoch2 Take3 microplate reader (BioTek, Winooski, VT). Then, 2 µg of RNA was sent to Omega Bioservices (Norcross, GA) for quality check and RNA sequencing (RNA-seq). The RNA was checked by denaturing polyacrylamide gel.
After centrifugation of whole blood at 500g as described above, the supernatant white blood cell (WBC)-rich plasma was pipetted out and centrifuged at 2000g, and the WBC pellet (containing all WBCs including thrombocytes) was washed 3 times with 1× PBS. We added 2.5 blood volumes of DEPC water and finger-tapped the tube. After 15 seconds, the sample was centrifuged at 2000g at 4°C for 3 minutes, and the supernatant was electrophoresed on 5% native polyacrylamide gels and stained with EtBr.
The RBC lysate was brought up to 0.2 N NaOH and heated at 65°C for 5 minutes. The sample was neutralized with acetic acid, run on 5% native polyacrylamide gels, and stained with EtBr. Similarly, the lysate was treated with 1 unit of DNase-free RNase for 15 minutes, run on 5% native polyacrylamide gels, and stained with EtBr.
RNA-seq analysis
Quality control and adapter trimming of reads from RNA-Seq FASTQ files were simultaneously performed using the Trim Galore wrapper script for the Cutadapt and FastQC tools with the small_rna flag.20 Small RNA alignment was performed with bowtie2 v. 2.3.2 using the very-sensitive local parameter and quantified using Cufflinks v2.2.1 and the GRCz10 GTF file procured from the Ensembl Genomes FTP server.21-23 Choice of alignment software and parameterization was based on previously published performance metrics regarding microRNA (miRNA) alignment.24 The sequencing generated 19 789 053 reads of sizes ranging from 58 to 101 nucleotides. After trimming and filtering, there were 15 656 070 reads of 16 to 95 nucleotides. Of these, 83.7% mapped to the GRCz10 Ensembl genome of zebrafish using bowtie2. The average depth of coverage was determined to be 38.94 by using Samtools.
Kinetic assays
The kinetic coagulation assay was performed in a 96-well microtiter plate, which was kept on ice. The reaction mixture consisted of 20 µL of human fibrinogen (10 mg/mL) purchased from EMD Millipore (Billerica, MA), 1 µL zebrafish plasma or 10 µL pooled normal human plasma (Sigma Aldrich, St. Louis, MO), or FXII-deficient human plasma (Haematologic Technologies, Essex Junction, VT), and the RNA (0.2 nM). This reaction mixture was recalcified with 6 µL of 100 mM CaCl2, and the reaction volume was brought to 100 µL with 1× PBS. The contents were mixed well, and the bottom of the microtiter plate was wiped off with a laboratory tissue. The absorbance reading was recorded once every minute at 405 nm at 25°C using Epoch2 Take3 microplate reader (BioTek).25 Positive control reactions were performed with plasma activated with Dade Actin (Trinity Biotech, Jamestown, NY) or zebrafish thromboplastin prepared as previously described.25 Negative control reactions were performed without any activating agent.
The kinetic FXII assay with purified FXII (Haematologic Technologies) and the chromogenic substrate, N-benzoyl-Pro-Phe-Arg-p-nitroanilide hydrochloride (Sigma-Aldrich) was performed in a 96-well microtiter plate. The reaction consisted of 5 µL of FXII (3 mg/mL), 2 µL of the substrate (25 mg/mL), and Dade Actin or the 3'-26 RNA (0.2 nmol). The reaction volume was brought to 50 µL with 1× PBS. The contents were mixed well, and absorbance reading was recorded once every minute at 405 nm at 37°C, as described above.
In vitro synthesis of full-length 5.8S rRNA and its smaller fragments
To prepare full-length synthetic 5.8S rRNA (5.8S rRNA-S) and its truncated 5'-119 RNA, we designed a forward primer carrying the T7 promoter sequence 5'-TAATACGACTCACTATAGAACTCTTAGCGGTGGATCAC-3' and a reverse primer 5'-CGACGCTCAGACAGGCGTGG-3' corresponding to 5.8S rRNA (Invitrogen, Grand Island, NY). Reverse transcriptase polymerase chain reaction (RT-PCR) was performed using the above primers in the presence of ProtoScript II reverse transcriptase (New England BioLabs, Ipswich, MA). The resulting full-length 5.8S DNA template was run on 5% polyacrylamide gel electrophoresis and stained with EtBr. The bands were excised and precipitated with ethanol. We digested the full-length 5.8S DNA by SmaI (New England BioLabs), and the 5'-119-bp fragment that contains the T7 promoter sequence was also purified by gel electrophoresis. We then performed the in vitro transcription reaction on the purified full-length 5.8S DNA and 5'-119-bp templates using Invitrogen Ambion Megashortscript T7 Transcription Kit (Thermo Fisher Scientific, Pittsburgh, PA) according to the manufacturer’s protocol.26 For the in vitro synthesis of 5'-119 RNA without SmaI digestion, we designed a forward primer carrying the T7 promoter sequence, 5'-TAATACGACTCACTATAGAACTCTTAGCGGTGGATCAC-3', and a reverse primer, 5'-GGGGCCGCAAAGTGCGTTCG-3'. The reaction mixture consisted of 2 µL of 0.75 mM of each nucleotide (ATP, cytidine triphosphate [CTP], guanosine-5′-triphosphate [GTP], and UTP), 2 µL 10× T7 reaction buffer, 0.5 µg of 1 of the above template 5.8S DNAs, and 2 µL of T7 enzyme mix, and the reaction mixture was brought to a total volume of 20 µL using nuclease-free water. The reaction solution was then mixed gently and incubated in a water bath at 37°C for 4 hours. Then, 2 µL of TURBO DNase was added to the reaction mixture and the tube was incubated again at 37°C for 30 minutes. The resulting in vitro transcribed RNA was precipitated with ethanol and purified as described in the manufacture’s protocol.
For the in vitro synthesis of shorter 5.8S rRNA fragments—3'-35 RNA, 3'-43 RNA, 3'-26 RNA, 3'-26 loop mutation (LM) RNA, 3'-26 stem mutation (SM) RNA, 3'-26 stem flipping (SF) RNA, and 3'-19 RNA—we designed the T7 promoter sequence containing forward primers and reverse primers for each of the above fragments. The primer sequences are forward primer 5'-TAATACGACTCACTATAGGGGTTCCTCCCGGGCCACGCCTGTCTGAGCGTCG-3' and reverse primer 5'-CGACGCTCAGAAGGCGTGGCCCCGGGAGGAACCCCTATAGTGAGTCGTATTA-3' for 3'-35 RNA; forward primer 5'-TAATACGACTCACTATAGGCGGCCCCGGGTTCCTCCCGGGGCCACGCCTGTCTGAGCGTCG-3' and reverse primer 5'-CGACGCTCAGACAGGCGTGGCCCCGGGAGGAACCCGGGGCCGCCTATAGTGAGTCGTATTA-3' for 3'-43 RNA; forward primer 5'-TAATACGACTCACTATAGGCGGCCCCGGGTTCCTCCCGGGGCCA-3' and reverse primer 5'-TGGCCCCGGGAGGAACCCGGGGCCGCCTATAGTGAGTCGTATTA-3' for 3'-26 RNA; forward primer 5'-TAATACGACTCACTATAGGCGGCCCCGGGAAGGACCCGGGGCCA-3' and reverse primer 5'-TGGCCCCGGGTCCTTCCCGGGGCCGCCTATAGTGAGTCGTATTA-3' for 3'-26 LM RNA; forward primer 5'-TAATACGACTCACTATAGGCAATTTTAAATTCCTTTTAAAATTA-3' and reverse primer 5'-TAATTTTAAAAGGAATTTAAAATTGCCTATAGTGAGTCGTATTA-3' for 3'-26 SM RNA; forward primer 5'-TAATACGACTCACTATAGGCCCGGGGCCCTTCCTGGGCCCCGGA-3' and reverse primer 5'-TCCGGGGCCCAGGAAGGGCCCCGGGCCTATAGTGAGTCGTATTA-3' for 3'-26 SF RNA; and forward primer 5'-TAATACGACTCACTATAGCACGCCTGTCTGAGCGTCG-3' and reverse primer 5'-CGACGCTCAGACAGGCGTGCTATAGTGAGTCGTATTA-3' for 3'19 RNA (Invitrogen). We then annealed these primers to generate double-stranded DNA templates and used them in the in vitro transcription reaction to generate 5.8S rRNA fragments, as described above. The annealing mixture consisted of 0.5 µL of 100 µM of each primer and 0.8 µL 10× T7 reaction buffer, and the reaction was brought to a total volume of 8 µL. The reaction solution was then mixed and incubated at 95°C for 5 minutes and then cooled down at 25°C for 50 minutes.
In vivo injection of zebrafish larvae and laser-induced thrombosis assay
5.8S rRNA monoclonal antibody (5.8S RmAb) was purchased from Thermo Fisher Scientific (Catalog # MA1-13017). Corn trypsin inhibitor (CTI) was obtained from Haematologic Technologies. Fifteen nL of 1 mg/mL of 5.8S RmAb or CTI was injected IV into 4-days-postfertilization (dpf) zebrafish larvae under the microscope using a fine needle attached to a nitrogen pressure system. One hour after the injection, the larvae were analyzed by using a laser-induced thrombosis assay.27 The laser-induced thrombosis assay was performed in a single-blinded fashion. In this assay, 0.5 mL of water containing 3 to 5 zebrafish larvae was placed in a 1.5-mL Eppendorf tube and the larvae were anesthetized using 10 µL of 10 mM tricaine (Sigma-Aldrich) solution. Once the larvae were anesthetized, 0.5 mL of 1.6% low-melting agarose was added to make a total volume of 1 mL. The anesthetized and immobilized zebrafish larvae were then placed on their lateral side in a rectangular chamber created by using a rubber gasket attached to a microscope slide with Vaseline. The artery or vein in the region of 5 to 6 somites, posterior to the anal pore, was hit using a nitrogen laser light system (Stanford Research Systems, Sunnyvale, CA) attached to a Nikon microscope. A uniform laser hit of the artery or vein induces vascular injury and the time to occlusion (TTO) of the vessel in seconds was recorded.
Knockdown of hgfac in adult zebrafish
For the knockdown of hgfac, we custom synthesized a deoxyoligonucleotide primer—5'-GAGTGTAGTCGGGGTAGAAACTGTATATAAATTGTAACTG-3' (Invitrogen). The underscored portion of this deoxyoligonucleotide is antisense to a region in the coding sequence of hgfac complementary DNA (cDNA) and the rest of the 3'-end of this primer hybridizes partially with a vivo-morpholino (VMO)—5'-CCTCTTACCTCAGTTACAATTTATA-3'—was purchased from Gene Tools (Philomath, OR). We combined 4.5 µL of 0.5 mM VMO, 4.5 µL of 0.5 mM deoxyoligonucleotide primer, 1 µL of 10× hybridization buffer (500 mM NaCl, 10 mM tris(hydroxymethyl)aminomethane [Tris] HCl [pH 8.0]), and 1 mM EDTA (pH 8.0), and the mixture was incubated at 95°C for 5 minutes and then slowly cooled to 25°C. Then, 5 µL of the above hybrid was injected IV into adult zebrafish by using a 27 × 1-1/4 gauge needle, and the control fish were injected with 1× PBS. At 48 hours after injection, plasma was prepared, and the coagulation assay was performed in the presence of 3'-26 RNA or 5 µL of Dade Actin, as described above. The liver and spleen from the fish injected with the above hybrid were used to prepare total RNA by the TRIzol method. Then, 1 µg of total RNA was converted to cDNA by using reverse primer 5'-GGGTTTTCTGATGACGCTGT-3'. Quantitative RT-PCR (qRT-PCR) was performed using forward primer 5'-CCTGTGAGTGTGAGGGTGTG-3' and reverse primer 5'-GGGTTTTCTGATGACGCTGT-3'. The result was analyzed to determine ΔCT values from which relative fold change was measured, and the graph was plotted. Then, 15 nL of the above hybrid was injected into 3-dpf zebrafish larvae, as above, and a laser-induced thrombosis assay was performed on 5-dpf larvae in a single-blinded fashion. TTO in seconds was recorded.
Caudal vessel bleeding assay
In the caudal vessel bleeding assay, the zebrafish was laid laterally on a dry paper towel, and its body was wiped with a laboratory tissue to remove any moisture. We then drew a line at 2 mm above the scissor’s tips, which were then inserted into the fish body until the marker line touched the skin between the ventral and dorsal fins and between the second and fourth black stripes from the dorsal end, and an incision of the vessels was made. After 1 minute, bleeding was recorded by taking photographs as described. To quantify bleeding, we used ImageJ software (https://imagej.nih.gov/ij/). The red pixels were counted as an index of the area and were multiplied by the mean pixel intensity to yield the total red intensity representing the extent of bleeding.28
Results
RNA released from human and zebrafish RBC lysates activates blood coagulation
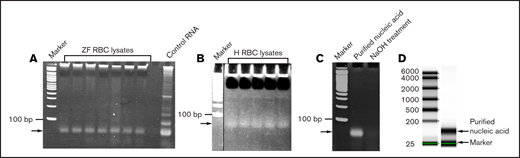
To identify which RNA components are released during RBC lysis, we collected blood from multiple zebrafish and centrifuged it to remove the plasma. The remaining RBCs were washed and lysed with nuclease-free DEPC water. We found only a single band of nucleic acid after gel electrophoresis of these lysates (Figure 1A). Because native polyacrylamide gels with double-stranded DNA size markers were used, the size of this band was difficult to assess. The WBC lysis did not show any RNA band after gel electrophoresis (supplemental Figure 3). We also obtained similar data with human RBC lysates (Figure 1B). To establish whether this band was DNA or RNA, we treated the RBC lysates with NaOH and found that the band disappeared upon gel electrophoresis (Figure 1C). Because NaOH digests RNA and not DNA, the results suggested that the observed nucleic acid was RNA. It was also confirmed by digesting the lysate with RNase, which eliminated the RNA band on the gel. This result also confirmed that the nucleic acid was RNA (supplemental Figure 3). The quality of the RNA was checked with a BioAnalyzer that used denaturing gels and RNA size markers. The results showed that the RNA moved as a single band and was about 150 nucleotides in length (Figure 1D). We then sequenced this RNA by RNA-seq, followed by bioinformatic analysis that revealed that the RNA was a mixture of rRNAs, miRNAs, and other RNAs (supplemental Table 1), but not total RNA. However, the concentration of the 5.8S rRNA was about 85% compared with the rest of miRNAs and other RNAs combined. The concentrations of the RNAs are represented as fragments per kb of transcript per million mapped reads (FPKM), and their identities are provided in supplemental Table 1.

Analysis of the RBC lysates. Zebrafish (ZF) (A) and human (H) (B) RBC lysates were run on 5% native polyacrylamide gel and stained with EtBr. Arrows show a single band of nucleic acid. Double-stranded DNA size markers are indicated by “Marker.” (C) NaOH treatment of the gel-purified nucleic acid (indicated by arrow) from the zebrafish RBC lysates shows disappearance of the nucleic acid. (D) Quality of the purified RNA from zebrafish RBC lysates was checked by Omega Bioservices using a denaturing gel. Arrows indicate the purified RNA (150 nucleotides long) and the internal marker (25 nucleotides long). The standard RNA size markers are shown on the left.
Analysis of the RBC lysates. Zebrafish (ZF) (A) and human (H) (B) RBC lysates were run on 5% native polyacrylamide gel and stained with EtBr. Arrows show a single band of nucleic acid. Double-stranded DNA size markers are indicated by “Marker.” (C) NaOH treatment of the gel-purified nucleic acid (indicated by arrow) from the zebrafish RBC lysates shows disappearance of the nucleic acid. (D) Quality of the purified RNA from zebrafish RBC lysates was checked by Omega Bioservices using a denaturing gel. Arrows indicate the purified RNA (150 nucleotides long) and the internal marker (25 nucleotides long). The standard RNA size markers are shown on the left.
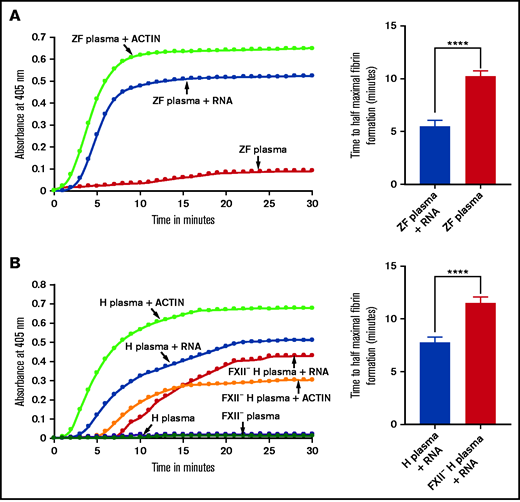
Because the lysate had more of the 5.8S rRNA fraction than other fractions and because other negatively charged molecules such as yeast transfer RNA (tRNA) and polyphosphates from platelets have been shown to activate coagulation, we hypothesized that 5.8S rRNA might activate the intrinsic pathway of coagulation.7,11 To test this hypothesis, we isolated the 5.8S rRNA along with miRNAs by gel electrophoresis. We added this gel-purified 5.8s rRNA to the zebrafish plasma and monitored coagulation using a kinetic coagulation assay that measures the fibrin formation at 405 nm as a function of time at 25°C. As expected, the the gel-purified RNA activated blood coagulation in the kinetic coagulation assay compared with the control (Figure 2A). Human plasma was also activated in the presence of gel-purified zebrafish 5.8S rRNA, leading to fibrin formation (Figure 2B). We found that the human 5.8S rRNA gave similar results with human plasma (supplemental Figure 1A and 1B). Likewise, we found that zebrafish plasma was also activated by gel-purified human 5.8S rRNA (supplemental Figure 1D). Both human and zebrafish 5.8S rRNA sequences are conserved and share 96% of their identities (supplemental Figure 1E).

Activation of zebrafish and human plasmas by gel-purified RNA from RBC lysates. (A-B) Left graphs show increasing fibrin formation with increasing time in the kinetic coagulation assay. The curves were obtained from (A) zebrafish plasma with RNA (A) and human plasma with RNA or FXII-deficient (FXII–) (B) human plasma with RNA; both panels show plasma with Dade Actin and in the absence of RNA or Dade Actin (control). The bar graphs on the right show a significant shortening of the time to half-maximal fibrin formation (using data from the left graphs) (A) for zebrafish plasma with RNA and without RNA (control) and (B) for normal human plasma with RNA and FXII– human plasma with RNA (n = 4). The time (in minutes) was plotted against the absorbance at 405 nm at 25°C. The data were analyzed using Student t test and are shown as mean ± standard error of the mean (SEM). ****P < .0001.
Activation of zebrafish and human plasmas by gel-purified RNA from RBC lysates. (A-B) Left graphs show increasing fibrin formation with increasing time in the kinetic coagulation assay. The curves were obtained from (A) zebrafish plasma with RNA (A) and human plasma with RNA or FXII-deficient (FXII–) (B) human plasma with RNA; both panels show plasma with Dade Actin and in the absence of RNA or Dade Actin (control). The bar graphs on the right show a significant shortening of the time to half-maximal fibrin formation (using data from the left graphs) (A) for zebrafish plasma with RNA and without RNA (control) and (B) for normal human plasma with RNA and FXII– human plasma with RNA (n = 4). The time (in minutes) was plotted against the absorbance at 405 nm at 25°C. The data were analyzed using Student t test and are shown as mean ± standard error of the mean (SEM). ****P < .0001.
5.8S rRNA activates blood coagulation via its 3'-end
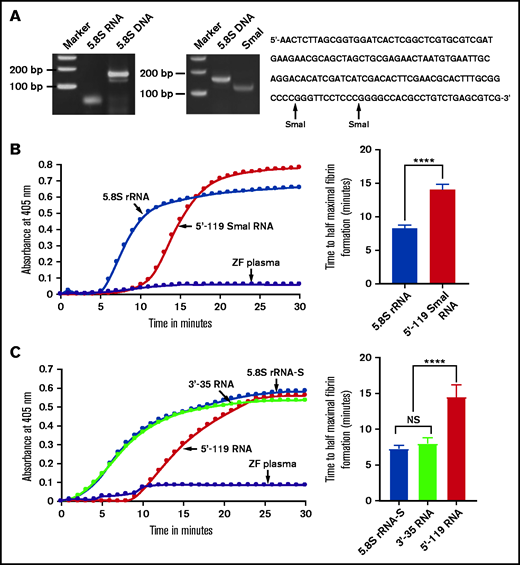
Because the coagulation was activated by gel-purified 5.8S rRNA that also contained negligible amounts of each of the miRNAs and other RNAs, we prepared 5.8S DNA containing the T7 promoter sequences by RT-PCR to rule out the contribution of miRNAs and other RNAs for the coagulation activity. We then transcribed this template in vitro to obtain pure 5.8S rRNA (Figure 3A). This purified form also activated both zebrafish and human plasma in the kinetic coagulation assay (Figure 3B).

Comparison of activation of coagulation by 5.8S rRNA, 5'-119 SmaI RNA, 5.8S rRNA-S, 3'-35 RNA, and 5'-119 RNA. (A) Left: zebrafish gel-purified 5.8S rRNA was used as a template to generate 5.8S DNA by using RT-PCR. The bands corresponding to 5.8S RNA and 5.8S DNA are shown on 5% polyacrylamide gel. Middle: SmaI digestion of 5.8S DNA to generate 5'-119 SmaI RNA. Right: 5.8S DNA sequence containing 2 SmaI restriction sites (indicated by arrows). (B-C) Left graphs show increasing fibrin formation with increasing time in the kinetic coagulation assay. (B) Left graph: curves were obtained from zebrafish plasma that contained 5.8S rRNA or 5'-119 SmaI RNA or had no RNA. Bar graph shows a significant shortening of time to half-maximal fibrin formation (using data obtained from the left graph) of the zebrafish plasma with 5.8S rRNA compared with zebrafish plasma with 5'-119 SmaI RNA (n = 4). The data for time to half-maximal fibrin formation (in minutes) were analyzed using Student t test and are shown as mean ± SEM. (C) Left graph: curves were obtained from zebrafish plasma that contained 5.8S rRNA-S, 3'-35 RNA, or 5'-119 RNA, or with no RNA. Bar graph shows a significant shortening of the time to half-maximal fibrin formation (obtained from the left graph) of zebrafish plasma with 5.8S rRNA-S or 3'-35 RNA compared with 5'-119 RNA (n = 4). The data for time to half-maximal fibrin formation (in minutes) were analyzed using one-way analysis of variance (ANOVA) and are show as mean ± SEM. For panel B and C curves, the time (in minutes) was plotted against the absorbance at 405 nm at 25°C. For more detail, see supplemental Table 2. ****P < .0001. NS, not significant.
Comparison of activation of coagulation by 5.8S rRNA, 5'-119 SmaI RNA, 5.8S rRNA-S, 3'-35 RNA, and 5'-119 RNA. (A) Left: zebrafish gel-purified 5.8S rRNA was used as a template to generate 5.8S DNA by using RT-PCR. The bands corresponding to 5.8S RNA and 5.8S DNA are shown on 5% polyacrylamide gel. Middle: SmaI digestion of 5.8S DNA to generate 5'-119 SmaI RNA. Right: 5.8S DNA sequence containing 2 SmaI restriction sites (indicated by arrows). (B-C) Left graphs show increasing fibrin formation with increasing time in the kinetic coagulation assay. (B) Left graph: curves were obtained from zebrafish plasma that contained 5.8S rRNA or 5'-119 SmaI RNA or had no RNA. Bar graph shows a significant shortening of time to half-maximal fibrin formation (using data obtained from the left graph) of the zebrafish plasma with 5.8S rRNA compared with zebrafish plasma with 5'-119 SmaI RNA (n = 4). The data for time to half-maximal fibrin formation (in minutes) were analyzed using Student t test and are shown as mean ± SEM. (C) Left graph: curves were obtained from zebrafish plasma that contained 5.8S rRNA-S, 3'-35 RNA, or 5'-119 RNA, or with no RNA. Bar graph shows a significant shortening of the time to half-maximal fibrin formation (obtained from the left graph) of zebrafish plasma with 5.8S rRNA-S or 3'-35 RNA compared with 5'-119 RNA (n = 4). The data for time to half-maximal fibrin formation (in minutes) were analyzed using one-way analysis of variance (ANOVA) and are show as mean ± SEM. For panel B and C curves, the time (in minutes) was plotted against the absorbance at 405 nm at 25°C. For more detail, see supplemental Table 2. ****P < .0001. NS, not significant.
We then checked for specific sequences within the 5.8S rRNA that were responsible for the clotting activity. Initially, because there are 2 SmaI restriction enzyme sites in the 5.8S DNA sequence (Figure 3A), we cleaved the DNA with this enzyme to generate 3 fragments, large (5'-119 bp), smaller (3'-24 bp), and the smallest (3'-11 bp) fragments. However, the 5'-119-bp fragment was capable only of acting as a template for T7 polymerase transcription. Therefore, we purified this fragment and used it to prepare 5'-119 SmaI RNA. Interestingly, this 5'-119 SmaI RNA did not activate coagulation, whereas the natural full-length 5.8S rRNA did activate coagulation, which was confirmed by a 5'-119 SmaI RNA kinetic curve that showed a prolonged half-maximal time for fibrin formation (Figure 3B). We also designed a 5'-119 DNA template using 5'-end sense primer containing the T7 promoter and the 3'-end antisense primer from position 119 in the 5.8S DNA. The 5'-119 RNA derived from this template also gave results similar to those found with 5'-119 SmaI RNA (Figure 3C). We then designed another 3'-35 DNA template corresponding to the 3'-end of 5.8S rRNA by annealing 2 synthetic deoxyoligonucleotides containing the T7 promoter sequence. The 3'-35 RNA derived from this template activated zebrafish plasma the same way 5.8S rRNA-S did (Figure 3C). These results suggested that the critical region responsible for activation is at the 3' terminal side of 5.8S rRNA.
Only the 3'-end 26 nucleotide of 5.8S rRNA is necessary and sufficient for activation of coagulation
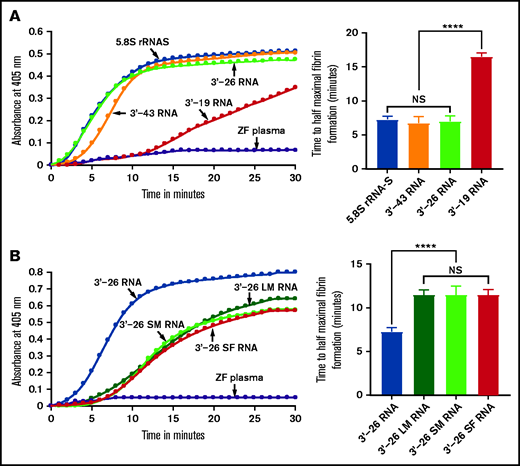
Because the 3'-35 RNA sequence seemed to be critical for coagulation activity, we examined the secondary structure of this 3'-35 RNA. We found that it had 2 stem-loop structures joined by a linker sequence. Interestingly, the 3'-terminal sequence of the intact 5.8S rRNA had a similar, although not identical secondary structure (supplemental Table 2). To determine whether an RNA secondary structure similar to that of the intact 5.8S rRNA had coagulation activity, we synthesized RNA corresponding to 3'-end 43 nucleotides (3'-43 RNA) of the 5.8S rRNA in vitro using the template DNAs prepared as described above (supplemental Table 2). We then added this RNA to the zebrafish plasma to test whether it activates blood coagulation. We found that 3'-43 RNA activated blood coagulation in the kinetic coagulation assay similar to the way 3'-35 RNA does (Figure 4A). Both 3'-43 RNA and 3'-35 RNA have 2 stem-loop structures. The 3'-side stem-loop structure is identical in both of these RNAs. However, the 5'-side stem-loop structure of 3'-43 RNA has a longer stem-loop structure (similar to that of the endogenous 5.8S rRNA) than the one found in 3'-35 RNA (supplemental Table 2). To examine whether the longer 5'-side or shorter 3'-side stem-loop structure of the 3'-43 RNA had coagulation activity, we prepared 3'-26 RNA and 3'-19 RNA using templates as described above. We added each of these RNAs to the zebrafish plasma to determine which of them would activate blood coagulation. We found that 3'-26 RNA activated blood coagulation and the 3'-19 RNA did not (Figure 4A).

Activation of zebrafish plasma by 3'-26 RNA. (A-B) Left graphs show the increasing fibrin formation with increasing time in the kinetic coagulation assay. (A) Left graph: curves were obtained from zebrafish plasma in the presence of 5.8S rRNA-S, 3'-43 RNA, 3'-26 RNA, and 3'-19 RNA and in the absence of RNA. Bar graph shows a significant shortening of the time to half-maximal fibrin formation (using data obtained from the left graph) of zebrafish plasma with 5.8S rRNA-S, 3'-43 RNA, and 3'-26 RNA compared with 3'-19 RNA. (B) Left graph: curves were obtained from zebrafish plasma in the presence of 3'-26 RNA, 3'-26 LM RNA, 3'-26 SM RNA, and 3'-26 SF RNA and in the absence of RNA. Bar graph shows a significant shortening of the time to half-maximal fibrin formation (using data obtained from the left graph) of zebrafish plasma with 3'-26 RNA compared with 3'-26 LM RNA, 3'-26 SM RNA, and 3'-26 SF RNA (n = 4). For panel A and B curves, the time (in minutes) was plotted against absorbance at 405 nm at 25°C. The data for time to half-maximal fibrin formation (in minutes) were analyzed using one-way ANOVA and are shown as mean ± SEM. ****P < .0001. LM, loop mutation; SF, stem flipping; SM, stem mutation.
Activation of zebrafish plasma by 3'-26 RNA. (A-B) Left graphs show the increasing fibrin formation with increasing time in the kinetic coagulation assay. (A) Left graph: curves were obtained from zebrafish plasma in the presence of 5.8S rRNA-S, 3'-43 RNA, 3'-26 RNA, and 3'-19 RNA and in the absence of RNA. Bar graph shows a significant shortening of the time to half-maximal fibrin formation (using data obtained from the left graph) of zebrafish plasma with 5.8S rRNA-S, 3'-43 RNA, and 3'-26 RNA compared with 3'-19 RNA. (B) Left graph: curves were obtained from zebrafish plasma in the presence of 3'-26 RNA, 3'-26 LM RNA, 3'-26 SM RNA, and 3'-26 SF RNA and in the absence of RNA. Bar graph shows a significant shortening of the time to half-maximal fibrin formation (using data obtained from the left graph) of zebrafish plasma with 3'-26 RNA compared with 3'-26 LM RNA, 3'-26 SM RNA, and 3'-26 SF RNA (n = 4). For panel A and B curves, the time (in minutes) was plotted against absorbance at 405 nm at 25°C. The data for time to half-maximal fibrin formation (in minutes) were analyzed using one-way ANOVA and are shown as mean ± SEM. ****P < .0001. LM, loop mutation; SF, stem flipping; SM, stem mutation.
We also introduced 3 different mutations in the stem-loop sequence of 3'-26 RNA. In the first mutation, we replaced all G:C bp with A:U bp in the stem region. In the second mutation, we replaced the sequence of loop 5'-UUCCU-3' with 5'-AAGGA-3'. In the third mutation, we replaced all G:C bp with C:G bp within the stem region. We added each of these 3 mutated RNAs to the zebrafish plasma to determine which of them would activate blood coagulation. We found that none of these mutated RNAs activated the zebrafish plasma in the kinetic coagulation assay (Figure 4B). These results suggested that the primary sequence of the stem-loop is essential for the clotting activity.
3'-26 RNA activates coagulation via FXII in humans and Hgfac in zebrafish
To determine whether the 3'-26 RNA activates the FXII-mediated intrinsic pathway of coagulation, we added 3'-26 RNA to FXII-deficient human plasma. We found that the 3'-26 RNA did not activate FXII-deficient plasma, whereas it did activate normal human plasma (Figure 5A). We also confirmed that this reaction is FXII mediated by using normal human plasma in the presence of CTI, a known inhibitor for FXII. We obtained curves that showed inhibition by CTI (supplemental Figure 1C). Similarly, we incubated the zebrafish plasma with the 3'-26 RNA in the presence and absence of CTI and found that CTI inhibited 3'-26 RNA–mediated activation of coagulation. These results also showed inhibition similar to that observed with human plasma (Figure 5B). We have also shown that the CTI did not inhibit kinetic coagulation in the presence of thromboplastin (supplemental Figure 2). We then injected CTI IV into zebrafish larvae and induced both arterial and venous thrombosis by a laser injury. The results showed prolongation of TTO in both venous (Figure 5C) and arterial (Figure 5D) thrombosis. However, the prolongation in venous TTO was not as dramatic as that found in arterial TTO (Figure 5C-D). To confirm whether 3'-26 RNA activated human FXII, we performed an in vitro assay containing purified FXII and its chemical substrate. We found that the purified FXII was activated by 3'-26 RNA, similar to activation by the positive control Dade Actin (supplemental Figure 3).

Lack of activation of FXII-deficient human plasma or zebrafish plasma in the presence of CTI by 3'-26 RNA. (A-B) Left graphs show the increasing fibrin formation with increasing time in the kinetic coagulation assay. (A) Left graph: curves were obtained from normal and FXII-deficient human plasma in the presence of 3'-26 RNA and in the absence of RNA. Bar graph shows a significant shortening of the time to half-maximal fibrin formation (using data obtained from the left graph); normal human plasma is compared with FXII-deficient human plasma in the presence of 3'-26 RNA. (B) Left graph: curves were obtained from zebrafish plasma activated by 3'-26 RNA in the absence or presence of CTI and in the absence of both RNA and CTI. Bar graph shows a significant shortening of the time to half-maximal fibrin formation (using data obtained from the left graph) for zebrafish plasma activated by 3'-26 RNA in the absence or presence of CTI (n = 4). For curves in panels A and B, the time in minutes was plotted against the absorbance at 405 nm at 25°C. The data for time to half-maximal fibrin formation (in minutes) were analyzed using Student t test and are shown as mean ± SEM. (C-D) Inhibition of venous thrombosis (C) and arterial thrombosis (D) by CTI in zebrafish larvae. Prolongation of the TTO in the caudal vein (C) and the caudal artery (D) of CTI-injected larvae was significant compared with that for the PBS-injected larvae (n = 48). The data were analyzed using Student t test and are shown as mean ± SEM. ****P < .0001.
Lack of activation of FXII-deficient human plasma or zebrafish plasma in the presence of CTI by 3'-26 RNA. (A-B) Left graphs show the increasing fibrin formation with increasing time in the kinetic coagulation assay. (A) Left graph: curves were obtained from normal and FXII-deficient human plasma in the presence of 3'-26 RNA and in the absence of RNA. Bar graph shows a significant shortening of the time to half-maximal fibrin formation (using data obtained from the left graph); normal human plasma is compared with FXII-deficient human plasma in the presence of 3'-26 RNA. (B) Left graph: curves were obtained from zebrafish plasma activated by 3'-26 RNA in the absence or presence of CTI and in the absence of both RNA and CTI. Bar graph shows a significant shortening of the time to half-maximal fibrin formation (using data obtained from the left graph) for zebrafish plasma activated by 3'-26 RNA in the absence or presence of CTI (n = 4). For curves in panels A and B, the time in minutes was plotted against the absorbance at 405 nm at 25°C. The data for time to half-maximal fibrin formation (in minutes) were analyzed using Student t test and are shown as mean ± SEM. (C-D) Inhibition of venous thrombosis (C) and arterial thrombosis (D) by CTI in zebrafish larvae. Prolongation of the TTO in the caudal vein (C) and the caudal artery (D) of CTI-injected larvae was significant compared with that for the PBS-injected larvae (n = 48). The data were analyzed using Student t test and are shown as mean ± SEM. ****P < .0001.
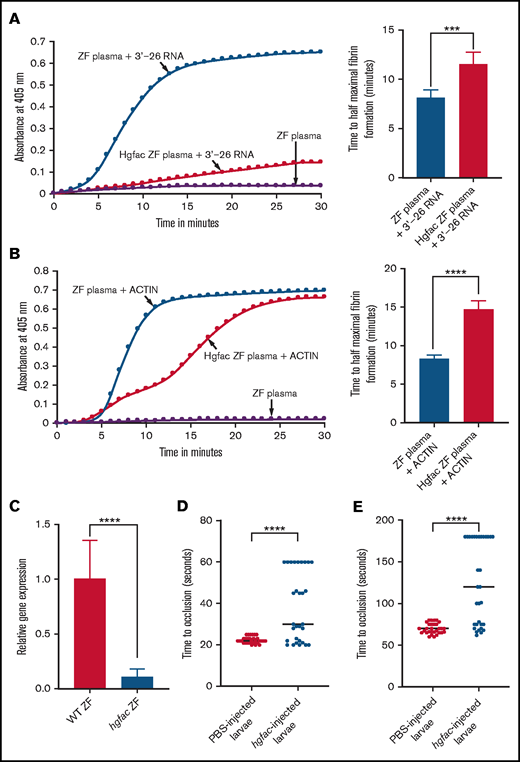
Because it has been suggested that FXII and Hgfac arose from a common ancestor as homologs and because the FXII gene is not present in the zebrafish genome, we hypothesized that the Hgfac might function in fish similar to the way FXII functions in humans.29 To test this hypothesis, we performed knockdown of hgfac in adult zebrafish by the piggyback knockdown method.30 We IV injected an antisense oligonucleotide to the hgfac coding sequence hybridized with a VMO into zebrafish. After 48 hours, plasma was collected and subjected to activation by 3'-26 RNA. We found that the hgfac knockdown plasma did not form fibrin when compared with normal plasma in the kinetic coagulation assay (Figure 6A). In addition, the knockdown of hgfac in zebrafish resulted in a lack of activation of zebrafish plasma in the presence of Dade Actin (Figure 6B). We also confirmed the knockdown of hgfac by qRT-PCR and found that the knockdown efficiency was about 90% (Figure 6C). We then performed a knockdown of hgfac in zebrafish larvae and induced both arterial and venous thrombosis by laser injury. The results showed prolongation of TTO in both venous (Figure 6D) and arterial (Figure 6E) thrombosis assays.

hgfac knockdown in zebrafish plasma exhibits a reduction in coagulation activation by 3'-26 RNA and Dade Actin. (A-B) Left graphs show the increasing fibrin formation with increasing time in the kinetic coagulation assay. (A) Left graph: curves were obtained from zebrafish plasma in the presence of 3'-26 RNA or zebrafish plasma with hgfac knockdown, and zebrafish plasma in the absence of RNA. Bar graph shows a significant shortening of the time to half-maximal fibrin formation (using data obtained from the left graph) with zebrafish plasma in the presence of 3'-26 RNA compared with that in hgfac knockdown plasma (n = 6). (B) Left graph: curves were obtained from zebrafish plasma with Dade Actin or with hgfac knockdown and in the absence of Dade Actin. Bar graph shows a significant shortening of the time to half-maximal fibrin formation (using data obtained from the left graph) in zebrafish plasma with Dade Actin compared with hgfac knockdown plasma (n = 4). For curves in panels A and B, the time in minutes was plotted against the absorbance at 405 nm at 25°C. The data for time to half-maximal fibrin formation (in minutes) were analyzed using Student t test and are shown as mean ± SEM. (C) qRT-PCR showing the reduction of hgfac mRNA levels after hgfac knockdown. The relative fold change in gene expression of hgfac is shown . Wild-type (WT) zebrafish are the PBS-injected control, and hgfac indicates the antisense piggyback hybrid primer-injected zebrafish (n = 6). The data for relative fold change in gene expression were analyzed using Student t test and are shown as mean ± SEM. (D-E) Inhibition of venous thrombosis (D) and arterial thrombosis (E) by hgfac knockdown in zebrafish larvae. Prolongation of the TTO in the caudal vein (D) and caudal artery (E) of larvae injected with hgfac piggyback hybrid primer is significant compared with that in the larvae injected with PBS (n = 30). The data were analyzed using Student t test and are shown as mean ± SEM . ***P < .001; ****P < .0001.
hgfac knockdown in zebrafish plasma exhibits a reduction in coagulation activation by 3'-26 RNA and Dade Actin. (A-B) Left graphs show the increasing fibrin formation with increasing time in the kinetic coagulation assay. (A) Left graph: curves were obtained from zebrafish plasma in the presence of 3'-26 RNA or zebrafish plasma with hgfac knockdown, and zebrafish plasma in the absence of RNA. Bar graph shows a significant shortening of the time to half-maximal fibrin formation (using data obtained from the left graph) with zebrafish plasma in the presence of 3'-26 RNA compared with that in hgfac knockdown plasma (n = 6). (B) Left graph: curves were obtained from zebrafish plasma with Dade Actin or with hgfac knockdown and in the absence of Dade Actin. Bar graph shows a significant shortening of the time to half-maximal fibrin formation (using data obtained from the left graph) in zebrafish plasma with Dade Actin compared with hgfac knockdown plasma (n = 4). For curves in panels A and B, the time in minutes was plotted against the absorbance at 405 nm at 25°C. The data for time to half-maximal fibrin formation (in minutes) were analyzed using Student t test and are shown as mean ± SEM. (C) qRT-PCR showing the reduction of hgfac mRNA levels after hgfac knockdown. The relative fold change in gene expression of hgfac is shown . Wild-type (WT) zebrafish are the PBS-injected control, and hgfac indicates the antisense piggyback hybrid primer-injected zebrafish (n = 6). The data for relative fold change in gene expression were analyzed using Student t test and are shown as mean ± SEM. (D-E) Inhibition of venous thrombosis (D) and arterial thrombosis (E) by hgfac knockdown in zebrafish larvae. Prolongation of the TTO in the caudal vein (D) and caudal artery (E) of larvae injected with hgfac piggyback hybrid primer is significant compared with that in the larvae injected with PBS (n = 30). The data were analyzed using Student t test and are shown as mean ± SEM . ***P < .001; ****P < .0001.
5.8S RmAb inhibited the 5.8S rRNA– and 3'-26 RNA–mediated activation of coagulation
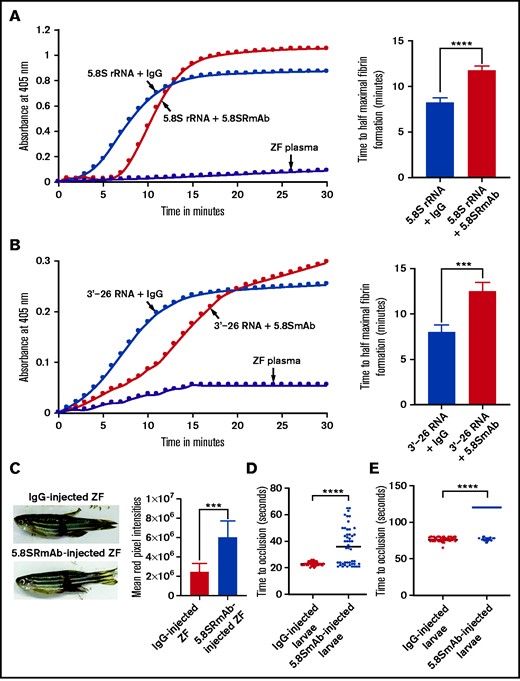
To determine whether 5.8S RmAb inhibits 5.8S rRNA–mediated activation of coagulation, we performed a kinetic coagulation assay using 5.8S rRNA in the presence of 5.8S RmAb. As expected, we found that this antibody prolonged the formation of fibrin (Figure 7A). Similarly, we also found that the 3'-26 RNA–mediated coagulation activation was inhibited by the above-mentioned antibody (Figure 7B). To test whether 5.8S rRNA plays a role in clotting in vivo, we injected adult zebrafish IV with either 5.8S RmAb or control immunoglobulin G (IgG). We then performed the mechanical caudal vessel bleeding assay and found that zebrafish injected with 5.8S RmAb had more bleeding compared with zebrafish injected with IgG (Figure 7C).28 We also IV injected the zebrafish larvae with 5.8S RmAb and performed venous and arterial laser thrombosis assays. The results showed that the larvae injected with 5.8S RmAb had a prolonged TTO in both venous (Figure 7D) and arterial (Figure 7E) thrombosis compared with the control larvae.

Inhibition of 5.8S rRNA– and 3'-26 RNA–mediated activation of zebrafish plasma in the presence of 5.8S RmAb. (A-B) Left graphs show the increasing fibrin formation with increasing time in the kinetic coagulation assay. (A) Left graph: curves were obtained from zebrafish plasma that contained 5.8S rRNA plus IgG or 5.8S rRNA plus 5.8S RmAb, and in the absence of RNA and antibody. Bar graph shows a significant shortening of the time to half-maximal fibrin formation (using data obtained from the left graph) in zebrafish plasma containing 5.8S rRNA plus IgG compared with zebrafish plasma containing 5.8S rRNA plus 5.8S RmAb (n = 4). The data for time to half-maximal fibrin formation (in minutes) were analyzed using Student t test and are shown as mean ± SEM . ****P < .0001. (B) Left graph: curves were obtained from zebrafish plasma that contained 3'-26 RNA plus IgG or 3'-26 RNA plus 5.8S RmAb, and without RNA, IgG, and antibody. Bar graph shows a significant shortening of the time to half-maximal fibrin formation (using data obtained from the left graph) in zebrafish plasma that contained 3'-26 RNA plus IgG compared with zebrafish plasma that contained 3'-26 RNA plus 5.8S RmAb (n = 4). The data for time to half-maximal fibrin formation (in minutes) were analyzed using Student t test and are shown as mean ± SEM. *** P < .001. For curves in panels A and B, the time (in minutes) was plotted against the absorbance at 405 nm at 25°C. (C) Left: adult zebrafish were IV injected with either IgG or 5.8S RmAb and were subjected to the caudal vessel bleeding assay. Bar graph shows increased total red pixel intensities in zebrafish injected with IgG compared with zebrafish injected with 5.8S RmAb (n = 6). The total red pixel intensity data were analyzed using Student t test and are shown as mean ± SEM. ***P < .001. (D-E) Inhibition of venous thrombosis (D) and arterial thrombosis (E) by 5.8S RmAb in zebrafish larvae. Graphs show a significant prolongation of the TTO (in seconds) in the caudal vein (D) or caudal artery (E) of larvae injected with 5.8S RmAb compared with larvae injected with IgG (n = 48). (D-E) The data were analyzed using Student t test and are shown as mean ± SEM. ****P < .0001.
Inhibition of 5.8S rRNA– and 3'-26 RNA–mediated activation of zebrafish plasma in the presence of 5.8S RmAb. (A-B) Left graphs show the increasing fibrin formation with increasing time in the kinetic coagulation assay. (A) Left graph: curves were obtained from zebrafish plasma that contained 5.8S rRNA plus IgG or 5.8S rRNA plus 5.8S RmAb, and in the absence of RNA and antibody. Bar graph shows a significant shortening of the time to half-maximal fibrin formation (using data obtained from the left graph) in zebrafish plasma containing 5.8S rRNA plus IgG compared with zebrafish plasma containing 5.8S rRNA plus 5.8S RmAb (n = 4). The data for time to half-maximal fibrin formation (in minutes) were analyzed using Student t test and are shown as mean ± SEM . ****P < .0001. (B) Left graph: curves were obtained from zebrafish plasma that contained 3'-26 RNA plus IgG or 3'-26 RNA plus 5.8S RmAb, and without RNA, IgG, and antibody. Bar graph shows a significant shortening of the time to half-maximal fibrin formation (using data obtained from the left graph) in zebrafish plasma that contained 3'-26 RNA plus IgG compared with zebrafish plasma that contained 3'-26 RNA plus 5.8S RmAb (n = 4). The data for time to half-maximal fibrin formation (in minutes) were analyzed using Student t test and are shown as mean ± SEM. *** P < .001. For curves in panels A and B, the time (in minutes) was plotted against the absorbance at 405 nm at 25°C. (C) Left: adult zebrafish were IV injected with either IgG or 5.8S RmAb and were subjected to the caudal vessel bleeding assay. Bar graph shows increased total red pixel intensities in zebrafish injected with IgG compared with zebrafish injected with 5.8S RmAb (n = 6). The total red pixel intensity data were analyzed using Student t test and are shown as mean ± SEM. ***P < .001. (D-E) Inhibition of venous thrombosis (D) and arterial thrombosis (E) by 5.8S RmAb in zebrafish larvae. Graphs show a significant prolongation of the TTO (in seconds) in the caudal vein (D) or caudal artery (E) of larvae injected with 5.8S RmAb compared with larvae injected with IgG (n = 48). (D-E) The data were analyzed using Student t test and are shown as mean ± SEM. ****P < .0001.
Discussion
Our results showed that a significant amount of RNA is released from the lysis of RBCs. Although damaged RBCs have been shown to release hemoglobin and other molecular components into the plasma, to our knowledge, this is the first observation that a reasonable amount of RNA is released from RBCs. Because RBCs are terminally differentiated cells and are essential for oxygen transport, it is expected that they release hemoglobin after lysis. However, reticulocytes have been shown to contain RNA and other translational machinery, and RNAs were not demonstrated in mature RBCs.31,32 In this context, the observed RNA in the human RBC lysates could be from reticulocytes. However, it is also likely that because of the degradation of organelles, including ribosomes in reticulocytes, there may be a residual 5.8S rRNA that could be retained in the erythrocytes. This remains to be proven.33
Here, we have artificially lysed the RBCs and, interestingly, the lysis in the hemolytic syndromes is sometimes extensive. The RBCs are fragile and lyse quickly (<15 seconds) in hypotonic solutions compared with other cells.34 Our results showed no RNA band after WBC lysis. This is probably a result of a smaller amount of RNA added after WBC lysis because there are fewer WBCs than RBCs. However, increasing the number of WBCs to match the number of RBCs in lysis would depart from in vivo conditions. Thus, the in vivo contribution of other blood cell types such as thrombocytes and monocytes to the lysate could be minimal. Similarly, because the 5.8S rRNA is gel purified and the polyphosphates and phospholipids mobility will be different, the contamination of these molecules should be minimal. Moreover, because we used in vitro transcribed RNA, this contamination is further eliminated. However, in vivo, the polyphosphate and phospholipid contribution could still be there along with the 5.8S rRNA. Thus, the red cell lysis at the site of injury seems to be important because of the release of charged compounds such as ribosomal RNA and polyphosphates from these cells, which will activate coagulation.
In our results, the nucleic acid released from the RBCs was confirmed to be RNA by treating it with NaOH as well as RNase. The RNA-seq analysis revealed many types of RNA, including 5.8S rRNA, miRNAs, and other RNAs. Because all of these RNAs consisted of ∼154 nucleotides, a single band was observed in gel electrophoresis since they could not be resolved. Interestingly, RBCs released predominantly 5.8S rRNA. Considering the relatively negligible quantities of miRNAs and other RNAs, we predicted that the 5.8S rRNA would have a function in coagulation.
Previous studies have shown that extracellular nucleic acids, especially RNAs released from damaged cells, activate blood coagulation via FXII of the contact phase pathway of blood coagulation.11 Interestingly, the previous studies have exogenously added transfer RNAs to the plasma to demonstrate the role of RNAs in clotting. In our studies, we did not find tRNAs in the RBC lysis. Thus, 5.8S rRNA seems to be the relevant endogenous RNA for functioning as an activator of coagulation. Our results showed that RBCs release only 5.8S rRNA upon lysis, whereas the other rRNAs are not being released. These results suggest that because 5.8S rRNA is the predominant component released after hemolysis, it may be involved in coagulation and thrombus formation in vivo, and 28S and 18S are less likely to be involved in coagulation. 5.8S rRNA is usually found complexed with 28S rRNA in the ribosome.35 However, we did not find 18S and 28S rRNAs in the lysis, which suggests that the 5.8S rRNA is either released from 28S rRNA by dissociation or the released 5.8S rRNA is from the free pool of 5.8S rRNA. This hypothesis remains to be tested in future studies.36
In our study, human plasma was activated by zebrafish 5.8S rRNA, and zebrafish plasma was activated by human 5.8S rRNA (Figure 2; supplemental Figure 1). Because human and zebrafish 5.8S rRNAs differ by only a few nucleotides and because they activate both zebrafish and human plasmas, the point mutations do not seem to abolish activity, and the overall negative charge seems important for activating coagulation. In fact, even artificial RNA polyinosinic:polycytidylic acid (poly[I:C]) when injected into rabbits activated coagulation.11 However, the in vivo specificity of coagulation activation by 5.8s rRNA, is a result of the red cells specifically releasing 5.8s RNA. If they released tRNA or polyphosphates, they would probably activate coagulation, as previously reported.7,11
The 5.8S rRNA has a relatively stable secondary structure in the G:C-rich 3'-region. Interestingly, full-length 5.8S rRNA-S activated blood coagulation. However, the truncated 5'-119 RNA did not activate coagulation, suggesting that the critical region is at the 3'-end of 5.8S rRNA. Moreover, 3'-43 RNA and 3'-35 RNA versions exhibited coagulation activation similar to that of full-length 5.8S rRNA-S, confirming that the nucleotide sequences at the 3'-end are more important for coagulation. Previous studies of the procoagulant structural activity of RNA have shown that only RNAs with a hairpin-forming structure were more structurally stable and demonstrated greater coagulation activity when compared with linear ones.37 Earlier reports also showed that the length of RNA required to activate blood coagulation has to be sufficiently large, with a minimum of 50 nucleotides. In our studies, we found that 3'-terminal 26 nucleotide-long hairpin-forming stem-loop secondary structure that is GC rich and lies between G115 and C135 is necessary and sufficient for activation of blood coagulation in vitro using the kinetic coagulation assay.
Other studies have shown that the stem-loop portion of 5.8S rRNA in yeast that is comparable to that found in zebrafish and human 5.8S rRNA is structurally stable with free energy of ΔG = −16.2 kcal/mole and high enthalpy of ΔH = −114 kcal/mole, suggesting that the hairpin-forming stem-loop structure of 5.8S rRNA provides its stability, and this stability may be critical for its function.38 To date, the RNA discovered here is the shortest RNA known to function in the activation of blood coagulation. Thus, our results depart from those of other studies and are the first to show that the 5.8S rRNA has a functional role in coagulation and is biologically relevant. The effects of shorter RNAs are comparable to those of 5.8S rRNA because we used molar equivalents of RNAs in our assays and observed the maximal effects at these concentrations. Thus, the shorter segment of the 5.8S rRNA seems to be sufficient for inducing coagulation activity.
Previous work from our laboratory has shown that activation of zebrafish plasma with Dade Actin was inhibited by CTI, similar to the inhibition of human plasma activation.15,25 The thromboplastin-mediated coagulation activation was not inhibited by CTI, suggesting that the CTI is inhibiting the FXII-like pathway. Our results showed that 5.8S rRNA–mediated activation of both human and zebrafish plasma was inhibited by using CTI, suggesting that the FXII-like pathway is probably involved in this activation in zebrafish. Our results using FXII-deficient plasma with a lack of activation of clotting by 5.8S rRNA and 3'-26 RNA also confirm that 5.8S rRNA is indeed activating FXII. Moreover, activation of purified human FXII by 3'-26 RNA in the in vitro assay provided additional confirmation. Interestingly, FXII deficiency protects mice from arterial thrombosis.10 Our results in zebrafish showed that CTI injections in larvae prolonged the arterial TTO and are consistent with the findings in studies using mice. We also found a binary distribution of the TTO in the larvae injected with CTI. These distributions of our microinjections via the posterior cardinal vein were not always 100% successful. Thus, the larvae that did not get adequate amounts of CTI would have TTO similar to those of control larvae, and those that received a sufficient dose of CTI would have prolonged TTO. Because we used a larger number of larvae, this binary distribution lends confidence to our results. In our laboratory, we noted that when a clot occurs in vitro, we find red cell lysis (P.J. unpublished observation when poorly citrated zebrafish blood after centrifugation is allowed to clot, the zone between cells and plasma becomes red first and ultimately turns plasma into red color due to red cell lysis, which is inhibited in warfarin-treated blood). In the laser injury model, we believe that such a mechanism is operating during clotting, and thus red cell lysis may occur. Moreover, the laser injury causes endothelial cell lysis followed by red cell initiation in venous thrombosis. The lysed endothelial cell may subsequently lyse the red cell and thus, the red cell may release 5.8S rRNA at the site of injury.
Although CTI inhibited the coagulation in vitro, the lack of the FXII gene in the zebrafish genome suggests that there must be a factor similar to FXII in fish. It has been noted that the hgfac gene is homologous to the human FXII gene, and it is thought that the FXII gene in humans resulted from a duplication of the ancestor of hgfac gene followed by divergence. FXII and Hgfac have all the domains conserved except that FXII carries an additional proline-rich domain.39 Our results have shown that knockdown of hgfac in zebrafish resulted in a lack of activation of zebrafish plasma by either Dade Actin or 5.8S rRNA and is consistent with the hypothesis that Hgfac is the evolutionary precursor for FXII. This study thus sheds light on charge-mediated contact activation of coagulation in fish and provides the basis for the evolution of blood coagulation. Future work on purified Hgfac and its activation by Dade Actin or 5.8S rRNA should confirm our hypothesis.
Our results also showed that 5.8S RmAb inhibited 5.8S rRNA–mediated clotting in vitro in both human and zebrafish plasma. 5.8S RmAb also inhibited 3'-26 RNA–mediated clotting in vitro. However, whether the 5.8S RmAb directly interacts with 3'-26 RNA is not known. Because our results showed functional inhibition of 3'-26 RNA–mediated coagulation activation, it is likely that there is a direct interaction between the 5.8S RmAb and 3'-26 RNA. Moreover, injection of this antibody into zebrafish larvae and in adult zebrafish resulted in prolonged arterial TTO and bleeding. These results suggest that this mAb could be used as a therapeutic drug to treat thrombosis and, in particular, pathological thrombosis induced in hemolytic syndromes. The level of 5.8S rRNA in the plasma can also be measured and used clinically as an additional test to monitor the extent of hemolysis. We also observed a binary distribution of TTO in the 5.8S RmAb–injected larvae that can be explained in a way similar to the CTI results mentioned above.
In conclusion, we determined that 5.8S rRNA is a significant component released by RBCs in hemolysis. The 3'-end 26 nucleotides of the 5.8S rRNA are necessary and sufficient to activate coagulation in fish via Hgfac. Inhibition of this RNA by 5.8S RmAb in vivo could provide a treatment of thrombosis in hemolytic disorders.
Acknowledgment
The work was supported by a grant from the National Institutes of Health, National Institute of Diabetes and Digestive and Kidney Diseases (DK117384).
Authorship
Contribution: A.A. maintained zebrafish, prepared 5.8S rRNA and its fragments, performed coagulation assays, analyzed secondary structures, prepared the figures, and participated in discussions; N.I. performed qRT-PCR, in vitro FXII assays, and laser thrombosis assays, prepared the figures, and participated in discussions; A.A.Q. performed larval IV injections; R.R. performed laser thrombosis assays and participated in discussions; R.K.A. guided D.J.B. in RNA-seq analysis and interpreted the data; and P.J. designed the research, analyzed the data, and wrote the paper.
Conflict-of-interest disclosure: The authors declare no competing financial interests.
Correspondence: Pudur Jagadeeswaran, Department of Biological Sciences, University of North Texas, 1511 West Sycamore St, Denton, TX 76203; e-mail: jag@unt.edu.