

Key Points
ERK pathway plays a key role in enucleation of human orthochromatic erythroblasts.
ERK regulates human erythroblast enucleation by affecting vesicular formation.

Abstract
Enucleation is a key event in mammalian erythropoiesis responsible for the generation of enucleated reticulocytes. Although progress is being made in developing mechanistic understanding of enucleation, our understanding of mechanisms for enucleation is still incomplete. The MAPK pathway plays diverse roles in biological processes, but its role in erythropoiesis has yet to be fully defined. Analysis of RNA-sequencing data revealed that the MAPK pathway is significantly upregulated during human terminal erythroid differentiation. The MAPK pathway consists of 3 major signaling cassettes: MEK/ERK, p38, and JNK. In the present study, we show that among these 3 cassettes, only ERK was significantly upregulated in late-stage human erythroblasts. The increased expression of ERK along with its increased phosphorylation suggests a potential role for ERK activation in enucleation. To explore this hypothesis, we treated sorted populations of human orthochromatic erythroblasts with the MEK/ERK inhibitor U0126 and found that U0126 inhibited enucleation. In contrast, inhibitors of either p38 or JNK had no effect on enucleation. Mechanistically, U0126 selectively inhibited formation/accumulation of cytoplasmic vesicles and endocytosis of the transferrin receptor without affecting chromatin condensation, nuclear polarization, or enucleosome formation. Treatment with vacuolin-1 that induces vacuole formation partially rescued the blockage of enucleation by U0126. Moreover, phosphoproteomic analysis revealed that inactivation of the ERK pathway led to downregulation of the endocytic recycling pathway. Collectively, our findings uncovered a novel role of ERK activation in human erythroblast enucleation by modulating vesicle formation and have implications for understanding anemia associated with defective enucleation.
Introduction
Erythropoiesis is a process by which multipotent hematopoietic stem and progenitor cells commit to erythroid lineage and eventually generate enucleated mature erythrocytes. It is a complex process that involves several distinct developmental stages: burst forming unit-erythroid, colony forming unit-erythroid, proerythroblast, basophilic erythroblast, polychromatic erythroblast, and orthochromatic erythroblast. Defects at any of these distinct developmental stages can lead to disordered erythropoiesis resulting in anemia. For example, Diamond-Blackfan anemia is primarily due to defects in erythroid progenitors,1,2 whereas apoptosis of terminally differentiating erythroblasts contributes to Cooley’s anemia and myelodysplastic syndrome.3-7 Cytokinesis/enucleation defects are primary characteristics of congenital dyserythropoietic anemia type II to IV.8-11
Enucleation is the process by which an orthochromatic erythroblast expels its nucleus to generate a nucleated pyrenocyte and enucleated reticulocyte. Given the physiological significance of enucleation in generating highly deformable red blood cells for effective oxygen delivery, understanding the mechanistic basis of enucleation has been an active area of investigation. In 1989, using mouse erythroblasts, Koury et al12 first showed that actin but not tubulin is required for enucleation. In contrast, Chasis et al13 found that inhibition of microtubule polymerization by colchicine impairs enucleation of rat erythroblasts. Supporting the role of actin in enucleation, Ji et al14 documented that rho-guanosine triphosphatase (GTPase)-mDia2 plays a critical role in enucleation by regulating actin contractile ring formation. Roles for myosin, tropomodulin, and lipid rafts have also been implicated.15-17
Given the important roles of actin and tubulin in cytokinesis, these studies suggest that erythroblast enucleation is a form of asymmetric cytokinesis. However, based on the findings that cytokinesis inhibitors do not affect enucleation when added to post-mitotic cells, Keerthivasan et al concluded that cytokinesis is not required for enucleation. They further provided compelling evidence that the erythroblast enucleation process is driven by vesicle trafficking.18 Chromatin condensation and microRNA have also been implicated in enucleation.19,20 More recently, Nowak et al showed that a contractile ring is unlikely to function in expelling the nucleus. Instead, the enucleosome located at the rear of the translocating nucleus is well positioned to exert forces in the direction of nuclear expulsion.16 Thus, enucleation is a complex cellular process that is incompletely understood and somewhat controversial.
The MAPK pathway contains 3 major signaling cassettes that are involved in a broad range of cellular responses.21-23 It has been reported that activation of the MAPK pathway plays diverse roles in erythropoiesis such as erythroid cell fate determination, erythroid proliferation, and erythroid differentiation.24-30 Interestingly, analysis of our RNA-sequencing data revealed that the MAPK pathway is upregulated during human terminal erythroid differentiation,31 suggesting a potentially important role for this pathway in human terminal erythroid differentiation. In the present study, we investigated the role of MAPK in enucleation using sorted human orthochromatic erythroblasts in conjunction with a specific inhibitor for MEK/ERK, p38, or JNK. Notably, we found that only the MEK/ERK pathway plays an important role in human erythroblast enucleation, and it does so by regulating vesicle formation. Our findings have uncovered a novel role of MEK/ERK pathway in human erythroblast enucleation and its underlying mechanism(s). Our findings have implications for understanding mechanisms of anemia associated with defective erythroblast enucleation.
Materials and methods
Materials
Anti–human Band 3 antibody was generated by our laboratory.32 De-identified human cord blood samples were obtained from the third Affiliated Hospital of Zhengzhou University, China. Other antibodies used in this study are listed in supplemental Table 1.
Purification and culture of CD34+ cells
CD34+ cells were purified from cord blood by positive selection using the magnetic beads, according to the manufacturer’s instructions (Miltenyi Biotec). The detailed cell culture protocols and the culture medium composition used have been previously described.32
Fluorescence-activated cell sorting of cultured cells
Erythroblasts at day 15 of in vitro culture were stained for cell surface markers of glycophorin A (GPA), band 3 and α4 integrin, and the orthochromatic erythroblasts were sorted on a MoFlo high-speed cell sorter (Beckman Coulter) as previously described.32
Western blot analysis and assay of rho-GTPase activity
Whole cells were lysed with immunoprecipitation assay buffer containing150 mM NaCl, 25 mM Tris-HCl pH 7.4, 0.1% Triton X-100, 1% deoxycholate, and 2 mM EDTA (MilliporeSigma) supplemented with protease inhibitor (MilliporeSigma) and phosphatase inhibitor (Roche) cocktails. Cell membrane and cytoplasmic protein were extracted by using a Plasma Membrane Protein Extraction Kit (BioVision). Protein concentration was measured by using a Pierce BCA Protein Assay Kit (Thermo Fisher Scientific). Western blot analysis was performed as previously described.32,33 Rho-GTPase activity assay was performed by using Active Rac1 and Rho Detection Kit (Cell Signaling Technology).
Flow cytometry analysis
The cells were cultured in the presence or absence of MAPK inhibitors at 37°C for 24 hours. Enucleation was analyzed with the nucleic acid dye Hoechst and apoptosis assessed by staining with Annexin V.34 Cells were stained with allophycocyanin (APC)-conjugated CD71 antibody for quantitating surface expression of transferrin receptor. Flow cytometry analysis was performed as previously described.32
Immunofluorescence analysis
Sorted orthochromatic erythroblasts were cultured in the presence or absence of 20 μM U0126 at 37°C for 24 hours. Cells were subsequently washed with cold phosphate-buffered saline (PBS), fixed in 4% paraformaldehyde for 15 minutes at room temperature, and permeabilized with 0.1% Triton X100 for 10 minutes at room temperature. Cells were stained at room temperature for 15 minutes with the Alexa Fluor 488 Phalloidin for visualizing actin and phycoerythrin-conjugated GPA to distinguish cell membrane and washed with PBS 3 times. To observe the localization of transferrin receptor, cells were stained with the primary CD71 antibody at room temperature for 1 hour. After washing 3 times with PBS, cells were incubated with the secondary antibody of Alexa Fluor 555–conjugated goat anti-rabbit immunoglobulin G at room temperature for 30 minutes. Hoechst (Thermo Fisher Scientific) was used to stain the nucleus. Cells were deposited onto poly-l-lysine–coated slides and observed by using a Zeiss LSM510 META confocal microscope.
Analysis of CD71 internalization in orthochromatic erythroblasts
Human orthochromatic erythroblasts were cultured in serum- and transferrin-free Iscove modified Dulbecco medium at 4°C for 6 hours in the presence or absence of 20 μM U0126. Cells were subsequently transferred to Iscove modified Dulbecco medium with serum and transferrin and cultured at 37°C for 30 minutes. Following washes with cold PBS, collected cells were subjected to flow cytometry, western blot, and immunofluorescence analysis as described earlier.
Electron microscopy
Orthochromatic erythroblasts were cultured in the presence or absence of 20 μM U0126 medium at 37°C for 24 hours and fixed with 2% glutaraldehyde and 2% paraformaldehyde in 0.1 M sodium cacodylate buffer (pH7.4) solution overnight at 4°C. The pellets were washed 3 times with 0.1 M sodium cacodylate buffer (pH 7.4), and then post-fixed in 2% osmium in 0.1 M sodium cacodylate buffer (pH 7.4) for 4 hours at 4°C. Cell pellets were washed with distilled water, dehydrated using ethanol, subsequently treated with propylene oxide, and embedded in resin mixture of Epon-Araldite (Sigma-Aldrich). The ultrathin sections were stained with uranyl acetate and lead citrate and imaged with an electron microscope (JEM 1400; JEOL USA, Inc.).
Drug treatment
U0126, SB203580, and SP600125 were purchased from Cell Signaling Technology and dissolved in dimethyl sulfoxide (DMSO). Cultures were treated at final drug concentrations of 5 μM, 10 μM, and 20 μM of U0126; 1 μM, 5 μM, and 10 μM of SB203580; and 10 μM, 20 μM, and 30 μM of SP600125, respectively. Vacuolin-1 (Santa Cruz Biotechnology) was dissolved in DMSO and added to culture media at a final concentration of 5 μM.
Estimation of vacuole and nucleus area, euchromatin/heterochromatin ratio, and nuclear polarization
ImageJ (National Institutes of Health) was used to measure the vacuole, nuclear, euchromatin, and heterochromatin areas from optical and/or electron microscopic (EM) images. For measurement of vacuole area, 100 pixels and 1 μm2 were used as benchmark for cells in optical and EM images, respectively. Cells harboring a vacuole area larger than 100 pixels or 1 μm2 were counted, and their percentage was quantitated.
Cytospin preparation
Briefly, 1 × 10⁵ cells in 200 μL were cytospun onto coated slides using the Thermo Scientific Shandon Cytospin. The slides were stained with May-Grünwald (Sigma MG500) solution for 5 minutes, rinsed in 40 mM Tris buffer (pH 7.2) for 90 seconds, and subsequently stained with Giemsa solution (Sigma GS500) for 15 minutes. The cells were imaged by using a Leica DM2000 inverted microscope.
Sample preparation for proteomic and phosphoproteomic analyses
Cells were cultured in the presence or absence of 20 μM U0126 at 37°C for 24 hours. Cell samples were sonicated 3 times on ice by using a high-intensity ultrasonic processor (Scientz) in lysis buffer (8 M urea, 1% protease inhibitor cocktail). The cell debris was removed by centrifugation at 12 000g at 4°C for 10 minutes, and protein concentration was determined with a BCA kit. For digestion of proteins, the supernatant was reduced with 5 mM dithiothreitol for 30 minutes at 56°C and alkylated with 11 mM iodoacetamide for 15 minutes at room temperature in the dark. The protein sample was subsequently diluted by addition of 100 mM triethylammonium bicarbonate (TEAB) to reach a urea concentration <2 M. Trypsin was added at a 1:50 trypsin-to-protein mass ratio for the first digestion overnight and at a 1:100 trypsin-to-protein mass ratio for the second digestion for 4 hours. After trypsin digestion, peptides were desalted by Strata X C18 SPE column (Phenomenex), vacuum dried, and reconstituted in 0.5 M triethylammonium bicarbonate, labeled with a TMT kit (Thermo Fisher).
Tryptic peptides were fractionated by using high pH reverse-phase high-performance liquid chromatography with a Thermo Betasil C18 column (5 mm particles, 10 mm internal diameter, 250 mm length). Fractionated peptides were incubated with immobilized metal ion affinity chromatography (IMAC) microspheres suspension in loading buffer (50% acetonitrile/6% trifluoroacetic acid) with extensive mixing. The IMAC microspheres with enriched phosphopeptides were collected by centrifugation, and the supernatant removed. Enriched phosphopeptides were eluted by addition of elution buffer containing 10% ammonium hydroxide to the IMAC microspheres and the supernatant containing phosphopeptides collected and lyophilized for liquid chromatography/tandem mass spectrometry (LC-MS/MS) analysis.
LC-MS/MS Analysis
The tryptic peptides were dissolved and separated by using an ultra-high-performance liquid phase system and analyzed by using MS. The resulting MS/MS data were processed by using the MaxQuant search engine and searched against the human Swiss-Prot database concatenated with reverse decoy database.
Data analysis
Statistical analysis of differences between 2 or more groups was performed by using GraphPad Prism software. P value <.05 was considered to indicate statistical significance. Principal component analysis was conducted by using R (R Foundation for Statistical Computing). Gene Ontology (GO) annotation was obtained from the UniProt-GOA database (https://www.ebi.ac.uk/GOA/). Proteins were classified into GO biological process categories. Two-tailed Fisher’s exact test was used to test the enrichment of the differentially phosphorylated proteins against all identified proteins. The GO term with an adjusted P value <.05 was considered as significant.
Results
Expression of ERK2 is dramatically upregulated in human orthochromatic erythroblasts
Bioinformatics analyses of RNA-sequencing data showed that the MAPK pathway is upregulated during human terminal erythroid differentiation.31 The MAPK pathway consists of 3 components: the MEK/ERK pathway, the p38 pathway, and the JNK pathway.21 To investigate the potential contribution of the MAPK pathway to human terminal erythroid differentiation, we examined the transcript levels of MAPK family members in human erythroblasts at different developmental stages.31 As shown in Figure 1A, of the two ERK family members, ERK1 was expressed at very low levels, whereas ERK2 was expressed at higher levels with significant upregulation in orthochromatic erythroblasts. Of the four p38 family members, only p38α was expressed in terminally differentiating erythroblasts (Figure 1B). Consistent with our RNA-sequencing findings, proteomics analyses performed by Gautier et al35 also showed that only p38α is expressed in erythroid cells at the protein level. Of the three JNK family members, JNK1 and JNK2 were expressed at low levels, and there was no expression of JNK3 (Figure 1C). Protein expression data analyzed by using western blot were consistent with RNA-sequencing analyses with ERK1/2 protein expression upregulated in late-stage erythroblasts (Figure 1D-E). Interestingly, the phosphorylation level of pERK1/2 was also increased in late-stage erythroblasts (Figure 1D,F). In contrast, both protein and phosphorylation levels of p38 remained constant during terminal erythroid differentiation (Figure 1G-I). Similarly, both protein and phosphorylation levels of JNK also remained constant during erythroid differentiation (Figure 1J-L). These results strongly suggest that the MAPK pathway, particularly the ERK1/2 pathway, could be involved in the process of human erythroblast enucleation.

Expression of MAPK family members during terminal human erythroblast differentiation. RNA-sequencing data showing expression of ERK (A), p38 (B), and JNK (C) in sorted erythroblasts cultured from cord blood CD34+ cells. Bar plot represents mean ± standard deviation of triplicate samples. (D-F) Western blot analyses of ERK1/2 and pERK1/2 in erythroblasts cultured for different days as indicated. (G-I) Western blot analyses of p38 and pp38 in erythroblasts cultured for different days as indicated. (J-L) Western blot analyses of JNK and pJNK in erythroblasts cultured for different days as indicated. Glyceraldehyde-3-phosphate dehydrogenase (GAPDH) served as the loading control. N = 3. EB, early basophilic erythroblast; FPKM, fragments per kilobase of transcript per million mapped reads; LB, late basophilic erythroblast; Ortho, orthochromatic erythroblast; Poly, polychromatic erythroblast; Pro, proerythroblast.
Expression of MAPK family members during terminal human erythroblast differentiation. RNA-sequencing data showing expression of ERK (A), p38 (B), and JNK (C) in sorted erythroblasts cultured from cord blood CD34+ cells. Bar plot represents mean ± standard deviation of triplicate samples. (D-F) Western blot analyses of ERK1/2 and pERK1/2 in erythroblasts cultured for different days as indicated. (G-I) Western blot analyses of p38 and pp38 in erythroblasts cultured for different days as indicated. (J-L) Western blot analyses of JNK and pJNK in erythroblasts cultured for different days as indicated. Glyceraldehyde-3-phosphate dehydrogenase (GAPDH) served as the loading control. N = 3. EB, early basophilic erythroblast; FPKM, fragments per kilobase of transcript per million mapped reads; LB, late basophilic erythroblast; Ortho, orthochromatic erythroblast; Poly, polychromatic erythroblast; Pro, proerythroblast.
MEK inhibitor U0126 inhibits enucleation of human orthochromatic erythroblasts
To examine the role of the MAPK pathway in human erythroblast enucleation, we treated the sorted human orthochromatic erythroblasts with the MEK/ERK inhibitor U0126,36 p38 inhibitor SB203580,37 or JNK inhibitor SP60012538 and assayed for the extent of enucleation. As expected, treatment with U0126, SB203580, and SP600125 greatly reduced the phosphorylation levels of ERK1/2, p38, and JNK, respectively, in a dose-dependent manner (Figure 2A). Interestingly, although U0126 significantly inhibited enucleation in a dose-dependent manner, SB203580 and SP600125 had little or no effect on enucleation (Figure 2B-C). At a concentration of 20 μM U0126, enucleation was inhibited by 80%. Consistent with the flow cytometry–based enucleation data, cytospin images also showed that U0126 but not SB203580 or SP600125 inhibited enucleation (Figure 2D). Treatment with these inhibitors did not induce apoptosis of the orthochromatic erythroblasts (supplemental Figure 1). These findings imply that ERK1/2 pathway (but no other component of the MAPK pathway) is primarily involved in the enucleation process of human erythroblasts.
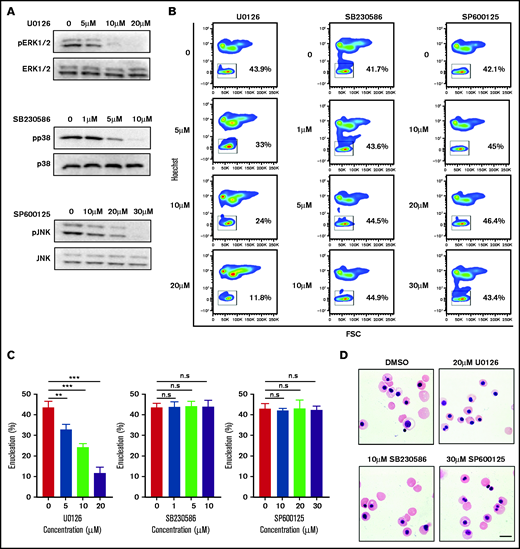
ERK inactivation inhibited enucleation. (A) Representative western blot showing changes in phosphorylation of ERK1/2, p38, and JNK in orthochromatic erythroblasts treated with specific inhibitor as indicated. N = 3. (B) Representative flow cytometry profiles showing the effects of various inhibitors on enucleation of orthochromatic erythroblasts. (C) Quantitative analyses of enucleation on orthochromatic erythroblasts. N = 3. Data are expressed as mean ± standard deviation. (D) Representative cytospin images of orthochromatic erythroblasts treated with DMSO or specific inhibitor as indicated. Scale bar, 10 μm. *P < .05, **P < .01, ***P < .001. n.s., not statistically significant.
ERK inactivation inhibited enucleation. (A) Representative western blot showing changes in phosphorylation of ERK1/2, p38, and JNK in orthochromatic erythroblasts treated with specific inhibitor as indicated. N = 3. (B) Representative flow cytometry profiles showing the effects of various inhibitors on enucleation of orthochromatic erythroblasts. (C) Quantitative analyses of enucleation on orthochromatic erythroblasts. N = 3. Data are expressed as mean ± standard deviation. (D) Representative cytospin images of orthochromatic erythroblasts treated with DMSO or specific inhibitor as indicated. Scale bar, 10 μm. *P < .05, **P < .01, ***P < .001. n.s., not statistically significant.
Inhibition of ERK1/2 activation impairs vacuole formation in human orthochromatic erythroblasts
Given the fact that vesicle trafficking and subsequent accumulation of vesicles is one of the driving forces for enucleation18,39 and that the ERK pathway has been shown to play an important role in endocytosis,40 we next examined the effects of U0126 on vesicle formation. The representative cytospin images of DMSO-treated and U0126-treated orthochromatic erythroblasts (Figure 3A) revealed the formation of cytoplasmic vacuoles in DMSO-treated cells but to a much lesser extent in U0126-treated cells. Quantitative analyses of the number of cells with vacuoles showed that while ∼55% of DMSO-treated cells contained vacuoles, <30% of U0126-treated cells contained vacuoles (Figure 3B). EM imaging was used to examine the effect of U0126 on vacuole formation. Consistent with cytospin images, EM images showed vacuole formation in the majority of DMSO-treated cells (Figure 3C; supplemental Figure 2). We found that although ∼35% of the DMSO-treated cells contained vacuoles with an area >1 μm2, only ∼15% of the U0126-treated cells contained such large-sized vacuoles (Figure 3D). Quantitative analyses revealed that the average area of vacuoles in U0126-treated cells was significantly smaller than that in DMSO-treated cells (Figure 3E). These findings imply that the ERK pathway plays an important role in vacuole formation in human orthochromatic erythroblasts.
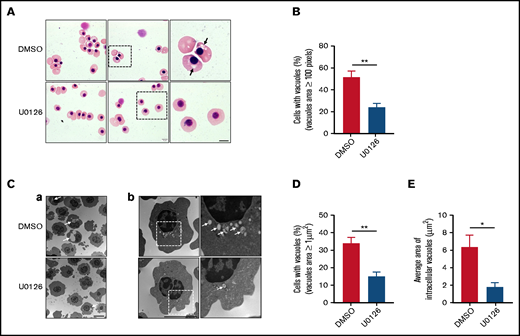
Inactivation of the ERK pathway impaired vacuole formation in human orthochromatic erythroblasts. (A) Representative cytospin images showing morphology of orthochromatic erythroblasts treated with DMSO or U0126. Black arrows indicate large vacuoles in cytoplasm. Scale bar, 5 μm. (B) Quantification of erythroblasts that harbored vacuoles with a size >100 pixels. A total of 100 cells of each group from 3 independent experiments were used for quantification. (C) Representative EM images (a and b) of orthochromatic erythroblasts treated with DMSO or U0126. White arrows indicate vacuoles. Scale bar, 5 μm. (D) Quantification of erythroblasts harboring vacuoles with a size >1 μm2. A total of 100 cells of each group from 3 independent experiments were used for the quantification. (E) Quantitative analysis of the average area of intracellular vacuoles in erythroblasts, and 100 cells of each group from 3 independent experiments were used for quantification. Data are expressed as mean ± standard deviation. *P < .05, **P < .01.
Inactivation of the ERK pathway impaired vacuole formation in human orthochromatic erythroblasts. (A) Representative cytospin images showing morphology of orthochromatic erythroblasts treated with DMSO or U0126. Black arrows indicate large vacuoles in cytoplasm. Scale bar, 5 μm. (B) Quantification of erythroblasts that harbored vacuoles with a size >100 pixels. A total of 100 cells of each group from 3 independent experiments were used for quantification. (C) Representative EM images (a and b) of orthochromatic erythroblasts treated with DMSO or U0126. White arrows indicate vacuoles. Scale bar, 5 μm. (D) Quantification of erythroblasts harboring vacuoles with a size >1 μm2. A total of 100 cells of each group from 3 independent experiments were used for the quantification. (E) Quantitative analysis of the average area of intracellular vacuoles in erythroblasts, and 100 cells of each group from 3 independent experiments were used for quantification. Data are expressed as mean ± standard deviation. *P < .05, **P < .01.
Inhibition of ERK1/2 activation inhibits clathrin-mediated endocytosis in human orthochromatic erythroblasts
Previous studies have shown that endocytic vesicle trafficking and the endosome/lysosomal secretory pathway are required for erythroblast enucleation.18 Specifically, clathrin-mediated vesicle trafficking is required for enucleation.18,41 To gain further insights into the mechanisms by which the ERK pathway inhibits enucleation, we investigated whether U0126 affects clathrin-dependent endocytosis by monitoring internalization of CD71 (transferrin receptor) that mediates the uptake of transferrin via clathrin-dependent endocytosis.42 We used flow cytometry to examine the surface expression of CD71. As shown in Figure 4A, cells treated with U0126 had increased surface expression of CD71 compared with DMSO-treated control cells due to decreased endocytosis. Quantitative analyses revealed that the surface expression of CD71 on U0126-treated cells was ∼2 times higher than that of control cells (Figure 4B). Western blot analysis was used to measure the expression of CD71 on the cell membrane and in the cytoplasm. Consistent with flow cytometry analyses, U0126 treatment led to higher levels of CD71 on the membrane in conjunction with decreased levels in the cytoplasm (Figure 4C-D). Immunofluorescence imaging was used to examine the internalization of CD71. As shown in Figure 4E, internalized CD71 was seen in the cytoplasm of the majority of DMSO-treated cells, although CD71 was predominantly membrane associated in U0126-treated cells (Figure 4F). These results imply that inactivation of the ERK pathway inhibits clathrin-dependent endocytosis that, in turn, contributes to impaired enucleation.
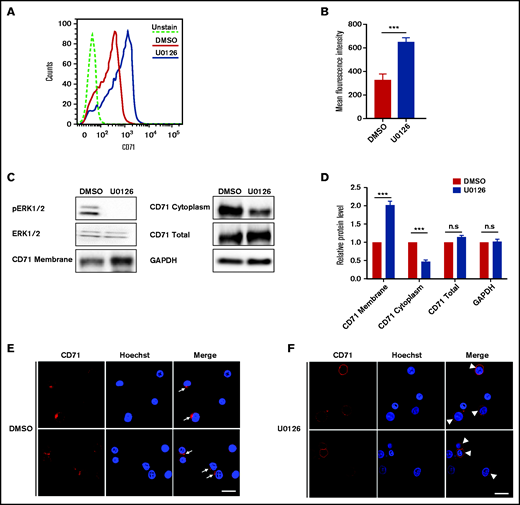
Inactivation of the ERK pathway inhibited CD71 internalization in orthochromatic erythroblasts. (A) Representative flow cytometry analysis showing the expression of CD71 on DMSO- or U0126-treated erythroblasts. (B) Quantitative analyses of CD71 surface expression from 3 independent experiments. (C) Representative western blot showing CD71 expression in plasma membrane, cytoplasm, and total cells on DMSO- or U0126-treated erythroblasts. Glyceraldehyde-3-phosphate dehydrogenase (GAPDH) served as the loading control. (D) Quantitative analyses of CD71 protein levels from 3 independent experiments. (E) Representative immunofluorescence images showing localization of CD71 in DMSO-treated erythroblasts. White arrows indicate internalization of CD71. (F) Representative immunofluorescence images showing localization of CD71 in U0126-treated erythroblasts. White arrowheads indicate CD71 on cell membrane. Scale bar, 10 μm. Data are expressed as mean ± standard deviation. ***P < .001. n.s., not statistically significant.
Inactivation of the ERK pathway inhibited CD71 internalization in orthochromatic erythroblasts. (A) Representative flow cytometry analysis showing the expression of CD71 on DMSO- or U0126-treated erythroblasts. (B) Quantitative analyses of CD71 surface expression from 3 independent experiments. (C) Representative western blot showing CD71 expression in plasma membrane, cytoplasm, and total cells on DMSO- or U0126-treated erythroblasts. Glyceraldehyde-3-phosphate dehydrogenase (GAPDH) served as the loading control. (D) Quantitative analyses of CD71 protein levels from 3 independent experiments. (E) Representative immunofluorescence images showing localization of CD71 in DMSO-treated erythroblasts. White arrows indicate internalization of CD71. (F) Representative immunofluorescence images showing localization of CD71 in U0126-treated erythroblasts. White arrowheads indicate CD71 on cell membrane. Scale bar, 10 μm. Data are expressed as mean ± standard deviation. ***P < .001. n.s., not statistically significant.
Inhibition of ERK activation did not affect chromatin condensation, nuclear polarization, or enucleosome formation in human orthochromatic erythroblasts
Erythroblast enucleation is a complex multistep process that includes chromatin condensation, nuclear polarization, and enucleosome formation.12,17,43–45 We next examined whether the ERK pathway regulates enucleation by affecting the a forementioned processes. We first examined the effect of U0126 on chromatin condensation using 2 approaches: measurement of the nuclear area in cytospin cell images and measurement of the euchromatin/heterochromatin ratio from EM images. Representative cytospin images are shown in Figure 5A, and additional cytospin images used in the calculation of the nuclei diameter are shown in supplemental Figure 3. Quantitative analyses showed that U0126 treatment had no effect on the nuclear area (Figure 5B). We also measured the euchromatin/heterochromatin ratio from EM images. Representative EM images are shown in Figure 5D. Quantitative analyses show that U0126 treatment had no effect on the euchromatin/heterochromatin ratio (Figure 5E).
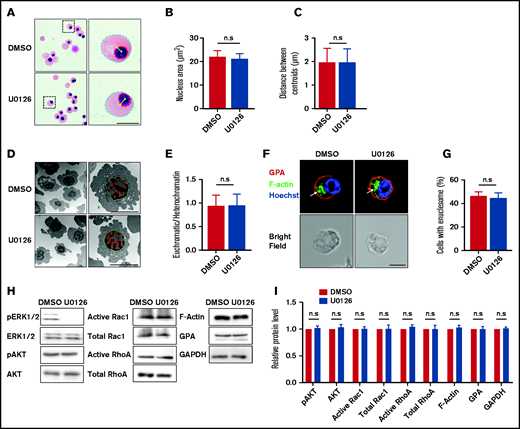
Inactivation of the ERK pathway did not affect the chromatin condensation, nuclear polarization, or enucleosome formation. (A) Representative cytospin images showing morphology of erythroblasts treated with DMSO or U0126. Blue dotted lines depict the outline of the cells, red dotted lines depict the outline of the nucleus, yellow asterisks indicate the central of the cell or nucleus, and yellow lines indicate the distance between cell and nucleus centroids. Scale bar, 5 μm. (B) Quantitative analyses of the nucleus area from cytospin images. (C) Quantitative analysis of the centroid distance between cell and nucleus. (D) Representative EM images showing morphology of the erythroblasts treated with DMSO or U0126. Green dotted lines depict outline of the nucleus, and red dotted lines depict the euchromatin. Scale bar, 5 μm. (E) Quantitative analysis of the ratio of euchromatin/heterochromatin. (F) Representative immunofluorescence images showing F-actin spot (enucleosome) in erythroblasts treated with DMSO or U0126. White arrows indicate enucleosome. Scale bar, 5 μm. (G) Quantitative analyses of the erythroblasts that contain the enucleosome. A total of 100 cells of each group from 3 independent experiments were used for quantification. (H) Representative western blot showing pAKT, AKT, active Rac1, total Rac1, active RhoA, total RhoA, F-actin, and GPA expression in orthochromatic erythroblasts treated with DMSO or U0126. Glyceraldehyde-3-phosphate dehydrogenase (GAPDH) served as the loading control. (I) Quantitative analyses of pAKT, AKT, active Rac1, total Rac1, active RhoA, total RhoA, F-actin, and GPA protein levels from 3 independent experiments. Data are expressed as mean ± standard deviation. n.s., not statistically significant.
Inactivation of the ERK pathway did not affect the chromatin condensation, nuclear polarization, or enucleosome formation. (A) Representative cytospin images showing morphology of erythroblasts treated with DMSO or U0126. Blue dotted lines depict the outline of the cells, red dotted lines depict the outline of the nucleus, yellow asterisks indicate the central of the cell or nucleus, and yellow lines indicate the distance between cell and nucleus centroids. Scale bar, 5 μm. (B) Quantitative analyses of the nucleus area from cytospin images. (C) Quantitative analysis of the centroid distance between cell and nucleus. (D) Representative EM images showing morphology of the erythroblasts treated with DMSO or U0126. Green dotted lines depict outline of the nucleus, and red dotted lines depict the euchromatin. Scale bar, 5 μm. (E) Quantitative analysis of the ratio of euchromatin/heterochromatin. (F) Representative immunofluorescence images showing F-actin spot (enucleosome) in erythroblasts treated with DMSO or U0126. White arrows indicate enucleosome. Scale bar, 5 μm. (G) Quantitative analyses of the erythroblasts that contain the enucleosome. A total of 100 cells of each group from 3 independent experiments were used for quantification. (H) Representative western blot showing pAKT, AKT, active Rac1, total Rac1, active RhoA, total RhoA, F-actin, and GPA expression in orthochromatic erythroblasts treated with DMSO or U0126. Glyceraldehyde-3-phosphate dehydrogenase (GAPDH) served as the loading control. (I) Quantitative analyses of pAKT, AKT, active Rac1, total Rac1, active RhoA, total RhoA, F-actin, and GPA protein levels from 3 independent experiments. Data are expressed as mean ± standard deviation. n.s., not statistically significant.
Another critical step required for erythroblast enucleation is nuclear polarization. As shown in Figure 5A and supplemental Figure 3, the nucleus was clearly polarized in both control and U0126-treated human orthochromatic erythroblasts (Figure 5C), implying that U0126 treatment did not affect nuclear polarization.
Finally, we used confocal microscopy to detect enucleosome, an F-actin structure at the rear of the translocating nucleus, enriched in tropomodulin 1 and nonmuscle myosin IIB.16 Figure 5F and supplemental Figure 4 present representative images of the enucleosome. Quantitative analyses showed similar frequency of formation of enucleosome in both the control and the U0126-treated group (Figure 5G). Taken together, these results imply that the ERK pathway regulated enucleation without affecting chromatin condensation, nuclear polarization, or enucleosome formation.
Consistent with the finding that U0126 treatment had no effect on nuclear polarization, treatment with U0126 treatment did not affect activity of AKT, which is required for regulation of cell polarization45 (Figure 5H-I). Similarly, treatment with U0126 did not alter protein levels or activity of Rac1 and RhoA that are required for the formation of the actin ring14 and also had no effect on protein levels of F-actin and GPA.
Impaired enucleation induced by U0126 treatment was partially rescued by vacuolin-1
Given that inhibition of ERK1/2 activation inhibits human orthochromatic erythroblast enucleation via reduced vacuole formation, we explored whether this impaired enucleation could be rescued by increasing vacuole formation. Vacuolin-1 is a small molecule that induces vacuole formation via fusion of endosomes and lysosomes.46 We treated human orthochromatic erythroblasts with U0126 in the absence or presence of vacuolin-1. ERK phosphorylation was inhibited after U0126 treatment (Figure 6A). The representative flow cytometry profiles documenting extent of enucleation are shown in Figure 6B. Although treatment with vacuolin-1 led to a very modest increase in the enucleation of control erythroblasts, it led to a statistically significant increase in enucleation of the U0126-treated cells (Figure 6C). We also quantified the extent of enucleation from cytospin images. Representative cytospin images are shown in Figure 6D. Quantitative analyses show that, consistent with the flow cytometry analyses, the enucleation of U0126-treated cells was partially rescued by vacuolin-1 (Figure 6E). Notably, the partial rescue of enucleation by vacuolin-1 was accompanied by the increased numbers and size of vacuoles (Figure 6F-H). In addition, treatment with vacuolin-1 did not affect the apoptosis of erythroblasts (supplemental Figure 5). These results lend further support to the thesis that ERK1/2 activation plays a role in enucleation by promoting vacuole formation.
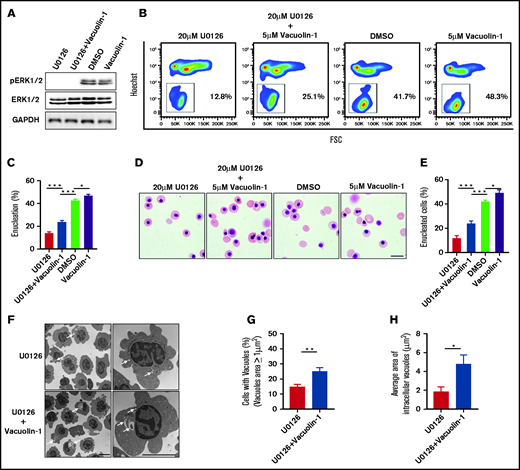
Rescue of U0126-induced enucleation impairment by vacuolin-1. (A) Representative western blot showing changes in pERK1/2 and ERK1/2 expression under various conditions as indicated. Glyceraldehyde-3-phosphate dehydrogenase (GAPDH) served as the loading control. (B) Representative flow cytometry analyses of enucleation under various conditions as indicated. (C) Quantitative analyses of enucleation from 3 independent experiments. (D) Representative cytospin images of orthochromatic erythroblasts under various conditions as indicated. Scale bar, 10 μm. (E) Quantitative analyses of enucleation from cytospin images. A total of 100 cells of each group from 3 independent experiments were used for quantification. (F) Representative EM images of orthochromatic erythroblasts under different conditions as indicated. White arrows indicate vacuoles. Scale bar, 5 μm. (G) Quantification of erythroblasts harboring vacuoles with a size >1 μm2. A total of 100 cells of each group from 3 independent experiments were used for the quantification. (H) Quantitative analysis of the average area of intracellular vacuoles in erythroblasts. A total of 100 cells of each group from 3 independent experiments were used for quantification. Data are expressed as mean ± standard deviation. *P < .05, **P < .01, ***P < .001. FSC, forward scatter.
Rescue of U0126-induced enucleation impairment by vacuolin-1. (A) Representative western blot showing changes in pERK1/2 and ERK1/2 expression under various conditions as indicated. Glyceraldehyde-3-phosphate dehydrogenase (GAPDH) served as the loading control. (B) Representative flow cytometry analyses of enucleation under various conditions as indicated. (C) Quantitative analyses of enucleation from 3 independent experiments. (D) Representative cytospin images of orthochromatic erythroblasts under various conditions as indicated. Scale bar, 10 μm. (E) Quantitative analyses of enucleation from cytospin images. A total of 100 cells of each group from 3 independent experiments were used for quantification. (F) Representative EM images of orthochromatic erythroblasts under different conditions as indicated. White arrows indicate vacuoles. Scale bar, 5 μm. (G) Quantification of erythroblasts harboring vacuoles with a size >1 μm2. A total of 100 cells of each group from 3 independent experiments were used for the quantification. (H) Quantitative analysis of the average area of intracellular vacuoles in erythroblasts. A total of 100 cells of each group from 3 independent experiments were used for quantification. Data are expressed as mean ± standard deviation. *P < .05, **P < .01, ***P < .001. FSC, forward scatter.
Phosphoproteomic analysis revealed downregulation of pathways involved in enucleation upon U0126 treatment
To further investigate the molecular mechanisms for the U0126-induced impairment in enucleation, we performed phosphoproteomic analyses on human orthochromatic erythroblasts treated with DMSO or U0126. A total of 11 175 phosphosites were identified, of which 8672 sites were associated with 3101 proteins. The information from the phosphoproteomic analysis is presented in supplemental Table 2. Principal component analysis of the phosphoproteome of biological replicates of DMSO-treated and U0126-treated cells could be clearly distinguished (Figure 7A). Ratios >1.2 or <0.83 were identified as upregulated and downregulated phosphorylated sites, respectively. There were 489 upregulated phosphorylated sites across 302 proteins and 572 downregulated phosphorylated sites across 354 proteins in U0126-treated samples compared with DMSO-treated samples (supplemental Table 3). GO enrichment analysis revealed that upregulated phosphorylated proteins were involved in regulation of cytoskeletal organization and establishment of spindle location (Figure 7B), whereas downregulated phosphorylated proteins were enriched in negative regulation of organelle organization, GTPase activity, and endocytic recycling (Figure 7C). Specifically, the phosphorylation of several proteins that play important roles in clathrin-dependent vesicle formation, including EPN1,47 EPS15,48 AAK1,49 DNM1L,50 and CLTC,51 were altered in U0126-treated erythroblasts (Figure 7D). Notably, the protein level of survivin which contributes to enucleation through an interaction with EPS15 and clathrin,52 was not affected by U0126 treatment (supplementary Fig 6). These findings imply that ERK mediates enucleation, at least in part by regulating endocytic recycling via phosphorylating molecules involved in vesicle formation.
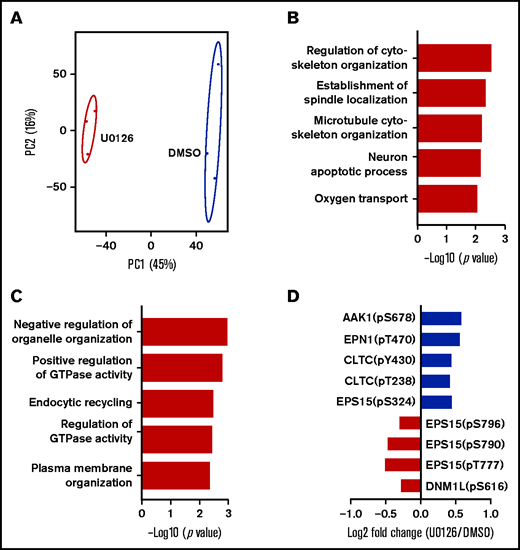
Phosphoproteomic analyses of orthochromatic erythroblasts treated with DMSO or U0126. (A) Principal component analysis of the phosphoproteomics data from human orthochromatic erythroblasts treated with DMSO or U0126. (B) Top 5 upregulated GO terms of differentially phosphorylation sites. (C) Top 5 downregulated GO terms of differentially phosphorylation sites. (D) Changes in phosphorylation of molecules involved in endocytic recycling.
Phosphoproteomic analyses of orthochromatic erythroblasts treated with DMSO or U0126. (A) Principal component analysis of the phosphoproteomics data from human orthochromatic erythroblasts treated with DMSO or U0126. (B) Top 5 upregulated GO terms of differentially phosphorylation sites. (C) Top 5 downregulated GO terms of differentially phosphorylation sites. (D) Changes in phosphorylation of molecules involved in endocytic recycling.
Discussion
MAPK pathways play important roles in a variety of biological processes, including erythropoiesis. However, previous studies were mainly focused on their role in the proliferation and differentiation of erythroid progenitors and early-stage erythroblasts.24-27,53-55 Their role in regulating enucleation remains largely undefined. This is in part due to the fact that most previous studies used a short hairpin RNA–mediated knockdown approach or knockout mouse models, systems in which erythropoiesis was perturbed at early stages before completion of terminal erythroid differentiation. These approaches have an inherent limitation in that it is difficult to associate the role of specific proteins in the enucleation process per se because the observed enucleation defects may be the consequence of inhibiting early erythroblast proliferation and differentiation. As enucleation occurs at the orthochromatic erythroblast stage, use of purified orthochromatic erythroblast populations will enable direct assessment of specific pathways on enucleation. In the present study, use of sorted human orthochromatic erythroblasts in conjunction with specific MAPK pathway inhibitors enabled us to define the role of the MAPK pathway in human erythroblast enucleation.
The rational to study the potential role of the MAPK pathway in human erythroblast enucleation is based on our RNA-sequencing analyses, which documented that the MAPK pathway is significantly upregulated during human terminal erythroid differentiation.31 A key finding of the present study is that of the 3 major MAPK pathways, only the ERK pathway plays an important role in human erythroblast enucleation. Using p38α knockout mice, a previous study showed that lack of p38α led to impaired enucleation during stress erythropoiesis by downregulating the activities of p21 and Rb.56 In contrast, we found that the p38 inhibitor did not affect the enucleation of human orthochromatic erythroblasts per se. One possible explanation for the difference is that complete lack of p38α during mouse early-stage erythropoiesis has much broader effects than inactivation of p38α only in the orthochromatic erythroblasts. Alternatively, the discrepancy could be attributed to species differences, as has been observed for other genes.15,57 It is also interesting to note that the MAPK pathway is upregulated during human but not murine terminal erythroid differentiation.31
Previous studies have shown that chromatin condensation,43 nuclear polarization,45 and enucleosome formation,16 as well as vesicle trafficking and vacuole formation, play important roles in erythroblast enucleation.18 In our efforts to investigate the mechanisms by which the ERK pathway regulates enucleation, we found that ERK inactivation selectively impaired vacuole formation by inhibiting clathrin-mediated endocytosis. Although it has been well established that vesicle trafficking/vacuole formation plays a major role in erythroblast enucleation, the mechanisms by which vesicle trafficking/vacuole formation promote enucleation are largely unknown. Our findings suggest that vesicle trafficking/vacuole formation promotes erythroblast enucleation by yet to be defined mechanism(s) rather than by affecting chromatin condensation, nuclear polarization, or enucleosome formation.
The findings from phosphoproteomics analyses documenting that ERK inhibition led to downregulation of pathways involved in endocytic recycling is consistent with our findings that ERK inhibition impaired clathrin-mediated endocytosis and vacuole formation. These results identify potential ERK targets in human erythroblasts and provide important resources for future studies.
In summary, we uncovered a previously unrecognized role for the ERK pathway in human erythroblast enucleation and its underlying mechanism(s). Our findings provide novel insights into mechanisms of human erythroblast enucleation and have implications for improved understanding of anemias associated with defective erythroblast enucleation.
Acknowledgments
This work was supported in part by grants from the National Institutes of Health (National Heart, Lung, and Blood Institute, HL140625 and HL149626; National Institute of Diabetes and Digestive and Kidney Diseases, DK032094) and grants from Natural Science Foundation of China (U1804282, 81530005, 81570099, 81770112, and 81800104).
Authorship
Contribution: C.A., Y.H., and M.L. designed experiments, performed research, analyzed the data, and drafted materials and methods; F.X., D.N., H.Z., and L.C. performed research; K.Y. analyzed the data and edited the manuscript; Z.J., L.S., and N.M. designed experiments, analyzed data, and edited the manuscript; and X.A. designed experiments, analyzed data, and wrote the manuscript.
Conflict-of-interest disclosure: The authors declare no competing financial interests.
Correspondence: Ling Sun, Department of Hematology, First Affiliated Hospital of Zhengzhou University, No.1 Jianshe East Road, Zhengzhou 450052, China; e-mail: sunling6686@126.com; Zhongxing Jiang, Department of Hematology, First Affiliated Hospital of Zhengzhou University, No.1 Jianshe East Road, Zhengzhou 450052, China; e-mail: jiangzx@zzu.edu.cn; and Xiuli An, Laboratory of Membrane Biology, New York Blood Center, 310E 67th St, New York, NY 10065; e-mail: xan@nybc.org.

