Key Points
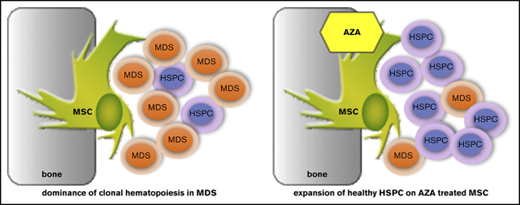
AZA treatment of MSCs in MDS leads to preferential expansion of healthy over malignant hematopoiesis.
AZA regulates key MSC genes crucial for support of hematopoiesis, providing proof of concept for epigenetic therapy of MSCs in MDS.
Abstract
Mesenchymal stromal cells (MSCs) are crucial components of the bone marrow (BM) microenvironment essential for regulating self-renewal, survival, and differentiation of hematopoietic stem/progenitor cells (HSPCs) in the stem cell niche. MSCs are functionally altered in myelodysplastic syndromes (MDS) and exhibit an altered methylome compared with MSCs from healthy controls, thus contributing to disease progression. To determine whether MSCs are amenable to epigenetic therapy and if this affects their function, we examined growth, differentiation, and HSPC-supporting capacity of ex vivo–expanded MSCs from MDS patients in comparison with age-matched healthy controls after direct treatment in vitro with the hypomethylating agent azacitidine (AZA). Strikingly, we find that AZA exerts a direct effect on healthy as well as MDS-derived MSCs such that they favor support of healthy over malignant clonal HSPC expansion in coculture experiments. RNA-sequencing analyses of MSCs identified stromal networks regulated by AZA. Notably, these comprise distinct molecular pathways crucial for HSPC support, foremost extracellular matrix molecules (including collagens) and interferon pathway components. Our study demonstrates that the hypomethylating agent AZA exerts its antileukemic activity in part through a direct effect on the HSPC-supporting BM niche and provides proof of concept for the therapeutic potential of epigenetic treatment of diseased MSCs. In addition, our comprehensive data set of AZA-sensitive gene networks represents a valuable framework to guide future development of targeted epigenetic niche therapy in myeloid malignancies such as MDS and acute myeloid leukemia.
Introduction
Myelodysplastic syndromes (MDS) are clonal hematopoietic stem/progenitor cell (HSPC) disorders characterized by ineffective hematopoiesis, peripheral cytopenias, and risk of transformation to acute myeloid leukemia (AML). Distinct acquired epigenetic and genetic mutations have been detected in MDS HSPCs and are considered disease-initiating events.1 However, accumulating evidence also implicates the bone marrow (BM) microenvironment (niche), specifically mesenchymal stromal cells (MSCs), in MDS pathogenesis and progression.2,3
MSCs are critical for regulating self-renewal, survival, and differentiation of HSPCs. MSCs communicate with HSPCs by cell-cell contact, through secreted factors and production of extracellular matrix (ECM). In addition, MSCs replenish osteoblasts as well as adipocytes in the niche and have diverse immunoregulatory functions.4
MDS MSCs are essential for propagation of human MDS HSPCs in vivo in xenograft models.3 Conversely, MDS hematopoietic cells promote acquisition of MDS-specific features in healthy MSCs, reinforcing clonal dominance of MDS cells.3,5 Patient-derived MDS MSCs exhibit distinct phenotypical abnormalities when expanded in vitro.3,5 However, no recurring genetic mutations or cytogenetic aberrations have been found in MDS MSCs, suggesting their specific MDS HSPC-supporting properties underlie epigenetic modifications. Indeed, the methylome of ex vivo–expanded MDS MSCs was found to be distinct from healthy controls.5,6 Because the epigenetic niche signature is in theory reversible, the epigenetic drug azacitidine (AZA) may also be active on MDS MSCs. AZA is primarily considered to act as a hypomethylating agent on the malignant HSPC compartment. However, other cells besides the malignant clone also randomly metabolize AZA.7 MDS patients responding to AZA show reversion of their MSC phenotype, but this may be an indirect effect on the MSC compartment due to suppression of the leukemic clone. We hypothesized that AZA may also exert a direct effect on the HSPC-supporting BM niche. Hence, we comprehensively examined growth, differentiation, and HSPC-supporting capacity of ex vivo–expanded MSCs from MDS patients in comparison with age-matched healthy controls after direct AZA treatment in vitro. In addition, we performed RNA sequencing (RNA-seq) on a homogenous HSPC-supportive MSC line treated in vitro to identify stromal networks regulated by AZA.
Materials and methods
Cell lines and reagents
EL08-1D2 stromal cells were cultured as described and used up to passage 12.8 Cytokines were purchased from R&D Systems. Chemicals were obtained from Sigma-Aldrich; media and supplements were obtained from Gibco/Life Technologies. AZA (Celgene) was freshly prepared directly before use following the manufacturer’s instructions.
BM samples
BM samples were obtained from untreated MDS patients undergoing routine clinical evaluation or from femoral heads of patients undergoing hip replacement surgery. Written informed consent in accordance with the Declaration of Helsinki was obtained from all patients according to protocols approved by the ethics committee of the Technische Universität München. Mononuclear cells (MNCs) were isolated from BM samples using Biocoll solution (Biochrom) and stored in liquid nitrogen until use.
MNCs were enriched for CD34+ cells by magnetic bead separation (Miltenyi Biotec). CD34+ cells were cultured in suspension or on stroma in serum-free medium with 5 growth factors: kit ligand, FLT3 ligand, thrombopoietin, interleukin-6, and interleukin-3.9 BM MSCs were isolated and expanded using an adapted protocol.10 MNCs were plated in Dulbecco's modified Eagle medium containing 5% fresh frozen plasma, 107 platelets per milliliter, 100 IU/mL penicillin, 100 µg/mL streptomycin, and 10 IU/mL heparin at 37°C and 5% CO2. Nonadherent cells were removed by medium change after 1 week. MSCs were expanded to confluency and passaged up to 4 times. Ex vivo–expanded MSCs were analyzed by flow cytometry to confirm adherence to minimal criteria for defining multipotent MSCs11 and were void of hematopoietic cells determined by negative staining for CD45, CD34, CD19, CD14, and HLA-DR. MSCs at 80% confluency were treated with AZA (10 µM) for 48 hours, followed by washing and addition of fresh medium.
MSC differentiation induction
MSCs were induced toward osteogenic and adipogenic lineages after plating to 80% confluency. MSCs were treated with AZA (10 µM) for 48 hours followed by washing and addition of fresh medium. AZA treatment was repeated once after 7 days. Adipogenic differentiation was induced by adding 1 µM dexamethasone, 0.5 mM isobutylmethylxanthine, 60 µM indomethacin, and 10 µM insulin. For osteogenic differentiation, 10 nM dexamethasone, 0.1 mM ascorbic acid, and, starting on day 7, 10 mM β-glycerol phosphate were added. Medium was replaced twice weekly. After 18 days, MSCs were stained using oil-red-o and Harris-hematoxylin or alizarin-red to visualize adipogenic or osteogenic differentiation, respectively. Images were captured using an Olympus CKX41 microscope (Olympus) at ×10 magnification fitted with an AxioCam Icc1 camera (Zeiss).
Flow cytometry
Cell death was determined by staining cells with allophycocyanin–Annexin V (BD Biosciences) and propidium iodide (PI) in 10 mM N-2-hydroxyethylpiperazine-N′-2-ethanesulfonic acid (HEPES), 140 mM NaCl, 1.62 mM CaCl2. For flow cytometric analyses of surface markers, cells were suspended in phosphate-buffered saline containing 5% bovine serum albumin and stained with fluorescence-coupled antibodies: CD105–fluorescein isothiocyanate (FITC) (N1-3A1; Ancell Corporation), CD73-phycoerythrin (PE) (AD2; BD Biosciences), CD90-PE (5E10; BD Biosciences), CD271-FITC (ME20.4-1.H4, Miltenyi Biotec). For intracellular staining, cells were prepared using a fixation/permeabilization kit (BD Biosciences) and stained with anti-transforming growth factor β1 (TGF-β1)–PE or anti-TGF-β receptor–PE (BD Biosciences). Frequencies of positive populations were calculated with respect to isotype controls: PE mouse immunoglobulin G (IgG) (G18-145; BD Biosciences) or FITC mouse IgG1, κ isotype (clone MOPC-21; BD Biosciences). Acquisition was performed on a CyAn ADP Lx P8 (Beckman Coulter). Data were analyzed with FlowJo software (FlowJo, LLC).
Clonogenic assays
CD34+ HSPCs were cultured in suspension or on stromal layers for 4 days. HSPCs were harvested and directly plated in growth factor–supplemented methylcellulose (Miltenyi Biotec) to assess colony-forming units (CFUs). Colonies were scored after 14 days at 37°C, 5% CO2 in a humidified atmosphere.
RNA-seq
Details on RNA-seq and data analyses are described in supplemental Methods.
RT-PCR
RNA was extracted from MSCs using the RNeasy Mini kit (Qiagen). Complementary DNA was synthesized using the RT2 First Strand kit (Qiagen) with universal primers. Relative target quantity was determined using the comparative cycle threshold (∆∆CT) method. Real-time polymerase chain reaction (RT-PCR) was performed using Power SYBR Green PCR Master Mix (Life Technologies) and target-specific primers (supplemental Table 6) on a StepOne Plus Cycler (Applied Biosystems). Amplicons were normalized to endogenous RPLP0 control.
Statistical analysis
Statistical analyses were performed by 2-sided paired or the unpaired Student t test or 1-way analysis of variance followed by Tukey multiple comparisons using GraphPad Prism (Graph Pad Inc). Results are shown as mean ± standard error of the mean (SEM). P values are presented where a statistically significant difference was found: *P < .05; **P < .01; ***P < .001, ****P < .0001.
Results
Treatment of stromal cells with AZA differentially affects healthy vs myelodysplastic hematopoiesis
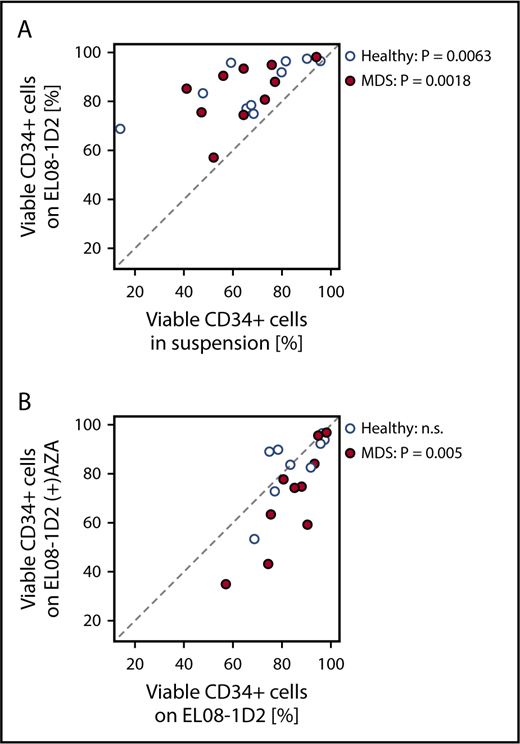
To test our hypothesis that the BM niche is amenable to epigenetic therapy, we used a well-established BM niche model: the mesenchymal murine cell line EL08-1D2, which maintains normal and malignant HSPCs.8,9,12,13 Primary CD34+ cells from MDS BM samples or healthy controls were cultured in the presence or absence of EL08-1D2 stromal cells (Figure 1A). A standardized 4-day culture period in serum-free medium with well-defined cytokines conducive to cell division and maintenance of HSPCs was chosen to exclude variables other than stroma affecting HSPC viability.9 Viability of healthy as well as MDS HSPCs was significantly improved through contact with EL08-1D2 cells (Figure 1A). This is in line with our previously published results showing EL08-1D2 cells to model the stem cell niche in vitro9,13 and reiterates the dependency of MDS HSPCs on their microenvironment.14-16
Effects of AZA treatment on stromal support of healthy and MDS HSPCs. (A) Primary healthy or MDS CD34+ cells were cultured in serum-free medium in suspension or on EL08-1D2 stromal cells. After 4 days, CD34+ cells were harvested and viability was assessed by Annexin V/PI flow cytometry. (B) Primary healthy or MDS CD34+ cells were cultured on untreated EL08-1D2 stroma or on stroma treated with 10 µM AZA for 48 hours. After 4 days, CD34+ cells were harvested and viability was assessed by Annexin V/PI flow cytometry. Shown is the percentage of viable (Annexin V−/PI−) CD34+ cells for each culture condition; each circle represents 1 individual sample (healthy samples, n = 10; MDS samples, n = 10). n.s., not significant.
Effects of AZA treatment on stromal support of healthy and MDS HSPCs. (A) Primary healthy or MDS CD34+ cells were cultured in serum-free medium in suspension or on EL08-1D2 stromal cells. After 4 days, CD34+ cells were harvested and viability was assessed by Annexin V/PI flow cytometry. (B) Primary healthy or MDS CD34+ cells were cultured on untreated EL08-1D2 stroma or on stroma treated with 10 µM AZA for 48 hours. After 4 days, CD34+ cells were harvested and viability was assessed by Annexin V/PI flow cytometry. Shown is the percentage of viable (Annexin V−/PI−) CD34+ cells for each culture condition; each circle represents 1 individual sample (healthy samples, n = 10; MDS samples, n = 10). n.s., not significant.
In vitro AZA treatment conditions for EL08-1D2 cells were established and a dose of 10 µM AZA was determined (supplemental Figure 1). EL08-1D2 cells were treated with AZA for 48 hours followed by washing. Subsequent coculture with CD34+ HSPCs for 4 days revealed a significant decrease in HSPC support for MDS progenitors on AZA-treated compared with untreated EL08-1D2 stromal cells that was not discernable for healthy HSPCs (Figure 1B), suggesting that AZA induces alterations in stromal cells with differential consequences for MDS vs healthy hematopoiesis.
AZA treatment of primary MSCs does not alter their viability, morphology, or immunophenotype
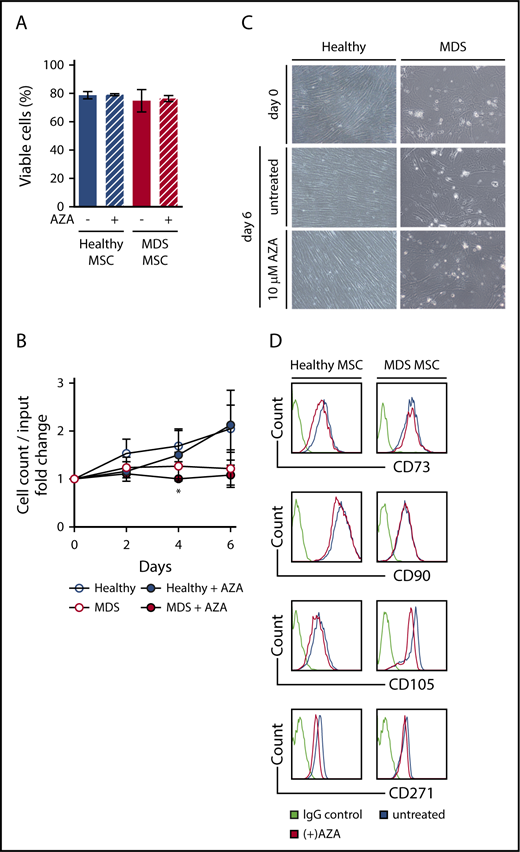
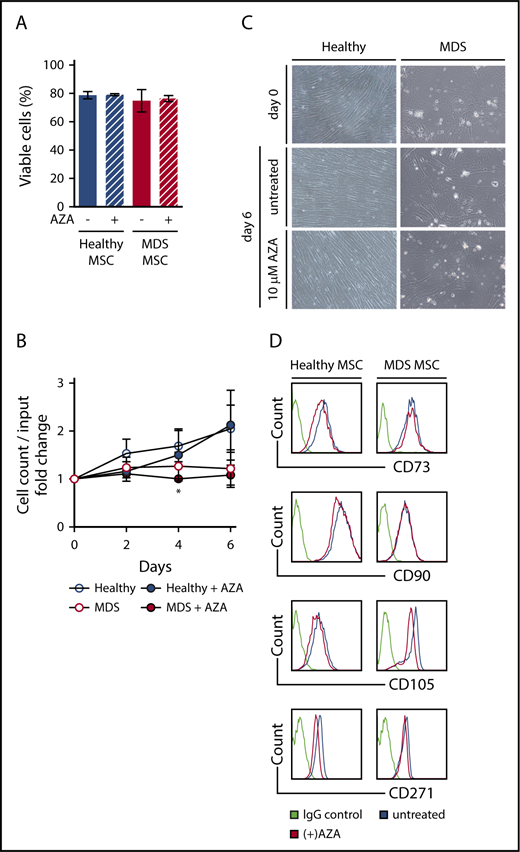
Next, we established in vitro cultures of primary MSCs from MDS BM samples, including samples categorized as MDS progressed to secondary AML (Table 1) as well as from age-matched healthy controls (supplemental Table 1) and exposed these to AZA at our previously determined dose. Viability was not affected in either healthy or MDS MSCs after AZA treatment (Figure 2A). In line with an earlier report,5 MDS MSCs showed a tendency to reduced proliferation compared with healthy MSCs (not significant). Proliferation of MDS MSCs was reduced by AZA treatment compared with untreated MDS MSCs only on day 4 (Figure 2B), whereas proliferation of healthy MSCs was unaffected. Similarly, morphology of MSCs was not altered by AZA treatment, with clear persisting differences discernible between healthy and MDS MSCs (Figure 2C). Although healthy MSCs exhibited characteristic monomorphic fibroblastoid appearance and orderly growth, MDS MSCs appeared variable in size and showed disorganized growth. Finally, AZA treatment did not affect expression of MSC-defining markers CD73, CD90, CD105, or CD271 (Figure 2D).11 Taken together, AZA treatment does not change cellular characteristics of healthy or MDS MSCs in vitro.
AZA treatment of primary MSCs does not alter their viability, morphology, or immunophenotype. Healthy and MDS MSCs were grown to 80% confluency and treated once on day 0 with 10 µM AZA. After 48 hours, stromal layers were washed and fresh medium was added. Untreated MSCs were used as controls. (A) MSC viability was assessed by flow cytometry using Annexin V/PI on day 6. Shown are mean frequencies ± SEM of Annexin V−/PI− cells measured in triplicate for n = 3 healthy and n = 4 MDS MSCs. (B) Cell counts of MSCs were determined by trypan-blue staining at indicated time points. Values represent mean ± SEM of n = 3 healthy and n = 4 MDS MSC cell counts normalized to the cell count before treatment on day 0. (*P = .045 for MDS MSC AZA vs untreated on day 4, all other n.s.) (C) Representative light microscopy images showing MSC morphology at indicated conditions (magnification ×10). (D) Expression of MSC-defining markers was assessed by flow cytometry on day 6.
AZA treatment of primary MSCs does not alter their viability, morphology, or immunophenotype. Healthy and MDS MSCs were grown to 80% confluency and treated once on day 0 with 10 µM AZA. After 48 hours, stromal layers were washed and fresh medium was added. Untreated MSCs were used as controls. (A) MSC viability was assessed by flow cytometry using Annexin V/PI on day 6. Shown are mean frequencies ± SEM of Annexin V−/PI− cells measured in triplicate for n = 3 healthy and n = 4 MDS MSCs. (B) Cell counts of MSCs were determined by trypan-blue staining at indicated time points. Values represent mean ± SEM of n = 3 healthy and n = 4 MDS MSC cell counts normalized to the cell count before treatment on day 0. (*P = .045 for MDS MSC AZA vs untreated on day 4, all other n.s.) (C) Representative light microscopy images showing MSC morphology at indicated conditions (magnification ×10). (D) Expression of MSC-defining markers was assessed by flow cytometry on day 6.
Healthy hematopoiesis is significantly boosted by AZA treatment of healthy MSCs
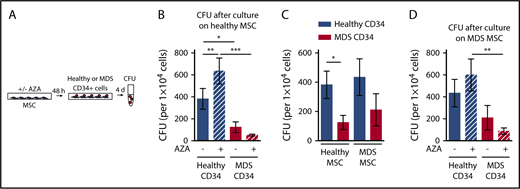
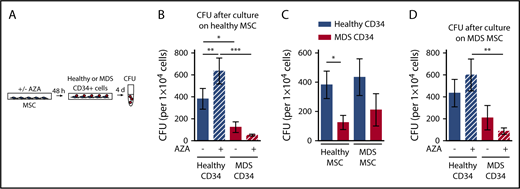
Next, we evaluated whether AZA treatment of healthy MSCs has differential consequences for support of healthy or malignant HSPCs. MDS or healthy HSPCs were cultured on healthy MSCs, either untreated or treated with AZA, followed by assessment of clonogenic capacity (Figure 3A). For MDS HSPCs, we aimed to choose samples for which information on genetic mutations was available. Variant allele frequencies (VAFs) ranged from 17% to 50% (mean, 43.8%; Table 1). This ensured a clonal CD34+ population, representing a clean system to assay malignant HSPCs. Furthermore, colony genotyping performed on 5 selected MDS HSPC samples with high VAF (nos. 31, 32, 33, 34, 38) confirmed that all colonies contained MDS-defining mutations and thus belonged to the dominant MDS clone (supplemental Figure 2). In line with previous reports, MDS HSPCs were significantly less able to form colonies than healthy HSPCs after culture on healthy MSCs (Figure 3B).3,5 Strikingly, treatment of healthy MSCs with AZA further increased this difference by significantly boosting the clonogenic capacity of healthy but not MDS HSPCs (Figure 3B). In contrast, the colony-forming capacity of MDS HSPCs was further reduced by AZA treatment of MSCs. Proliferation of healthy HSPCs was enhanced on AZA-treated MSCs even in coculture with MDS HSPCs (supplemental Figure 3). Thus, we can recapitulate our results from EL08-1D2 cells showing that AZA treatment of primary healthy donor-derived MSCs favors support of healthy over malignant HSPCs.
AZA treatment of healthy as well as MDS MSCs favors support of healthy HSPCs. (A) Experimental design. Healthy MSCs or MDS MSCs were treated once with 10 µM AZA for 48 hours. MSC layers were washed and healthy or MDS CD34+ HSPCs were added. After 4 days, CD34+ HSPCs were harvested and progenitor cell activity was assessed by short-term CFU assays. (B) Mean CFU frequencies ± SEM (n = 11 healthy CD34+ cells; n = 12 MDS CD34+ cells; n = 7 healthy MSCs layers). (C) Mean CFU frequencies ± SEM of n = 11 healthy CD34+ cells and n = 12 MDS CD34+ cells after culture on n = 7 healthy MSCs were compared with mean CFU frequencies ± SEM of n = 9 healthy CD34+ cells and n = 11 MDS CD34+ cells after culture on n = 6 MDS MSCs. (D) Mean CFU frequencies ± SEM (n = 9 healthy CD34+ cells /n = 6 MDS MSC layers; n = 11 MDS CD34+ cells /n = 6 MDS MSC layers). *P < .05; **P < .01; ***P < .001.
AZA treatment of healthy as well as MDS MSCs favors support of healthy HSPCs. (A) Experimental design. Healthy MSCs or MDS MSCs were treated once with 10 µM AZA for 48 hours. MSC layers were washed and healthy or MDS CD34+ HSPCs were added. After 4 days, CD34+ HSPCs were harvested and progenitor cell activity was assessed by short-term CFU assays. (B) Mean CFU frequencies ± SEM (n = 11 healthy CD34+ cells; n = 12 MDS CD34+ cells; n = 7 healthy MSCs layers). (C) Mean CFU frequencies ± SEM of n = 11 healthy CD34+ cells and n = 12 MDS CD34+ cells after culture on n = 7 healthy MSCs were compared with mean CFU frequencies ± SEM of n = 9 healthy CD34+ cells and n = 11 MDS CD34+ cells after culture on n = 6 MDS MSCs. (D) Mean CFU frequencies ± SEM (n = 9 healthy CD34+ cells /n = 6 MDS MSC layers; n = 11 MDS CD34+ cells /n = 6 MDS MSC layers). *P < .05; **P < .01; ***P < .001.
MDS MSCs are amenable to epigenetic therapy
Previous reports found decreased support of healthy progenitors on MDS MSCs, which we could not observe (Figure 3C).5 In our hands, the clonogenic capacity of healthy HSPCs did not differ significantly on either MDS or healthy MSCs (Figure 3C). However, the significant growth difference between MDS and healthy HSPCs seen after culture on healthy MSCs was less pronounced on MDS MSCs. Having observed a favorable impact on healthy HSPC support by treatment of both EL08-1D2 and primary healthy MSCs, we asked whether AZA would have a similar effect in the diseased setting (Figure 3D). Indeed, we found that AZA treatment of MDS MSCs also favored support of healthy over MDS HSPCs. The colony-forming capacity of healthy HSPCs increased on AZA -treated MDS MSCs whereas that of MDS HSPCs decreased, rendering the difference significant (Figure 3D). We conclude that epigenetic treatment of MSCs is feasible and can be further developed and exploited for MDS therapy. Specifically, AZA treatment of MSCs, both healthy and MDS-derived, shifts their supportive capacity toward healthy HSPCs.
AZA treatment cannot revert the impaired differentiation potential of MDS MSCs
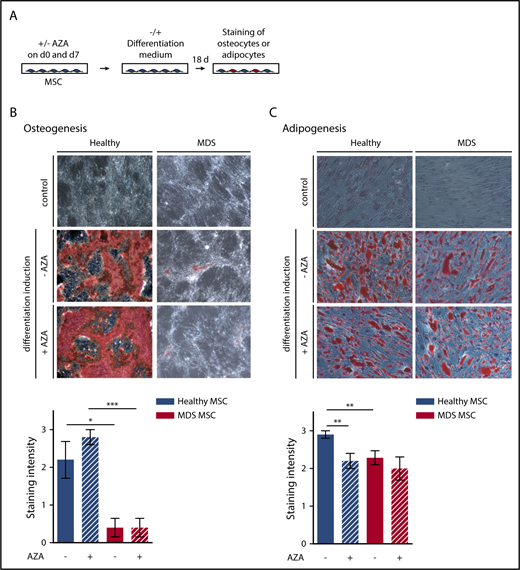
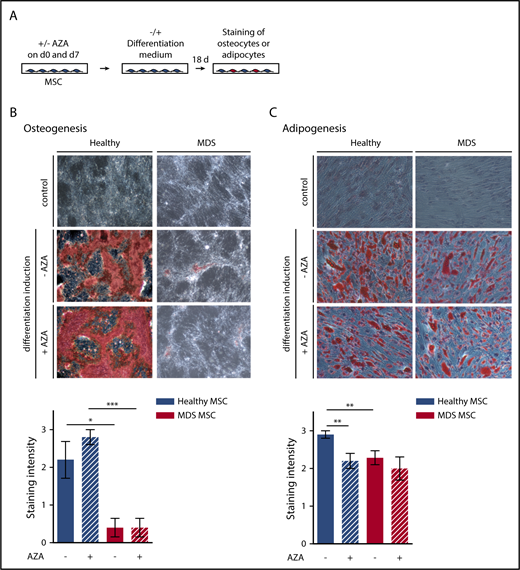
As the effect of AZA on MSCs is likely to occur through epigenetic reprogramming, we assessed whether AZA treatment restores differentiation of MDS MSCs (Figure 4A). MDS MSCs showed fundamentally impaired osteogenic differentiation (Figure 4B), as observed by others,5 which was not affected by AZA. Adipogenic differentiation of MDS MSCs was also decreased compared with healthy MSCs (Figure 4C). AZA treatment significantly decreased adipogenic differentiation of healthy but not MDS MSCs. Together with our findings from immunophenotyping and morphologic analysis, this demonstrates that AZA treatment in vitro cannot revert the diseased phenotype of MDS MSCs.
Osteogenic and adipogenic differentiation of MSCs is modulated by AZA in healthy MSCs. (A) Experimental design. Healthy and MDS MSCs were treated with 10 µM AZA on days 0 and 7. Untreated MSCs were used as controls. MSCs were differentiated for 18 days and oil-red-o staining plus Harris-hematoxylin or alizarin-red staining were used to quantify adipogenesis (C) or osteogenesis (B), respectively. Differentiation was ranked according to absent (=0), weak (=1), moderate (=2), or intense (=3) staining. (B-C) Representative images (top panel) and statistical summary (bottom panel) for (B) mean osteogenic potential of n = 5 healthy and n = 5 MDS MSCs ± SEM and (C) mean adipogenic potential of n = 10 healthy and n = 7 MDS MSCs ± SEM. *P < .05; **P < .01; ***P < .001.
Osteogenic and adipogenic differentiation of MSCs is modulated by AZA in healthy MSCs. (A) Experimental design. Healthy and MDS MSCs were treated with 10 µM AZA on days 0 and 7. Untreated MSCs were used as controls. MSCs were differentiated for 18 days and oil-red-o staining plus Harris-hematoxylin or alizarin-red staining were used to quantify adipogenesis (C) or osteogenesis (B), respectively. Differentiation was ranked according to absent (=0), weak (=1), moderate (=2), or intense (=3) staining. (B-C) Representative images (top panel) and statistical summary (bottom panel) for (B) mean osteogenic potential of n = 5 healthy and n = 5 MDS MSCs ± SEM and (C) mean adipogenic potential of n = 10 healthy and n = 7 MDS MSCs ± SEM. *P < .05; **P < .01; ***P < .001.
AZA targets stromal pathways with diverse biological function
To consider DNA as well as RNA-dependent AZA-induced transcriptional changes, we performed RNA-seq on EL08-1D2 cells cultured with or without AZA to gain a comprehensive overview of affected genes and functional networks within the stromal microenvironment. We chose EL08-1D2 cells in lieu of primary MSC samples as they constitute a homogenous cell line allowing sample consistency and eliminating potential interpatient variation, generating a robust data set.
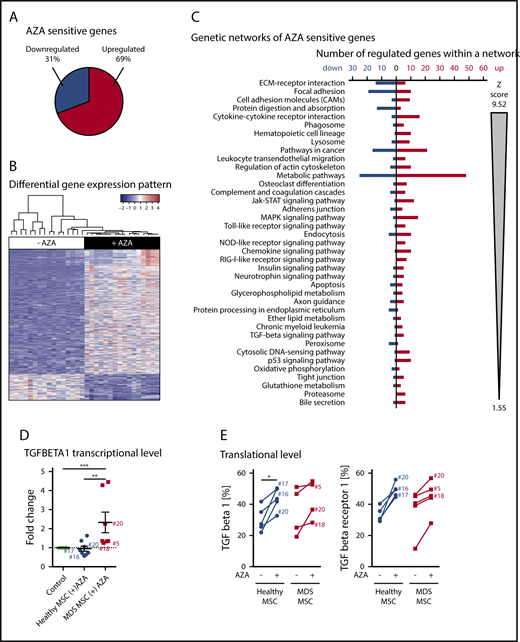
A total of 1183 genes were significantly differentially expressed between untreated (−AZA) and AZA-treated (+AZA) cohorts (“AZA-sensitive genes,” listed in supplemental Table 2). The majority of genes were upregulated (69%; 821 genes) whereas approximately one-third were downregulated (31%; 362 genes) in response to AZA (Figure 5A). The distinct gene-expression pattern became apparent by hierarchical clustering of the 500 most differentially expressed genes between untreated and AZA-treated samples (Figure 5B). Gene-ontology (GO) enrichment analysis revealed a striking number of immunoactive genes upregulated under AZA treatment, whereas other regulated genes most significantly related to ECM and cell-adhesion molecules (CAMs; supplemental Table 3). To provide more detailed information on stromal pathways regulated by AZA, we performed Kyoto Encyclopedia of Genes and Genomes (KEGG)-based fixed network enrichment analysis (FNEA). Significantly overrepresented AZA-sensitive genes affiliated with several biological pathways (Figure 5C; supplemental Table 4). When ranked by significance, the 3 top-listed pathways were ECM receptor interaction, CAM, and focal adhesion (Figure 5C). These pathways are intrinsically tied to each other and regulate cellular functions such as growth, differentiation, migration, and intercellular communication. Further significant gene sets, that is, cytokine-cytokine receptor interaction, complement cascades, Toll-like receptor signaling, chemokine signaling, and retinoic acid–inducible gene 1 protein (RIG-I)-like receptor signaling pathways, demonstrate an (anti-)inflammatory or immunomodulatory effect of AZA on stroma. Of note, many TGF-β signaling genes were significantly upregulated in EL08-1D2 cells in response to AZA (Figure 5C; supplemental Table 4). Because TGF-β is epigenetically regulated and plays a role in regulation of stromal cell function and HSPC support in various diseases including MDS,17-21 we selected TGF-β as a gene of interest for further expression analysis in our primary MSC samples. To this end, we analyzed 8 healthy and 7 MDS MSC samples by RT-PCR. Of these, 3 of the same healthy and 3 MDS MSC samples were also available for analysis of TGF-β and TGF-β receptor protein expression by flow cytometry. AZA-induced transcriptional upregulation of TGF-β corresponded to translational upregulation of TGF-β and TGF-β receptor protein in these samples (Figure 5D-E). Thus, our RT-PCR and flow cytometry data for AZA-induced modulation of TGF-β on primary MSCs confirm the results of our RNA-seq studies on EL08-1D2 cells. However, given the counterintuitive results in comparison with data showing upregulation of TGF-β signaling in MDS,19,21 these data are not conclusive as evidence for the enhanced HSPC-supportive effect we observed for MSCs after AZA treatment.
AZA treatment induces a distinct gene-expression pattern in stromal cells. (A-C) RNA-seq analysis of EL08-1D2 cells after 4 days of culture with or without 10 µM AZA added once on day 0. (A) The term “AZA-sensitive genes” comprises all genes that were differentially expressed between AZA-treated and untreated samples according to DESeq2 analysis. The pie diagram shows the percentage of upregulated vs downregulated differentially expressed genes in the AZA-treated cohort compared with untreated cells. (B) Hierarchical clustering and gene-expression heat map across the 500 most differentially expressed genes between untreated and AZA-treated samples. Values are plotted relative to the average of untreated samples. (C) Overrepresentation of significantly differentially expressed genes in KEGG pathways and GO categories were tested by FNEA implemented in the neaGUI R package.40 Entries are ordered first according to false discovery rate (FDR) and second according to the absolute number of the z score. (D-E) Primary healthy and MDS MSCs were treated with AZA once or left untreated and analyzed after 4 days. (D) TGF-β1 expression was validated by comparative RT-PCR in primary MSCs. Results are shown as fold change compared with untreated control. (E) Protein expression of TGF-β1 and TGF-β receptor 1 as assessed by flow cytometry in healthy or MDS MSCs (−/+) AZA. Sample numbers (corresponding to Table 1) of samples analyzed both by RT-PCR in panel D as well as flow cytometry in panel E are indicated. *P < .05; **P < .01; ***P < .001.
AZA treatment induces a distinct gene-expression pattern in stromal cells. (A-C) RNA-seq analysis of EL08-1D2 cells after 4 days of culture with or without 10 µM AZA added once on day 0. (A) The term “AZA-sensitive genes” comprises all genes that were differentially expressed between AZA-treated and untreated samples according to DESeq2 analysis. The pie diagram shows the percentage of upregulated vs downregulated differentially expressed genes in the AZA-treated cohort compared with untreated cells. (B) Hierarchical clustering and gene-expression heat map across the 500 most differentially expressed genes between untreated and AZA-treated samples. Values are plotted relative to the average of untreated samples. (C) Overrepresentation of significantly differentially expressed genes in KEGG pathways and GO categories were tested by FNEA implemented in the neaGUI R package.40 Entries are ordered first according to false discovery rate (FDR) and second according to the absolute number of the z score. (D-E) Primary healthy and MDS MSCs were treated with AZA once or left untreated and analyzed after 4 days. (D) TGF-β1 expression was validated by comparative RT-PCR in primary MSCs. Results are shown as fold change compared with untreated control. (E) Protein expression of TGF-β1 and TGF-β receptor 1 as assessed by flow cytometry in healthy or MDS MSCs (−/+) AZA. Sample numbers (corresponding to Table 1) of samples analyzed both by RT-PCR in panel D as well as flow cytometry in panel E are indicated. *P < .05; **P < .01; ***P < .001.
AZA-regulated molecular pathways are essential for HSPC support
To look further into how increased support of healthy HSPCs is mediated by AZA treatment of MSCs, we used a published RNA-seq data set of genes identified as essential to healthy HSPC support in various stromal cell lines, including EL08-1D2 cells.12 Using this data set as reference set for critical regulators within the stromal microenvironment, we performed gene-set enrichment analysis. Indeed, we find that these crucial HSPC-support genes are strongly enriched among our AZA-sensitive genes (Figure 6A; supplemental Table 5). To unravel correlation patterns among these HSPC-support genes, we performed weighted gene coexpression analysis.12 We identified 3 distinct coexpression modules, that is, HSPC-supportive genes following a similar expression pattern in EL08-1D2 cells (designated blue, brown, and turquoise modules). Genes of each module enriched for distinct biological pathways: blue module for interferon (IFN) signaling, brown for ECM receptor interaction, and turquoise for WNT- and platelet-derived growth factor (PDGF)-signaling pathways (supplemental Figures 4-9). Of note, only the blue (IFN) and brown (ECM) modules significantly correlated with AZA treatment (Figure 6B).
Integrative analysis reveals AZA-sensitive genes crucial to stromal HSPC support. (A) Gene set enrichment analysis of our RNA-seq data showing significant upregulation of stromal HSPC-supportive genes (published reference gene set13 ) in AZA-treated EL08-1D2 cells. (B) We identified 4 distinct gene coexpression modules where each module was given an arbitrary color (blue, IFN-signaling pathway; brown, ECM receptor interaction; and turquoise, WNT- and PDGF-signaling pathways). Both the blue and the brown modules significantly correlated with AZA treatment (Pearson correlation, P = 2.1e-09 [blue] and 3.4e-08 [brown], respectively) and contained significantly more genes that were significantly regulated by AZA compared with untreated controls (Fisher's exact test, P = 4.22e-10 [blue] and 0.0184 [brown]). ***P < .001. (C) Detailed network of the ECM receptor interaction (brown) module showing significantly enriched biological pathways and their genes. Colors indicate log2-fold change in gene expression in AZA-treated samples vs untreated controls. Hub genes are shown in bold letters. (D) Venn diagram of meta-analysis showing overlap of 21 genes (in red) between AZA-sensitive downregulated EL08-1D2 genes (green) and upregulated genes in MDS MSCs in comparison with healthy controls (blue). The 7 identified collagen genes are listed at the bottom of the panel. NES, normalized enrichment score.
Integrative analysis reveals AZA-sensitive genes crucial to stromal HSPC support. (A) Gene set enrichment analysis of our RNA-seq data showing significant upregulation of stromal HSPC-supportive genes (published reference gene set13 ) in AZA-treated EL08-1D2 cells. (B) We identified 4 distinct gene coexpression modules where each module was given an arbitrary color (blue, IFN-signaling pathway; brown, ECM receptor interaction; and turquoise, WNT- and PDGF-signaling pathways). Both the blue and the brown modules significantly correlated with AZA treatment (Pearson correlation, P = 2.1e-09 [blue] and 3.4e-08 [brown], respectively) and contained significantly more genes that were significantly regulated by AZA compared with untreated controls (Fisher's exact test, P = 4.22e-10 [blue] and 0.0184 [brown]). ***P < .001. (C) Detailed network of the ECM receptor interaction (brown) module showing significantly enriched biological pathways and their genes. Colors indicate log2-fold change in gene expression in AZA-treated samples vs untreated controls. Hub genes are shown in bold letters. (D) Venn diagram of meta-analysis showing overlap of 21 genes (in red) between AZA-sensitive downregulated EL08-1D2 genes (green) and upregulated genes in MDS MSCs in comparison with healthy controls (blue). The 7 identified collagen genes are listed at the bottom of the panel. NES, normalized enrichment score.
For each module, we visualized gene relationships and expression of significantly enriched pathways in EL08-1D2 cells treated with AZA. Furthermore, we defined the 10 most interconnected genes, so-called hub genes for each module. The brown module (ECM receptor interaction; Figure 6C) contains 10 hub genes, all of which were significantly regulated by AZA. All 11 hub genes in the blue module (IFN signaling; supplemental Figure 9) were also significantly regulated in AZA-treated samples. In contrast, none of the 22 hub genes within the turquoise module (WNT and PDGF signaling; supplemental Figure 8) were significantly differentially expressed between AZA-treated and untreated samples.
Finally, to discriminate AZA-regulated genes most relevant to MDS, we compared our list of AZA-sensitive EL08-1D2 genes to 2 available published RNA-seq data sets derived from primary untreated MDS MSCs in comparison with healthy controls.3,22 The majority of AZA-sensitive genes did not differ between MDS and healthy MSCs (supplemental Figure 10), which is in line with our functional results. Again, using GO analysis, we found ECM and CAM molecules to be most overrepresented among the MDS-specific AZA-sensitive genes (supplemental Figure 10). Specifically, we found 21 genes upregulated in MDS MSCs compared with healthy MSCs that were downregulated in EL08-1D2 cells after AZA treatment (Figure 6D). Of these, 7 (33%) are independent loci, which encode for collagens.
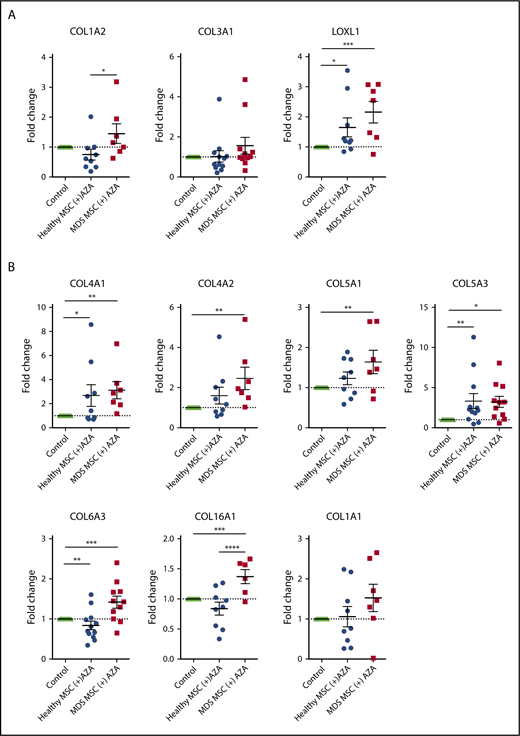
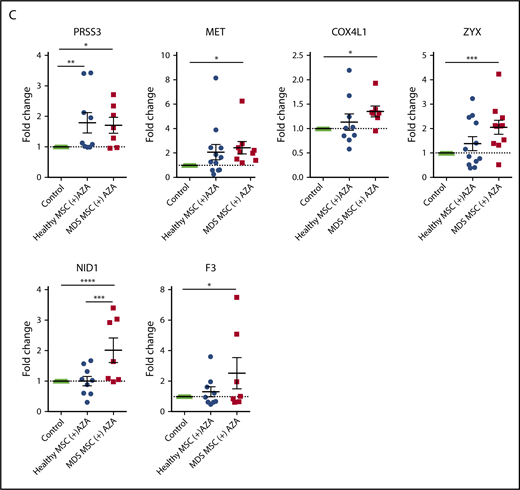
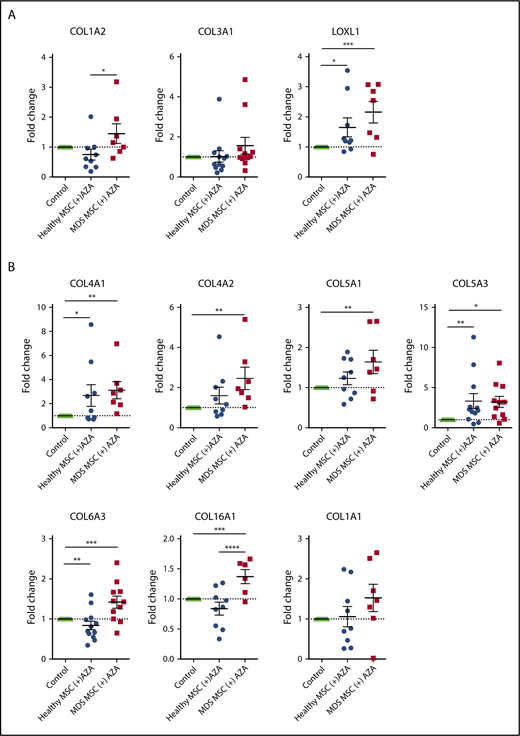
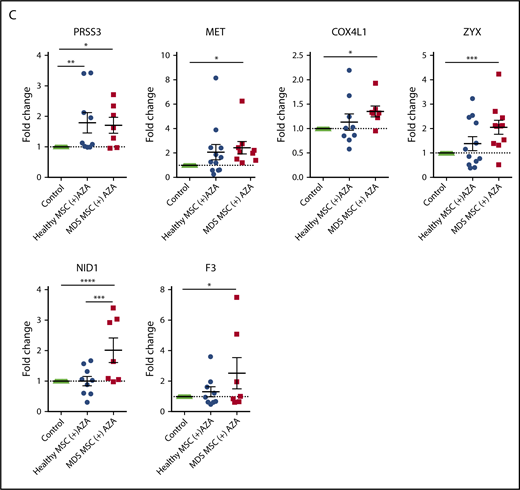
To validate our bioinformatic results, we performed RT-PCR on a total of 23 selected genes. These included 20 AZA-sensitive MDS-specific genes (Figure 6D) and 3 hub genes from the brown module (ECM receptor interaction; Figure 6C) in primary MSCs treated with AZA in comparison with untreated MSC controls. Indeed, 13 of 23 tested targets were significantly regulated following AZA treatment in MDS MSCs but were less responsive in healthy MSCs (Figure 7A-C). Two genes, PRSS3 and COL5A3, showed a higher mean AZA-induced transcriptional fold-change in healthy compared with MDS MSCs (Figure 7B-C). Nine of 23 genes were not significantly differentially expressed between MDS and healthy MSCs according to RT-PCR analysis (Figure 7A-B; supplemental Figure 11), which could be due to a decreased sensitivity of RT-PCR in comparison with RNA-seq.
Transcriptional regulation of HSPC-supportive stromal genes in primary MSCs treated with AZA. Primary healthy and MDS MSCs were treated with AZA (10 µM) once or left untreated. After 4 days, MSCs were harvested and expression of selected stromal HSPC-supportive genes was validated by comparative RT-PCR. (A) Selected hub genes of the brown module (ECM receptor interaction, from Figure 6C). (B) Seven collagens differentially expressed between untreated healthy and MDS MSCs (from Figure 6D). (C) Other stromal HSPC-supportive genes differentially expressed between untreated healthy and MDS MSCs (from Figure 6D, in red). *P < .05; **P < .01; ***P < .001; ****P < .0001.
Transcriptional regulation of HSPC-supportive stromal genes in primary MSCs treated with AZA. Primary healthy and MDS MSCs were treated with AZA (10 µM) once or left untreated. After 4 days, MSCs were harvested and expression of selected stromal HSPC-supportive genes was validated by comparative RT-PCR. (A) Selected hub genes of the brown module (ECM receptor interaction, from Figure 6C). (B) Seven collagens differentially expressed between untreated healthy and MDS MSCs (from Figure 6D). (C) Other stromal HSPC-supportive genes differentially expressed between untreated healthy and MDS MSCs (from Figure 6D, in red). *P < .05; **P < .01; ***P < .001; ****P < .0001.
In total, our integrative analysis demonstrates that distinct transcriptional networks associated with stromal HSPC support (ie, IFN signaling and ECM receptor interaction pathways) are modulated by AZA. We identify hub genes in ECM receptor interaction and IFN-signaling pathways that may play a key role in AZA-induced stromal support of healthy hematopoiesis. In addition, our meta-analysis demonstrates that the majority of AZA-sensitive stromal HSPC-support genes do not differ between healthy and MDS MSCs.
Discussion
Increasing evidence in myeloid neoplasms suggests that malignant HSPCs and their progeny remodel the BM microenvironment to their advantage.3,6,23,24 The fact that no recurrent somatic mutations have been found in patient-derived MSCs argues that malignant stromal alterations are of epigenetic nature.25 Only recently, it was shown that ex vivo–expanded MSCs from MDS patients exhibit not only an altered phenotype6,26 but also an aberrant methylation signature that is reverted in patients responding to AZA.6 However, this has been attributed mainly to suppression of the malignant hematopoietic clone and subsequent loss of signaling cues to the niche. Direct effects of AZA on the niche are less clear. By examining MDS MSCs in comparison with age-matched healthy controls directly treated with AZA in vitro, we complement these studies further and provide proof of concept that diseased stroma of myeloid neoplasms can be therapeutically targeted using epigenetic drugs such as AZA.
Most importantly, our RNA-seq data clearly show that AZA directly regulates stromal genes crucial to HSPC support, providing an explanation for the enhanced clonogenic capacity of healthy HSPCs we observed in our coculture experiments. In contrast, MDS HSPCs are less responsive to stromal cues after AZA treatment. Bhagat et al have shown that epigenetic treatment of MDS stroma can enhance erythropoiesis from healthy HSPCs.6 However, in our hands, the effects of AZA in this regard are not specific to MDS stroma but can also be induced in healthy MSCs as well as in murine stromal cells. Accordingly, we could not observe a differential effect of AZA on MDS MSCs compared with healthy MSCs in phenotypical assays. Although we cannot rule out that longer in vitro treatment may produce different results, our findings argue against the presumption that AZA entirely reprograms disease-associated cellular phenotypes.
Our RNA-seq data demonstrate that AZA directly modulates diverse genetic networks of stromal biology. Interestingly, we find that AZA elevates TGF-β signaling in EL08-1D2 cells as well as primary MSCs. Intrinsic and extrinsic TGF-β signaling has versatile and context-dependent consequences for healthy and malignant stroma cell biology.17,21,27 In turn, stroma-derived TGF-β plays a role in regulation of healthy and malignant HSPCs.19,28 Our results are in apparent contrast to previous data showing downregulation of TGF-β RNA in MSCs from MDS patients after several courses of AZA therapy, which may be an indirect effect of AZA or possibly due to longer drug exposure than in our setup.26
Among the most strongly AZA-regulated HSPC support networks we identified, the IFN-signaling pathway (blue module; supplemental Figure 8) stands out as it has been described before as an AZA-regulated pathway in solid tumors, confirming the validity of our RNA-seq data set.29,30 Of note, the IFN pathway is involved in activation of healthy HSPCs and promoting their expansion.31 In addition, induction of inflammatory and immune-response pathways by AZA may facilitate immune modulation by MSCs in the leukemic niche.29,30,32 Accordingly, our FNEA analyses demonstrated upregulation of TGF-β and RIG-I in AZA-treated stromal cells. The second significantly regulated HSPC support network (ECM receptor interaction, brown module; Figure 6) is composed, in large part, of collagens, important components of the ECM.33,34 The ECM is a dynamic compartment that displays both direct and indirect signaling properties and represents an important part of the stem cell niche. As such, ECM molecules act directly on HSC by binding receptors mediating cell anchorage and regulating intracellular signaling as well as indirectly through noncanonical growth factor presentation.35 Within the stem cell niche, collagen types I, IV, and VI as well as fibronectin and tenascin-C, are the main ECM components produced by MSCs that have previously been identified.35-37 Accordingly, we find that collagen types IV and VI are regulated by AZA in primary MSCs.
The turquoise module (WNT/PDGF-signaling pathways; supplemental Figure 9) was not significantly regulated by AZA in our data set. This is in apparent contrast to findings from Bhagat et al, which identified FRZB, a component of the WNT-signaling pathway, by methylome analysis as a specifically deregulated gene in MDS MSCs that was demethylated after AZA treatment.6 However, although single genes may be aberrantly silenced in MDS MSCs and subsequently reinduced upon AZA treatment, it appears from our data that the mechanism by which AZA exerts its activity on MSCs is more complex. In our hands, epigenetic manipulation of stroma enhances healthy hematopoiesis independently of MDS and thus argues for antileukemic effects beyond reactivation of aberrantly silenced genes.
In early stages of MDS, hematopoiesis is not completely clonal and healthy HSCs are still present. In later stages, clonal MDS hematopoiesis dominates (as attested by high VAF) and it is an open question of whether healthy HSPCs still remain in significant numbers in the niche. This would argue that the favorable effects of epigenetic modulation on the niche can be best exploited in the early stages of MDS where a predominant effect on healthy hematopoiesis is still attainable. Sequential BM sampling has shown that overall clonal structure in MDS is unchanged by AZA treatment.38,39 However, in responding patients, AZA has been shown to promote expansion of HSPCs with a lower mutational burden, thus changing their clonal contribution to functional hematopoiesis.39 These data fit with our observation of preferential support of healthy over MDS HSPCs on AZA-treated MSCs.
In sum, our study demonstrates that the epigenetic agent AZA exerts a direct effect on the HSPC-supporting BM niche and provides proof of concept for epigenetic treatment of MSCs. Our RNA-seq data set provides a valuable framework for further evaluation of stromal gene networks influenced by AZA, which could aid in developing more effective niche-based targeted therapies for MDS.
The raw and processed RNA-sequencing data reported in this article have been deposited in the Gene Expression Omnibus database (accession number GSE112461).
The full-text version of this article contains a data supplement.
Acknowledgments
The authors thank Rouzanna Istvanffy for helpful suggestions, Martin Nolde for supplying femoral heads, and Andreas Trumpp and Marc Raaijmakers for sharing their RNA-seq data.
This work was supported by research grants from the Deutsche Forschungsgemeinschaft (SFB1243 projects A09 [K.S.G. and R.A.J.O.], A01 [H.L.], A04 [F.B.], and A06 [K.H.M.] as well as FOR2033 [K.S.G. and R.A.J.O.]) and the Deutsche Jose Carreras Leukämie Stiftung (R14/16 and R14/18) (K.S.G. and M.B.). This work received support from the German Cancer Consortium.
Authorship
Contribution: C.W. and A.-K.G. designed and performed experiments, analyzed data, and drafted the manuscript; S.G., R.M., and M.B. performed bioinformatic analyses and drafted the manuscript; C.H., D.W., C.P., M.K., and J.H. processed patient samples and performed cell culture; M.W. and C.B.M. generated RNA libraries and performed RNA-seq; J.N. and K.H.M. performed CFU genotyping; C.M.-T. performed BM biopsies and gathered MDS sample data; R.A.J.O. contributed EL08-1D2 cells; H.L., F.B., K.H.M., R.A.J.O., and M.B. gave conceptual advice and drafted the manuscript; K.S.G. designed experiments, analyzed data, and wrote the manuscript; and all authors read and agreed to the final version of the manuscript.
Conflict-of-interest disclosure: K.S.G. has received honoraria from Celgene. F.B. and K.H.M. have received research support and honoraria from Celgene. The remaining authors declare no competing financial interests.
Correspondence: Katharina S. Götze, Department of Medicine III, Technische Universität München, Ismaninger Str 15, D-81675 Munich, Germany; e-mail: katharina.goetze@tum.de.
References
Author notes
C.W. and A.-K.G. contributed equally to this work.


![Figure 6. Integrative analysis reveals AZA-sensitive genes crucial to stromal HSPC support. (A) Gene set enrichment analysis of our RNA-seq data showing significant upregulation of stromal HSPC-supportive genes (published reference gene set13) in AZA-treated EL08-1D2 cells. (B) We identified 4 distinct gene coexpression modules where each module was given an arbitrary color (blue, IFN-signaling pathway; brown, ECM receptor interaction; and turquoise, WNT- and PDGF-signaling pathways). Both the blue and the brown modules significantly correlated with AZA treatment (Pearson correlation, P = 2.1e-09 [blue] and 3.4e-08 [brown], respectively) and contained significantly more genes that were significantly regulated by AZA compared with untreated controls (Fisher's exact test, P = 4.22e-10 [blue] and 0.0184 [brown]). ***P < .001. (C) Detailed network of the ECM receptor interaction (brown) module showing significantly enriched biological pathways and their genes. Colors indicate log2-fold change in gene expression in AZA-treated samples vs untreated controls. Hub genes are shown in bold letters. (D) Venn diagram of meta-analysis showing overlap of 21 genes (in red) between AZA-sensitive downregulated EL08-1D2 genes (green) and upregulated genes in MDS MSCs in comparison with healthy controls (blue). The 7 identified collagen genes are listed at the bottom of the panel. NES, normalized enrichment score.](https://ash.silverchair-cdn.com/ash/content_public/journal/bloodadvances/2/23/10.1182_bloodadvances.2018022053/8/m_advances022053f6.png?Expires=1768047118&Signature=HQf1MeHGZBRtTNa3vLyETnNuPwzo~rj9fdLO~rA0F3ifz7ioeZw7feJDk7Cezf0On7eTm3IJsHYcB3bW6WavVaDM-bPetW1Y3jbFIyFcNmvOabHlYT4R7updjQnyD3AbFGUcGoBddm5pK25Mmxrv2OfPLJxuB4ce-7XazighDGJsut1FNAZXxIs85a8ZkyfmFnXR0Y6F5B50L6KYcPB4cHvH2tZyJD~pvbUw-dn6uM1~O14ppLaED~SGzn0sGA00wD8H2K6sVZXA1FHdqtM7K5a1R3q34gzE6SQXtLfeluBkZ-VWuI7lz~MC0ijs22JaZO1OnACpPZnRaN0YUfoVZQ__&Key-Pair-Id=APKAIE5G5CRDK6RD3PGA)


![Figure 6. Integrative analysis reveals AZA-sensitive genes crucial to stromal HSPC support. (A) Gene set enrichment analysis of our RNA-seq data showing significant upregulation of stromal HSPC-supportive genes (published reference gene set13) in AZA-treated EL08-1D2 cells. (B) We identified 4 distinct gene coexpression modules where each module was given an arbitrary color (blue, IFN-signaling pathway; brown, ECM receptor interaction; and turquoise, WNT- and PDGF-signaling pathways). Both the blue and the brown modules significantly correlated with AZA treatment (Pearson correlation, P = 2.1e-09 [blue] and 3.4e-08 [brown], respectively) and contained significantly more genes that were significantly regulated by AZA compared with untreated controls (Fisher's exact test, P = 4.22e-10 [blue] and 0.0184 [brown]). ***P < .001. (C) Detailed network of the ECM receptor interaction (brown) module showing significantly enriched biological pathways and their genes. Colors indicate log2-fold change in gene expression in AZA-treated samples vs untreated controls. Hub genes are shown in bold letters. (D) Venn diagram of meta-analysis showing overlap of 21 genes (in red) between AZA-sensitive downregulated EL08-1D2 genes (green) and upregulated genes in MDS MSCs in comparison with healthy controls (blue). The 7 identified collagen genes are listed at the bottom of the panel. NES, normalized enrichment score.](https://ash.silverchair-cdn.com/ash/content_public/journal/bloodadvances/2/23/10.1182_bloodadvances.2018022053/8/m_advances022053f6.png?Expires=1768169969&Signature=hhhJopxi-tQLdddnZo7Bn482VQKNXesgpHrFmy7lo2BhZ883XfpHWqInHK0S0t5~TmrPBOevWgdMvyY8r8prvx3pHyCBYNIwy6PQTRe1ZBNRbScFTOuWXDBF5BCHGZyghPNqXt1LNdmR8nA7DQ9vZaHlKUeo3D9Zqr5B2V96n~--9tNhEwoy2IgE23eYArqZOD5ARzT-QE6d5BLVGsmz-C0cpiSWuQXpbm2TzGra5ezIsKsBig8jHxwwwI4UasGhZH73W6wfk~gff92Ncvyfp4phYucDoE0rg3pGkRQWLqYVJQLsZHZVzxj3~Q5dcqr4eAizMeoNDDLqQaNPWd4FCQ__&Key-Pair-Id=APKAIE5G5CRDK6RD3PGA)
