

The t(11;14)(q13;q32) results in up-regulation of cyclin D1 and is the most common translocation detected in multiple myeloma, where it is also associated with a lymphoplasmacytic morphology. We performed an interphase fluorescent in situ hybridization (FISH) study to determine the clinical and biologic significance of the abnormality when testing a large cohort of myeloma patients. Bone marrow slides from multiple myeloma patients entered into the Eastern Cooperative Oncology Group phase III clinical trial E9486 and associated laboratory correlative study E9487 were analyzed using interphase FISH combined with immune-fluorescent (cytoplasmic immunoglobulin–FISH) detection of clonal plasma cells. We used FISH probes that hybridize to the 14q32 and 11q13 chromosomal loci. The t(11;14)(q13;q32) was correlated with known biologic and prognostic factors. Of 336 evaluable patients, 53 (16%) had abnormal FISH patterns compatible with the t(11;14)(q13;q32). These patients appeared to be more likely to have a serum monoclonal protein of less than 10 g/L (1 g/dL) (28% vs 15%, P = .029) and a lower plasma cell labeling index (P = .09). More strikingly, patients were less likely to be hyperdiploid by DNA content analysis (n = 251, 14% vs 62%, P < .001). Patients with the t(11;14)(q13;q32) appeared to have better survival and response to treatment, although this did not reach statistical significance. Multiple myeloma with the t(11;14)(q13;q32) is a unique subset of patients, not only characterized by cyclin D1 up-regulation and a lymphoplasmacytic morphology, but is also more frequently associated with small serum monoclonal proteins and is much less likely to be hyperdiploid. These patients do not have a worsened prognosis as previously thought.
Introduction
Translocations involving chromosome 14 at band q32, the immunoglobulin heavy chain (IgH) locus, are thought to be important and initiating events for a large proportion of plasma cell dyscrasias, because they have been detected in almost all human myeloma cell lines studied.1-7 Accordingly, many multiple myeloma patients have IgH translocations, of which the t(11;14)(q13;q32) is the most common.8 This translocation is detectable in 5% of multiple myeloma patients by conventional cytogenetic analysis9-11 and in 15% to 20% of multiple myeloma patients by interphase fluorescent in situ hybridization (FISH).12 Because this translocation has been documented at the earliest stage of the plasma cell dyscrasias, monoclonal gammopathy of undetermined significance (MGUS), it is likely an early cytogenetic event.13 14
IgH translocations in multiple myeloma are thought to originate from errors during physiologic DNA recombination, mostly at the time of isotype class switching in terminally differentiated B cells.1-7 Most of these translocations result in breakpoints at the 5′ end of the switch-μ region in the der14 chromosome while the breakpoint located in the der partner is usually located in the 3′-switch region of one of the constant region genes. However, IgH translocations in multiple myeloma involving chromosome 11q13 also have 14q32 breakpoints in the IgH joining (JH) region.1,2,4 5 Thus, these are postulated to occur earlier than those occurring during isotype class switching and presumptively due to errors of somatic hypermutation.
The t(11;14)(q13;q32) results in up-regulation of cyclin D1,1 the overexpression of which theoretically favors cell cycle progression, as seen in mantle cell lymphoma.15In about 25% of human multiple myeloma cell lines cyclin D1messenger RNA is overexpressed as detected by Northern blot, and the corresponding protein is detected by immunoprecipitation.1-7 Only human myeloma cell lines with t(11;14)(q13;q32) have cyclin D1 up-regulation, with the exception of U266, where a process of excision and insertion juxtaposes IgH enhancers next to cyclin D1 at 11q13.16Thus, in the human myeloma cell lines there is an obligate relationship between cyclin D1 up-regulation and the t(11;14)(q13;q32). It has been recently reported that the t(11;14)(q13;q32) can also dysregulate other putative oncogenes such as myeov.17Up-regulation of cyclin D1 is also detectable in multiple myeloma patients by immunohistochemistry in approximately 20% to 30%,18-20 by Northern Blot in 17%,21 and by reverse transcriptase–polymerase chain reaction in 35%.22
The presence of the t(11;14)(q13;q32) and/or other 11q abnormalities in multiple myeloma patients has been associated with a worsened outcome and clinical features suggestive of aggressiveness when detected by karyotype analysis23,24 and interphase FISH.12Biologic and pathologic features, including lymphoplasmacytic morphology and increased numbers of circulating plasma cells, have been suggested to be associated with the presence of this translocation.11,19 25 However, most studies are limited by smaller numbers of patients analyzed and detection of the t(11;14(q13;q32) through karyotype analysis. There is as yet no published systematic evaluation of a large group of patients of the prognostic significance of the t(11;14)(q13;q32). Therefore, we conducted a thorough cytoplasmic immunoglobulin (cIg)–FISH analysis of genetic studies in a large cohort of multiple myeloma patients entered on Eastern Cooperative Oncology Group trials who also have prolonged follow-up information and known clinical outcomes. The goal of our investigation is to characterize myeloma and the t(11;14)(q13;q32), validating the unique clinical, prognostic, and biologic features of this subgroup of patients and the clonal plasma cell forming their disease.
Patients, materials, and methods
Patient demographics
The E9486 phase III clinical trial and its correlative laboratory study E9487 were opened to accrual in February 1988 and closed in May 1992. All patients had newly diagnosed multiple myeloma. The clinical trial is described in detail elsewhere.26Briefly, the clinical trial was a randomized phase III study aimed at comparing standard combination chemotherapy with vincristine, carmustine, melphalan, cyclophosphamide, and prednisone (VBMCP), versus VBMCP and interferon-α2, versus VBMCP and high-dose cyclophosphamide as treatment intensification. The total number of patients enrolled was 653, with patient follow-up continuing until the time of death. The major end point of this study was overall survival to be measured from the date of randomization, and secondary end points included response rate, duration of response, and toxicity. Patients had all relevant biologic and prognostic factors tested. The median survival for all patients was 40.5 months, with a 5-year survival rate of 29%. The median follow-up for survivors is now 108 months (range 86-127 months). A total of 351 unselected patients were included in this study (Table1). These patients did not appear to differ in clinical demographics from the larger cohort (n = 561) of patients entered into the E9487 study (data not shown). No patient had primary plasma cell leukemia. Conventional cytogenetic analysis results are not available, because they were not required at the time of study entry. DNA ploidy analysis was performed on the light chain–restricted cells as previously published by us.27 We used the following cutoff values for ploidy determination: hyperploidy, more than 1.05 DNA index; (pseudo) diploid, DNA index 0.95 to 1.05; and hypodiploid, DNA index less than 0.95.27
Clinical and laboratory features of patients
| All* (n = 351) | t(11;14)(q13;q32) (n = 53) | Other (n = 283) | |
|---|---|---|---|
| Median age, y (range) | 62.6 (34-84) | 62.2 (34-79) | 62.6 (34-84) |
| Descriptive features, % | |||
| Gender, male, female | 62.1, 37.9 | 67.9, 32.1 | 60.8, 39.2 |
| ECOG performance status 0-1, 2-4 | 86.3, 13.7 | 90.6, 9.4 | 85.9, 14.1 |
| Plasmacytoma present | 10.0 | 5.7 | 11.4 |
| Weight loss, more than 10% | 7.2 | 7.5 | 7.6 |
| Hypercalcemia, serum calcium more than 12 mg/dL | 24.5 | 23.1 | 24.6 |
| Serum monoclonal protein† | 82.9 | 71.7 | 84.8 |
| Urine monoclonal protein† | 74.2 | 69.2 | 75.6 |
| Bone disease | 79.1 | 81.0 | 78.4 |
| X-ray lytic lesions‡ | 79.4 | 78.6 | 78.8 |
| Light chain1-153 | |||
| κ | 64.8 | 60.5 | 66.5 |
| λ | 35.2 | 39.5 | 33.5 |
| Median laboratory values (range) | |||
| Hemoglobin, g/dL | 10.7 (5.1-15.8) | 10.5 (6.2-15.4) | 10.7 (5.1-15.8) |
| Leukocytes, × 106/mL | 5.8 (1.6-56.0) | 6.2 (2.5-12.1) | 5.8 (1.6-56) |
| Peripheral blood plasma cells, % | 0 (0-93) | 0 (0-10) | 0 (0-93) |
| Bone marrow plasma cells by flow, % | 0.25 (0.01-0.86) | 0.29 (0.02-0.86) | 0.24 (0.01-0.80) |
| Platelets, × 106/mL | 233 (40-637) | 237 (85-535) | 233 (40-637) |
| Bone marrow plasma cells, % | 43 (2-99) | 50 (8-96) | 44 (2-99) |
| Creatinine, mg/dL | 1.2 (0.4-4.9) | 1.3 (0.5-4.7) | 1.2 (0.4-4.9) |
| Calcium, mg/dL | 9.5 (4.5-15.8) | 9.4 (4.5-15.6) | 9.5 (7.1-15.8) |
| Albumin, g/L | 3.5 (1.1-5.4) | 3.6 (2-5.2) | 3.5 (1.1-5.4) |
| Bilirubin, mg/dL | 0.4 (0.1-1.4) | 0.4 (0.1-1.4) | 0.4 (0.1-1.2) |
| CD4+ cells, % of PBL | 25 (0-73) | 29 (0-73) | 25 (0-68) |
| CD19+ cells, % of PBL | 13 (0-79) | 10 (0-72) | 14 (0-79) |
| C-reactive protein, mg/dL | 0.3 (0.1-20.3) | 0.4 (0.1-5.6) | 0.3 (0.1-20.3) |
| sIL-6R, ng/mL | 187 (50-1067) | 157 (65-800) | 187 (50-80) |
Differences between patients with and without the translocation were not statistically significant with the exception of those related to the serum monoclonal protein level (see text).
ECOG indicates Eastern Cooperative Oncology Group; PBL, peripheral blood lymphocytes; sIL-6R, soluble interleukin-6 receptor level.
Includes patients with failed FISH assay.
For the serum monoclonal protein this meant a concentration greater than 10 g/L, and for the urinary protein this meant a urinary protein concentration greater than 0.2 g/24 h.
If x-ray bone abnormalities were present.
If serum monoclonal protein component was present.
Bone marrow samples
Bone marrow research samples were obtained at the time of study enrollment under informed consent. Enrichment for mononuclear cells was performed using the Ficoll-gradient centrifugation method. Cytospin slides were made and immediately stored at −70°C for future use. We used cIg-FISH using light chain–specific immunofluorescent detection of the clonal plasma cell (κ or λ according to the light chain of the clone).28
Probes
For the detection of the t(11;14)(q13;q32) we used a fusion strategy employing 2 sets of probes—one that hybridizes to 14q32 and one for 11q13. For the 14q32 site (IgH) we used a pool of probes that hybridizes to the 14q32 locus: a BAC clone that localizes to the constant region of the IgH locus, which recognizes α1 and α2; a cosmid clone that hybridizes to the most distal segment of the IgH variable region (kindly provided by Michael Kuehl, National Cancer Institute)16; and the cosmid clones cos 3/64, U2-2, and Cos Ig6 (kindly provided by Martin Dyer, Royal Marsden Hospital). All IgH clones were directly labeled in Spectrum Green (Vysis, Downers Grove, IL). For the 11q13 region we used a pool of cosmid and P1 clones (700 kilobases [kb]) spanning approximately 100 kb telomeric and 600 kb centromeric to thecyclin D1 gene (all directly labeled in Spectrum Red, Vysis).17,29,30 The 11q13 pool of probes contained the cosmids cCL11-505, cCL11-44, and cCL11-356 obtained from the Japanese Collection of Research Bioresources (JCRB) (kindly provided by Katsuyuki Hashimoto from the National Institute of Infectious Diseases at Tokyo), cosmids cos3.62 and cos3.91 (kindly provided by Ed Schuuring at Leiden University), and the P1 clones ICRF 700 B1587 and ICRF 700 J077 obtained from a human P1 library at the Resource Center Primary Database (RZPD; Heidelberg, Germany) (kindly provided by Radka Kochan). These probes are well known to bracket all 11q13 translocation breakpoints in human multiple myeloma cell lines.17
Each set of probes was validated using separate hybridization experiments on normal metaphases and interphase cells and in abnormal clinical samples with a t(11;14)(q13;q32) (Figure1) and as previously described by us.31 In addition, we studied 21 patients with a karyotypically detectable t(11;14)(q13;q32) and found that our probes always detected the abnormality. A normal interphase FISH pattern was 2 pairs of red and green signals and no fusion (2R2G). An abnormal pattern indicative of a t(11;14)(q13;q32) was one or more fusion signals resulting from touching green and red signals or a yellow signal resulting from merging of green and red signals (≥ 1F, ≥ 1R, ≥ 1G) (Figure 1). These same patients were previously tested for deletions of 13q14 by cIg-FISH and D13S319 and LSI13 Rb probes.32

Patterns of FISH probes used in this study.
(A,B) The correct localization of the pool of probes to chromosomes 11 and 14, respectively. (C) A plasma cell without evidence of a t(11;14)(q13;q32). There are 2 pairs of discrete red and green signals and no fusion signals. The plasma cells can be easily distinguished by the intense blue fluorescence of the cytoplasm. (D) An abnormal plasma cell with 2 fusion signals resulting from the comigration of probes and indicative of a t(11;14)(q13;q32). (E) Another abnormal cell (Leica DMRXA). Original magnification, × 63. DAPI counterstain in panels A and B. cIg-FISH on panels C-E.
Scoring
To establish a normal range for abnormalities we studied both 1000 myeloid cells and polyclonal plasma cells from normal bone marrow donors.31 We estimated an upper limit of normal of bone marrow cells with fusion signals as the mean + 3 SDs. In both cases the mean + 3 SDs produced less than 6% of cells with fusion signals. We intended to count 100 plasma cells in each patient (median 87.2, range 21-100). We thus considered a patient sample as having the t(11;14)(q13;q32) when the percentage of abnormal plasma cells exceeded the mean + 3 SDs in number of abnormal plasma cells as compared with controls. Because all patients with this translocation had more than 50% of clonal plasma cells with the abnormality, this cutoff did not prove to be critical for the analysis.
Statistical analysis
To characterize patients in the study we used descriptive statistics. For continuous variables the Wilcoxon rank sum test33 was used to test for differences between patients with the t(11;14)(q13;q32) versus other patients. Fisher exact test34 was used to test differences among levels of categoric variables between patients with the t(11;14)(q13;q32) versus other patients. The distributions for overall survival and progression-free survival were estimated using the method of Kaplan and Meier.35 The log-rank test was used to test for differences in survival between groups.36 Median overall survival and median progression-free survival times were obtained from the estimated survival curves, and 95% confidence intervals for these estimated times were based on the sign test.37
Results
Patients
Of 351 patients studied, 336 were evaluable (4% failure rate). The patients in whom FISH failed appeared to be no different for the usual prognostic and biologic variables in multiple myeloma as compared with patients in whom the analysis was successful. The only common feature among patients in whom FISH failed was that they also failed at other FISH experiments, likely reflecting technical problems with the sample storage (data not shown).
Prevalence and relation to chromosome 13 abnormalities
A total of 53 patients (16%) were abnormal with a pattern indicative of the t(11;14)(q13;q32). Multiple and complex FISH patterns were observed whenever a sample was considered abnormal. The median percentage of plasma cells with a t(11;14)(q13;q32) was 99%, with a range of 82% to 100%. Patients with a t(11;14)(q13;q32) versus patients without the t(11;14)(q13;q32) were equally likely to have chromosome 13 abnormalities (47% vs 55%, P > .2) (Table2). Accordingly, patients with chromosome 13 abnormalities versus patients without chromosome 13 abnormalities were equally likely to have the t(11;14)(q13;q32) (14.0% vs 18.4%,P > .2).
Relation between chromosome 13 abnormalities and the t(11;14)(q13;q32)
| Chromosome 13 normal | Chromosome 13 deleted | Chromosome 13 assay failed | Total | |
|---|---|---|---|---|
| No. | 120 (81%) | 148 (84%) | 15 (57.7%) | 283 |
| t(11;14)(q13;q32) | [42.4%] | [52.3%] | [5.3%] | |
| t(11;14)(q13;q32) | 27 (18%) | 24 (14%) | 2 (7.7%) | 53 |
| [51%] | [45%] | [4%] | ||
| t(11;14) failed FISH | 2 (1%) | 4 (2%) | 9 (34.6%) | 15 |
| assay | [13%] | [27%] | [60%] | |
| Total | 149 | 176 | 26 | 351 |
Fisher exact test, excluding patients with failed FISH analysis,P = .3. Numbers reflect the total patients in any given category, parentheses reflect the column percentage, and brackets represent the row percentage.
Clinical features of patients
Patients younger than age 40 appeared to be more likely to have the t(11;14)(q13;q32) detected (43% vs 15%, P = .08). Patients with the t(11;14)(q13;q32) were more likely to have a serum monoclonal protein component of less than 10 g/L (1 g/dL) (28% vs 15%, P = .029) and appeared to be less likely to have extramedullary plasmacytomas, although this difference was not statistically significant (6% vs 11%, P = .3). There was no difference in disease stage and no preferential usage of κ versus λ light chain according to the presence or absence of the t(11;14)(q13;q32).
There was a trend for patients with the t(11;14)(q13;q32) to have a lower plasma cell labeling index although the difference was not significant (Wilcoxon P = .09) (Table3). There were no clear differences noted in serum β2-microglobulin between patients with and without the t(11;14)(q13;q32) (Table 3). No difference was noted in the number of circulating plasma cells according to the presence or absence of the translocation. All other variables tested, except those shown below, showed no significant trends or associations.
Distribution of β2-microglobulin and plasma cell labeling index according to the presence or absence of the t(11;14)(q13;q32)
| Chromosome status | β2-microglobulin | Plasma cell labeling index | |||||
|---|---|---|---|---|---|---|---|
| 2.7 mg/dL or less | 2.7 to 4 mg/dL | More than 4 mg/dL | 0% to 0.2% | 0.21% to 1% | 1.01% to 3% | More than 3% | |
| No translocation | 98 (35%) | 55 (20%) | 127 (45%) | 105 (37%) | 97 (35%) | 61 (22%) | 17 (6%) |
| t(11;14)(q13;q32) | 15 (29%) | 12 (23%) | 25 (48%) | 25 (47%) | 18 (34%) | 8 (15%) | 2 (4%) |
Numbers reflect the total patients in any given category, and parentheses reflect the row percentage.
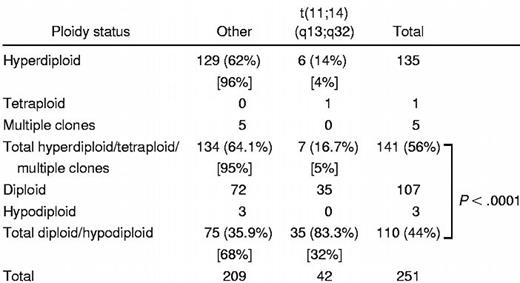
Ploidy
Five categories of ploidy were recorded on the bone marrow samples by the DNA content analysis: hypodiploid, diploid (pseudodiploid), hyperdiploid, multiple clones, and tetraploid (Table4). Patients with the t(11;14)(q13;q32) were much less likely to be hyperdiploid as compared with those without the abnormality (14% vs 62%, P < .0001). Accordingly, when analyzed by the categories of ploidy, patients with the t(11;14)(q13;q32) were much more likely to be either diploid (pseudodiploid) or hypodiploid as compared with those without the abnormality (83% vs 36%, P < .0001).
Survival and response to treatment
Patients with the t(11;14)(q13;q32) did not have a worse survival as compared with patients without the abnormality (Table5). The median survival of patients with the t(11;14)(q13;q32) was 49.6 months as compared with 38.7 months for patients without the abnormality (log-rank P > .2) (Figure 2). The median progression-free survival was 33 months versus 27.1 months for those with and without the abnormality, respectively (log-rank P > .2) (Figure3). Likewise, patients with the t(11;14)(q13;q32) were equally likely to respond to chemotherapy, with an overall response rate of 78% versus 67% (P = .14). Postprogression survival appeared to be better among patients with the t(11;14)(q13;q32) as compared with others (20 vs 13 months, log-rankP = .086). The proportion of long-term survivors (> 10 years) was similar among patients with and without the abnormality (9.4% vs 7.9%). There were no perceived differences in survival in the subset of patients treated with the addition of interferon-α2 or cyclophosphamide to VBMCP, according to the presence or absence of the genetic abnormality (Table 6).
Response to therapy and survival statistics
| Variable | All5-150 (n = 336) | t(11;14) (q13;q32) (n = 53) | Other (n = 268) |
|---|---|---|---|
| Response rate | |||
| Objective response | 67.2 | 73.6 | 66.0 |
| None/progression | 31.1 | 20.7 | 32.9 |
| Not evaluable | 1.7 | 5.6 | 1.1 |
| Median survival, mo (95% confidence interval) | 40.5 (36.9-46.7) | 49.6 (36.9-60.1) | 38.7 (35.5-43.7) |
| Progression-free survival, mo (95% confidence interval) | 28.9 (26-31.9) | 33.0 (27.6-43.3) | 27.1 (24.4-31.1) |
Includes patients with failed FISH assay.

Overall survival in months for patients stratified according to the presence or absence of the t(11;14)(q13;q32).
Overall survival in months for patients stratified according to the presence or absence of the t(11;14)(q13;q32).

Progression-free survival in months for patients stratified according to the presence or absence of the t(11;14)(q13;q32).
Progression-free survival in months for patients stratified according to the presence or absence of the t(11;14)(q13;q32).
Median survival in months (95% confidence interval) according to the specific therapy administered
| Patients without t(11;14) | t(11;14)(q13;q32) | |
|---|---|---|
| Patient receiving interferon versus other | 37.2 (33.9-44.1) | 51.2 (20.3-87.8) |
| 40.6 (34.7-47.2) | 49.3 (34.1-59.8) | |
| Log-rank | P > .2 | P > .2 |
| Patients receiving cyclophosphamide versus others | 38.8 (33.4-48.7) | 54 (24.5-71.2) |
| 38.7 (34.8-43.7) | 49.3 (34.1-61.4) | |
| Log-rank | P > .2 | P > .2 |
Discussion
This study provides evidence that attests to the uniqueness of multiple myeloma with the t(11;14)(q13;q32),19characterized by higher prevalence of low-concentration monoclonal proteins, no association with an unfavorable outcome, and greater likelihood of being pseudodiploid or hypodiploid than hyperdiploid. In addition, we had previously shown that myeloma patients with the t(11;14)(q13;q32) have a lymphoplasmacytic morphology in nearly one half of cases (42%).19
Our study confirms that approximately one sixth of patients with multiple myeloma have a t(11;14)(q13;q32) as reported by others.8,12 Thus, along with the t(4;14)(p16.3;q32), it is the most common IgH translocation in the plasma cell dyscrasias.8,12 The prevalence of patients with t(11;14)(q13;q32) is lower than we observed among patients with MGUS or primary systemic amyloidosis.14,31 The higher prevalence of the t(11;14)(q13;q32) in MGUS or primary systemic amyloidosis14,31 as compared with multiple myeloma suggests that the abnormality is negatively selected for progression to active myeloma. However, because other groups have found a similar prevalence of the t(11;14)(q13;q32) among patients with MGUS as in multiple myeloma, further studies are needed to learn whether the different frequencies of patients with t(11;14)(q13;q32) are statistical artifact or a real difference.13 Because the t(11;14)(q13;q32) occurs in MGUS,13,14 this indicates that this abnormality alone is not sufficient for the plasma cell to acquire the full malignant potential and behave as multiple myeloma plasma cells.13,14 Therefore, other mechanisms must exist that favor the transition of MGUS to myeloma. We considered whether chromosome 13 abnormalities38 represented the second genetic event leading to disease progression in patients with the t(11;14)(q13;q32). However, we found no correlation between both abnormalities, suggesting that their coexistence is likely unrelated.
Unlike previous observations by us and others,11,12,20,23,24 we have not confirmed the adverse prognostic significance for multiple myeloma patients with the t(11;14)(q13;q32) when detected by cIg-FISH. Indeed, our data suggest that patients with the abnormality at least have a similar survival to other patients. The study by Konigsberg and colleagues showing an adverse outcome for multiple myeloma and chromosome 11q abnormalities did not separate patients with and without the t(11;14)(q13;q32), the latter only being 7 patients.12
The existing notion that the t(11;14)(q13;q32), as detected by standard karyotype analysis, resulted in poor prognosis likely emanated from the prominent nature of the chromosomal abnormality that made it readily recognizable in patients with abnormal karyotypes. We have previously shown that obtaining abnormal metaphases, without regard to the specific abnormalities, correlates with prognosis and is likely a surrogate marker of a proliferative clone.10 We have also previously shown that abnormal karyotypes are more frequently seen among those patients with higher plasma cell labeling index and higher degree of bone marrow involvement by the clone.39 These reasons likely explain the previously suspected poor prognosis of patients with the t(11;14)(q13;q32) and our previous suggestion that multiple myeloma with the t(11;14)(q13;q32) was associated a higher number of circulating plasma cells. In this study we have found no significant differences in the number of circulating plasma cells in patients with the t(11;14)(q13;q32). A suggestion of the association between the t(11;14)(q13;q32) and a better prognosis in the plasma cell dyscrasias is that among patients with plasma cell leukemia, those harboring the t(11;14)(q13;q32) appear to have a better prognosis.40
It is apparently contradictory that patients with the t(11;14)(q13;q32) would have a lower proliferative rate, as shown by a lower plasma cell labeling index, than patients without the abnormality, becausecyclin D1 favors cell cycle progression.41However, a more appropriate comparison is to normal plasma cells, where the labeling index is usually zero because these cells divide infrequently. Likewise, while these patients had a trend toward a better response to treatment, the difference was modest and of unknown causative relation to an improved survival.
A dramatic finding of our study is the strong association between the t(11;14)(q13;q32) and the near diploid DNA content analysis. Samdja and colleagues, using standard karyotype analysis and thus performing direct chromosomal enumeration, have also observed this association in a smaller number of patients studied.42 This difference can thus be reflective of different pathogenetic mechanisms of myeloma, one of which is characterized by clonal growth initiated by structural chromosomal abnormalities, such as the t(11;14)(q13;q32), and a second one characterized by chromosomal accumulation leading to multiple chromosomal trisomy. In fact, most human myeloma cell lines with the t(11;14)(q13;q32) are also diploid (37-47 chromosomes) (personal communication, W. Michael Kuehl, 2001). Of 11 cell lines with the t(11;14), 8 (73%) are near diploid. In contrast, 9 (37.5%) of 24 other myeloma cell lines are diploid (43-49 chromosomes). In our previous report on multiple myeloma and the t(11;14)(q13;q32) we reported that in 11 of 13 cases their total chromosomal number was diploid or near diploid.11 However, in many of these cases the karyotypes are abnormal with chromosomal gains and losses balancing each other to a near diploid chromosomal count. We speculate that a myeloma clone with t(11;14)(q13;q32) grows without progressive accumulation of extra chromosomes that lead to hyperdiploidy. Thus, it is plausible that multiple myeloma with the t(11;14)(q13;q32) represents a multiple myeloma variant that is relatively “genomically stable,” resulting in a more indolent course of the disease and cells that remain susceptible to the effects of chemotherapy. Alternatively, hyperdiploidy ensues first and through continuous chromosomal loss the cell become diploid or pseudodiploid again, but those cases with the t(11;14)(q13;q32) are capable of sustaining additional losses as compared with those cases without the abnormality.
Patients with the t(11;14)(q13;q32) were more likely to have smaller serum monoclonal proteins, and this is compatible with the reported lymphoplasmacytic morphology reported in one half of patients.19 Because none of these patients expressed IgM monoclonal protein, the cell has necessarily undergone a productive allele-isotype switching (legitimate IgH rearrangements). Yet, because of the higher likelihood of small serum monoclonal spikes in this myeloma variant, we speculate that the clonal cell in multiple myeloma and the t(11;14)(q13;q32) is more commonly an immature plasma cell. Most IgH translocations in multiple myeloma (illegitimate IgH rearrangements)43 are thought to occur at the time of isotype class switching, as best shown by Gabrea and colleagues.16 However, those involving chromosome 11 at band q13 can also occur at the JH site, presumptively during somatic hypermutation and thus arising earlier in the process of B-cell development.1,7 44 This would indicate that the recombination errors responsible for disease pathogenesis in the plasma cell dyscrasias may originate earlier in some multiple myeloma patients with the t(11;14)(q13;q32), and this is also concordant with the lymphoplasmacytic morphology and oligosecretory nature of these same patients.
In summary, here we provide further evidence that multiple myeloma with the t(11;14)(q13;q32) represents a unique biologic entity. We show that myeloma patients with the t(11;14)(q13;q32) do not have worse prognosis than other patients. As novel biologic therapies emerge, the molecular classification of the subtypes of the disease may allow for a more rational approach to their treatment with agents such as those interfering with cell cycle regulatory pathways.
We thank Michael Kuehl for helpful discussion about the content of this manuscript.
Supported in part by Public Health Service grant R01 CA83724-01 (R.F.) from the National Cancer Institute, research grant CA62242 (P.R.G., B.V.N), and ECOG grant CA21115-25C from the National Cancer Institute (P.R.G., N.E.K.). R.F. is a Leukemia and Lymphoma Society Translational Research Awardee and is also supported by the CI-5 Cancer Research Fund-Lilly Clinical Investigator Award of the Damon Runyon–Walter Winchell Foundation.
The publication costs of this article were defrayed in part by page charge payment. Therefore, and solely to indicate this fact, this article is hereby marked “advertisement” in accordance with 18 U.S.C. section 1734.

This feature is available to Subscribers Only
Sign In or Create an Account Close Modal