Abstract
Human blood contains at least 2 subpopulations of antigen-presenting dendritic cells (DCs) that can be differentiated by their expression of CD11c. Myeloid DCs (myDCs), which are CD11c+, trap invading pathogens in the tissues and then migrate to lymphoid tissues where they stimulate pathogen-specific T-cell responses. Plasmacytoid DCs (pcDCs), which are CD11c−, secrete interferon-α in response to viral infections. This study reports that in HIV-1 infection there is a progressive depletion of both these DC populations and that this correlates with an increasing HIV-1 plasma virus load. The median numbers of myDCs and pcDCs were 6978/mL and 9299/mL, respectively, in healthy male controls and 2298/mL and 1640/mL, respectively, in patients with more than 105 HIV-1 RNA copies/mL. Both DC populations expressed CD4, CCR5, and CXCR4. The findings suggest that loss of DCs in HIV infection may contribute to disease progression.
Introduction
Dendritic cells (DCs) are a heterogeneous population of antigen-presenting cells that are important in bridging the innate and acquired immune responses.1-3 Blood DCs can be divided into 2 subpopulations on the basis of expression of the β-integrin CD11c. Originally, these subpopulations were thought to represent 2 stages of a common developmental pathway,4 but they were subsequently reported to arise from different lineages.5 CD11c+ DC (myDCs) are precursors of Langerhans cells and dermal and interstitial DCs.6 They express myeloid markers, intercept invading pathogens in the periphery, and then migrate to the secondary lymphoid tissue where they present pathogen-derived peptides to antigen-specific T cells. In contrast, plasmacytoid DCs (pcDCs) are CD11c−, lack myeloid markers, and migrate directly from blood to the secondary lymphoid tissue, where they differentiate into cells originally termed plasmacytoid T cells because of their extensive endoplasmic reticulum.7,8 The myDCs secrete interleukin 12 (IL-12), which drives type 1 helper-T-cell immune responses associated with generation of cellular immunity.9 The pcDCs secrete lower amounts of IL-1210 but are potent producers of interferon-α (IFN-α) and may thus play an important role in controlling virus infections.11
Several studies found that DCs are susceptible to human immunodeficiency virus type 1 (HIV-1) infection in vitro,12,13 findings that correlate with loss and infection of DCs in vivo.14 15 However, how loss of DCs correlates with disease progression or whether there is loss in one or both populations of DCs is unknown. In this study, we observed a progressive loss of both myDC and pcDC populations with increasing HIV-1 virus load. The progressive deterioration in HIV-1 infection may reflect loss of DCs, which would in turn impair generation of antiviral cytotoxic T lymphocytes (CTLs) and the production of the potent antiviral cytokine IFN-α.
Study design
Patients and blood samples
We studied 37 men with HIV-1 infection at different stages of disease who were not receiving antiretroviral therapy. HIV-1 RNA virus loads ranged from 10 to 500 000 copies/mL (median, 34 476 copies/mL) and CD4 counts from 9 to 711 cells/μL (median, 234 cells/μL). Ethical approval and informed consent were obtained before blood donation. Sixteen control samples were obtained from healthy age-matched male volunteers without HIV-1 infection. The median age of the controls was 36 years (range, 23-54 years); that of the patients was 37 years (range, 22-61 years). Blood was collected in Vacutainers coated with EDTA and separated by using a Ficoll-Histopaque device (Sigma Aldrich, Poole, United Kingdom) within 5 hours. Peripheral blood mononuclear cells (PBMCs) were resuspended in RPMI (HEPES modification) medium (Sigma Aldrich) supplemented with 2% fetal calf serum and stored overnight at 4°C.
Quantitation of DCs
Cells (5 × 10⁵) were labeled with phycoerythrin (PE)–conjugated anti-CD19 (Becton Dickinson, Oxford, United Kingdom), CD3, CD14, CD16, Cychrome anti–HLA-DR (Pharmingen, Oxford, United Kingdom), and fluorescein isothiocyanate–conjugated anti-CD11c (Dako, Ely, United Kingdom). Approximately 200 000 cells were acquired within 24 hours of staining and analyzed on a fluorescence-activated cell-sorter scanner (FACS; FACSCalibur; Becton Dickinson) using Cell Quest software. DCs were identified by labeling for HLA-DR and absence of staining with the PE-conjugated antibody mixture. The DCs were differentiated into the myDC and pcDC subpopulations on the basis of their expression of CD11c. The concentration of DCs in blood was estimated by using the percentages generated by the FACS analysis and the original PBMC count.
CD4 and chemokine expression by DCs
Four-color flow cytometric analysis was done on PBMCs from healthy donors. Cells (5 × 10⁵) were labeled with antibodies against the lineage mixture, HLA-DR and CD11c, and allophycocyanin-conjugated anti-CD4, anti-CCR5, or anti-CXCR4 (Pharmingen). The 2 DC populations were identified, and expression of CD4 and chemokine receptors was assessed.
Statistical analysis
The significance of the differences in DC numbers in patients and controls was evaluated with the Mann-Whitney U test. A Pvalue of .05 or less was considered to represent significance. SPSS software (Chicago, IL) was used for the statistical comparisons. The Pearson correlation (r) was used to show regression of DC numbers with increasing virus load and decreasing CD4 count.
Results and discussion
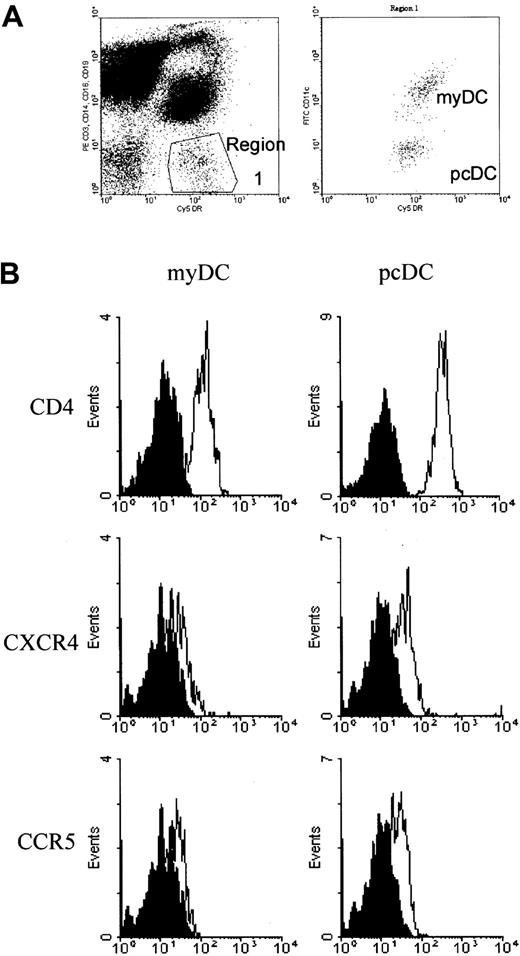
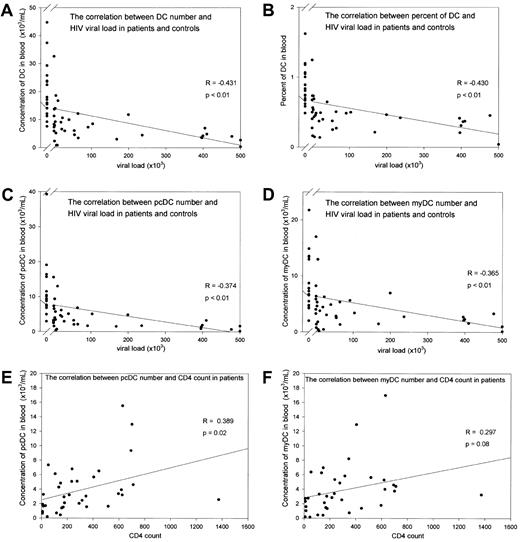
DCs were defined by the absence of labeling with cell-lineage–specific antibodies and expression of HLA-DR (Figure1A). Labeling with anti-CD11c separated the DCs into 2 populations corresponding to CD11c+ myDCs and CD11c− pcDCs (Figure 1A). In the 16 samples from male controls, there was a large variation in the number of blood DCs (range, 7553-44 715 DCs/mL; median, 17 566 DCs/mL). In patients with HIV-1 infection, there was a progressive loss of DCs with an increasing viral load (r = −0.43, P < .01; Figure2A). In patients with a virus load greater than 1 × 10⁵ copies/mL, the median number of DCs was reduced to 4102 DCs/mL (P < .01). Despite a marked reduction in the total population of mononuclear cells, the reduced DC number was not a result of a general impairment in hematopoiesis, since the percentage of DCs in the mononuclear cell population also decreased progressively with an increasing virus load (r = −4.3;P < .01; Figure 2B).
Identification of blood DCs for quantification and expression of HIV-1 receptor and coreceptor molecules.
DCs were identified by FACS analysis on the basis of their lack of labeling for the mononuclear cell markers CD3, CD14, CD16, and CD19 but positive staining for HLA-DR. The myDCs were differentiated from the pcDCs by their expression of CD11c (A). (B) Histograms show expression of CD4, CXCR4, and CCR5 on myDCs and pcDCs. In each plot, the solid curve depicts labeling with an isotype control antibody and the open curve shows labeling with a specific antireceptor antibody.
Loss of blood DCs with disease progression in patients with HIV-1 infection.
(A-D) Loss of DCs with increasing RNA viral load. (A) Total number of DCs in blood. (B) Percentage of DCs in the PBMC population. (C) Number of pcDCs/mL. (D) Number of myDCs/mL. (E) Loss of pcDCs and (F) myDCs with decreasing CD4 count. In panels A-D, data points to the left of the break in the x axis show results in uninfected controls.
The median percentage of total DCs was 0.82% in controls and reduced to 0.37% in patients with viral loads greater than 1 × 10⁵ copies/mL. In contrast, the percentage of monocytes in the patients was unchanged, suggesting that there was not a general loss of myeloid cells. The progressive loss of DCs was not restricted to either cell population: the numbers of both myDCs and pcDCs were reduced (r = −0.32 andr = −0.43, respectively; Figure 2C and 2D). The decrease in DC numbers with increasing viral load also correlated with CD4 count, with the median number of DCs reduced to 3904/mL (P < .01) in patients with CD4 counts lower than 100. There was a weaker correlation with CD4 counts than with virus load for both pcDCs and myDCs.
Because myDCs give rise to tissue dermal and Langerhans-type DCs, and these cells function to acquire pathogens and present pathogen-derived peptides to T cells in the secondary lymphoid tissue, the progressive loss of myDCs may be at least partly responsible for the impairment of virus-specific CTL responses in the late stages of HIV-1 disease. CD11c− pcDCs have been reported to be a major source of IFN-α in vivo.11,16 17 Loss of these cells, such as in our patients, would reduce levels of IFN-α and thereby contribute to increased virus loads. Some of the loss may represent recruitment to the lymph nodes rather than depletion. Nevertheless, maintenance of pcDC numbers in the blood may be important in the successful treatment of HIV-1 infection.
Infection by HIV is one possible mechanism for loss of DCs from the blood. We therefore analyzed DCs for expression of CD4 and the CCR5 and CXCR4 chemokine coreceptors in healthy individuals (Figure 1B). CD4 was expressed by both populations of DCs but at a higher level on pcDCs. Low but clearly evident expression of CCR5 and CXCR4 was detected on both pcDCs and myDCs. Therefore, DCs may be susceptible to infection with HIV-1.
This study showed a progressive depletion of both myDCs and pcDCs in patients with HIV-1 infection. This depletion may impair generation of HIV-1–specific CTL responses and reduce levels of the antiviral cytokine IFN-α, and as a consequence of these changes, virus loads may increase. Restoration of full immunocompetence in patients receiving antiviral therapy may depend on reconstitution of the DC system; thus, treatment with drugs that promote generation of DCs, such as Flt3 ligand,18 should perhaps be considered for such patients.
Supported by a grant (G9814980) from the Medical Research Council, United Kingdom.
The publication costs of this article were defrayed in part by page charge payment. Therefore, and solely to indicate this fact, this article is hereby marked “advertisement” in accordance with 18 U.S.C. section 1734.
References
Author notes
Steven Patterson, Department of Immunology, ICSTM at Chelsea and Westminster Hospital, 369 Fulham Rd, London SW10 9NH, United Kingdom; e-mail: s.patterson@ic.ac.uk.


This feature is available to Subscribers Only
Sign In or Create an Account Close Modal