CD98 is expressed on both hematopoietic and nonhematopoietic cells and has been implicated in a variety of different aspects of cell physiology and immunobiology. In this study, the functional interactions between CD98 and other adhesion molecules on the surface of the promonocyte line U937 are examined by means of a quantitative assay of cell aggregation. Several of the CD98 antibodies induced homotypic aggregation of these cells without affecting cellular viability or growth. Aggregation induced by CD98 antibodies could be distinguished from that induced by β1-integrin (CD29) ligation by lack of sensitivity to EDTA and by increased sensitivity to deoxyglucose. Aggregation induced via CD98 and CD29 could also be distinguished by the pattern of protein tyrosine phosphorylation induced. Some CD29 antibodies partially inhibited CD98-induced aggregation, and these antibodies were neither agonistic for aggregation nor inhibitors of β1-integrin binding to substrates. Conversely, some CD98 antibodies were potent inhibitors of CD29-induced aggregation. Antibodies to β2 integrins also partially inhibited CD98-induced aggregation. Unexpectedly, 2 antibodies to CD147, an immunoglobulin superfamily member whose function has remained unclear, were also potent inhibitors of both the aggregation and the protein tyrosine phosphorylation induced via CD98 ligation. The results of this study support a central role for CD98 within a multimolecular unit that regulates cell aggregation.
Introduction
CD98 is the heavy chain (85 kd) of a cell-surface dimeric molecule found on the surface of many hematopoietic cells.1,2 It is a type II integral membrane protein, with a long cytoplasmic portion of 81 amino acids. Some studies have suggested that it may act as ligand for the cell-surface lectin galectin-3.3 CD98 is found covalently linked to 1 of several (6 have been identified to date) alternative light chains, at least 4 of which have been identified as members of an amino acid transporter family.4 There is also good evidence that CD98 is functionally associated with β1-integrin molecules on the cell membrane,5 6 although the consequences of this association remain unclear.
The most striking feature of CD98 is the extraordinary diversity of functions in which it has been implicated.7 Antibodies against CD98 block the formation of cell syncitia by human immunodeficiency virus and other viruses,8,9 and CD98 also appear to play a more general role in regulation of integrin-mediated cell adhesion.6,10,11 CD98 has been implicated in hematopoietic cell differentiation, growth, transformation, and apoptosis,1,12 and recently this role has been extended to the regulation of osteoblast differentiation.13 CD98 also plays a role in the regulation of amino acid transport by virtue of its associated light chain, as discussed above. Most recently, the molecule has been implicated in the regulation of both antigen-presenting cell function and T-cell activation.14,15 Our group's interest in CD98 arose because we described its presence at very high levels on the surface of human dendritic cells.16 Subsequently, we showed that some antibodies to this molecule could block the ability of both the U937 promonocyte line17 and human peripheral blood–derived dendritic cells18 to deliver essential costimulatory signals to T cells.
One central question in the biology of CD98 has been how to understand the nature of its functional interactions with integrins and other adhesion molecules at the cell surface. In this study, we have developed and used a new quantitative assay of homotypic aggregation of U937 cells, and we have re-examined this question in detail. Our results confirm that there is an important interaction between CD98 and CD29 (β1 integrin), but demonstrate that the cellular events following activation via these 2 molecules can be clearly distinguished pharmacologically, biochemically, and in terms of their differential sensitivity to antibody modulation. Thus, the downstream functional effects of CD98 ligation are not mediated solely via β1 integrins. Furthermore, both the specificity profile and kinetic data suggest that β1 integrins are involved in modulating CD98 activity, but not in mediating the U937 homotypic adhesion. Finally, our study identifies a new member of the CD98 functional unit, the immunoglobulin superfamily member CD147, whose function has hitherto remained unclear. Taken together with the previously published data on CD98, the results presented below suggest that CD98 plays a central role within a multimolecular unit that may serve to regulate cellular responses to changes in the tissue microenvironment.
Materials and methods
Materials
Colchicine, cycloheximide, cytochalasin B, sodium azide, EDTA, deoxyglucose, 3-(4,5-dimethylthiazol-2-yl)-2,5-diphenyltetrazolium bromide (MTT), and phorbol 12-myristate 13-acetate (PMA) were purchased from Sigma Chemical (Poole, United Kingdom). Fetal bovine serum (FBS) and RPMI 1640 were obtained from Gibco (Grand Island, NY). U937, the human promonocytic cell line, was purchased from ATCC (Rockville, MD).
The following antibodies were used in this study: CD18 (CLB-LFA1, immunoglobulin [Ig]–G1, ascites, CLB); CD18 (BU86, IgG1, ascites, kindly provided by D. Hardie, Birmingham University, Birmingham, United Kingdom); CD29 (MEM 101A, IgG1, ascites, kindly provided by V. Horejsi); CD29 (P5D5, IgG1, purified antibody, gift from N. Hogg, Imperial Cancer Research Fund (ICRF), London, United Kingdom); CD29 (MAR4, IgG1, ascites, kindly provided by S. Menard, National Cancer Institute, Milan, Italy); CD43 (161-46, ascites, IgG1, kindly provided by R. Villela, Centre of Immunology, Barcelona, Spain); CD44 (E1/2, IgG1, purified antibody, Leinco Technologies, St Louis, MO); CD98 (BK19.9, IgG1, purified antibody, kindly provided by A. van Agthoven, Immunotech, Marseille, France); CD98 (4F2, IgG2a, ascites, kindly provided by D. Fox); CD98 (BU53, IgG2a, purified antibody, kindly provided by D. Hardie); CD98 (BU89, IgG1, purified antibody, kindly provided by D. Hardie); CD98 (AHN-18.1 and AHN-18, IgG1 culture supernatants, kindly provided by K. Skubitz); CD98 (MEM 108, IgG1, ascites, kindly provided by V. Horejsi); CD147 (MEM M6/1, IgG1, ascites, kindly provided by V. Horejsi); CD147 (H84HF, IgG2b, ascites, kindly provided by K. Sagawa). The specificity of all the CD98 and CD147 antibodies was confirmed on appropriately transfected cell lines.19
F(ab)2 and Fab fragments of CD98 AHN-18 were prepared by digestion of purified antibodies with pepsin and papain according to standard methods. Fragments were purified by affinity chromatography on protein A and analyzed by polyacrylamide gel electrophoresis.
Cell culture
U937 cells were maintained in RPMI 1640 supplemented with 10% fetal calf serum (FCS). Cells were grown at 37°C and 5% CO2 in humidified air.
Quantitative homotypic cell aggregation assay
We placed 20 μL cells in RPMI 1640 medium supplemented with 10% FCS at 106 cells/mL in round-bottom wells of a 96-microwell plate. An equal volume of medium, with or without appropriate antibody, was added, and the cells were incubated at 37°C for 4 to 7 hours. The cells were resuspended gently, so as not to break up the clusters, and the number of unaggregated and total cells were counted in a hemocytometer. The percentage of cells in aggregates was determined by the following equation: % of cells in aggregates = [(total cells − free cells)/total cells] × 100. All values, expressed as mean ± SEM, were obtained from 3 to 6 replicate cultures, and the Student t test for unpaired observation between control and experimental samples was carried out for statistical evaluation of a difference. Each individual experiment was repeated a minimum of 3 times.
Cytofluorometric analysis
Expression of CD98 on the surface of U937 cells was determined by flow cytometry. Cells (105) were washed with phosphate-buffered saline (PBS) staining buffer (containing 2% FBS and 1% sodium azide) and incubated in 50 μL staining buffer containing 10% rabbit serum for 10 minutes on ice and then with the primary antibody for a further 45 minutes. After washing 3 times with staining buffer, cells were treated with 1/20 dilution of fluorescein isothiocyanate (FITC)–conjugated rabbit anti–mouse IgG secondary antibody (Dako, Dakopatts, High Wycombe, United Kingdom). Cells were then washed 3 times with staining buffer and analyzed on a FACScan (Becton Dickinson, San Jose, CA). Expression of CD29, CD18, CD45, and HLA-DR was analyzed by direct binding of fluoresceinated antibodies by means of flow cytometry as above. FITC-conjugated anti-CD18 and anti-HLA-DR, and tetrahoclamine isothiocyanate–conjugated anti-CD29, were obtained from Immunotech (Marseilles, France) and Coulter Electronics (Bedfordshire, United Kingdom), respectively. FITC-conjugated–mouse anti–human CD45 was obtained from Serotec (Oxford, United Kingdom).
MTT assay (colorimetric assay) for measurement of cell viability
Cell viability was measured by standard MTT assay. We added 10 μL MTT solution (10 mg/mL in PBS) to each well of U937 cultures for 3 hours before the end of the culture period. The cells were lysed by the addition of 15% sodium dodecyl sulfate (SDS) for solubilization of formazan and the optical density (OD) at 570 nm (OD570-630) was measured by means of a Spectramax 250 microplate reader (Molecular Devices, Sunnyvale, CA).
Phosphotyrosine analysis
Cells (5 × 10⁶ cells/mL) were washed 3 times in cold PBS containing 1 mM sodium orthovanadate and lysed in lysis buffer (20 mM Tris-HCl, pH 7.4, 2 mM EDTA, 2 mM ethyleneglycotetraacetic acid, 50 mM β-glycerophosphate, 1 mM sodium orthovanadate, 1 mM dithiothreitol, 1% Triton X-100, 10% glycerol, 10 μg/mL leupeptin, 10 μg/mL aprotinin, 10 μg/mL pepstatin, 1 mM benzimide, and 2 mM hydrogen peroxide) for 30 minutes with rotation at 4°C. The lysates were clarified by centrifugation at 16 000g for 10 minutes at 4°C, and stored at −20°C until needed.
Cell lysates were then analyzed by immunoblotting. Proteins were separated on 10% SDS–polyacrylamide gels, and transferred by electroblotting to polyvinylidenedifluoride (PVDF) membrane. Membranes were blocked for 60 minutes in Tris-buffered saline containing 3% bovine serum albumin, 20 mM NaF, 2 mM EDTA, and 0.2% Tween 20 at room temperature. The membrane was incubated in antiphosphotyrosine antibody (mouse monoclonal IgG2b) (Upstate Biotechology, Lake Placid, NY) solution overnight at 4°C, washed 3 times with the same buffer, incubated for 45 minutes at room temperature in horseradish peroxidase–conjugated rabbit antimouse immunoglobulin, and then washed 3 times. Peroxidase activity was visualized by chemiluminescence detection (electrogenerated chemiluminescence reagents) (Amersham, Little Chalfont, Buckinghamshire, United Kingdom). Intensity of bands on film was quantified with Synpotic (Cambridge, United Kingdom) image analysis system and software.
Results
Aggregation-inducing activity of CD98 antibodies is heterogeneous and is not correlated with binding activity
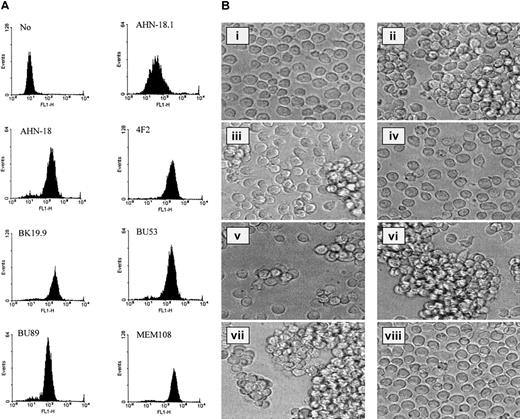
The binding of a panel of 7 antibodies specific for CD98 to U937 cells is shown in Figure 1A. All the antibodies showed a unimodal binding profile by flow cytometry, and the level of binding was dependent on antibody concentration. The antibodies were then tested for their ability to induce homotypic aggregation of U937 cells (Figure 1B, ii-v, and Table1). The antibody CD98-AHN-18 was the most potent inducer of aggregation; several others induced weaker aggregation (BK19.9, BU53, 4F2), while some antibodies did not induce any aggregation. An antibody known to activate signaling and homotypic aggregation through the CD29 β1-integrin chain (MEM 101A) and an antibody to CD43 (161-46) that is believed to induce aggregation via a β1-integrin–independent pathway20 were also tested in the aggregation assay. Both these antibodies did induce aggregation of the U937 cells (Figure 1B, vi-vii), although the morphology of the clusters was different from that induced by CD98-AHN-18, as the clusters tended to be tighter and more compact. Aggregation was not induced simply by the presence of antibody on the surface of U937, since antibodies to CD44, another molecule present on the surface of U937,21 did not induce aggregation (Figure 1B, viii).
CD98 antibodies differ in their ability to bind to the surface of U937 cells and their ability to induce homotypic aggregation.
(A) A panel of 7 CD98 antibodies was tested for the ability to bind U937 cells by means of flow cytometry. All antibodies were tested over a wide range of concentrations (1 to 30 μg/mL), and the histograms shown in the Figure are those obtained at saturating doses of antibody (between 1 and 30 μg/mL). (B) U937 cells were incubated with antibodies (at dilutions that induced maximal aggregation in each case, between 0.3 and 1.5 μg/mL in each case) for 6 hours, as described in “Materials and methods.” Images of cells in culture at this time point were obtained by means of an inverted phase contrast microscope (original magnification, ×40), attached to a video camera, and captured with National Institutes of Health (NIH) (Bethesda, MD) image software. (i) Medium alone. (ii) CD98-AHN-18 (CD98). (iii) BU53 (CD98). (iv) BU89 (CD98). (v) 4F2 (CD98). (vi) MEM 101A (CD29). (vii) 161-46 (CD43). (viii) E1/2 (CD44).
Lack of correlation between cell-surface binding and aggregation-inducing activity of CD98 antibodies
| Antibody . | Cell-surface binding . | Aggregation . |
|---|---|---|
| AHN-18.1 | 134 ± 0.6 | 9 ± 2 |
| AHN-18 | 159 ± 19 | 54 ± 9 |
| BK19.9 | 152 + 10 | 17 + 3 |
| BU53 | 200 ± 4 | 32 ± 6 |
| BU89 | 184 + 5 | 10 + 1 |
| MEM 108 | 193 ± 1 | 11 ± 6 |
| 4F2 | 108 ± 2 | 20 ± 2 |
| Antibody . | Cell-surface binding . | Aggregation . |
|---|---|---|
| AHN-18.1 | 134 ± 0.6 | 9 ± 2 |
| AHN-18 | 159 ± 19 | 54 ± 9 |
| BK19.9 | 152 + 10 | 17 + 3 |
| BU53 | 200 ± 4 | 32 ± 6 |
| BU89 | 184 + 5 | 10 + 1 |
| MEM 108 | 193 ± 1 | 11 ± 6 |
| 4F2 | 108 ± 2 | 20 ± 2 |
U937 cells were incubated with the CD98 antibodies at a wide variety of concentrations (between 0.5 and 30 μgm/mL) and tested both for binding to U937 and for the ability to induce aggregation. The data shown here were selected so as to show aggregation at a concentration that gave comparable cell-surface binding, with mean fluorescence intensity (MFI) between 100 and 200. Binding to the U937 cells was measured by indirect immunofluorescence and flow cytometry. MFI was calculated by means of WIN-MDI software on a minimum of 5000 cells. Aggregation at 6 hours was measured by means of the quantitative assay described in “Materials and methods.” The results are shown as mean for triplicate cultures ± SEM.
The ability of the panel of CD98 antibodies to induce aggregation did not correlate with the level of binding to the U937 cell surface. To confirm this further, flow cytometry at a range of antibody concentrations was used to select a titer that gave a mean fluorescent channel number (MFI) of between 100 and 200. Aggregation at this titer was then measured with the quantitative assay. As shown in Table 1, aggregating activity is clearly independent of binding activity, and aggregation levels vary widely even when the concentrations of antibody used were chosen to give comparable levels of binding to the U937 cells.
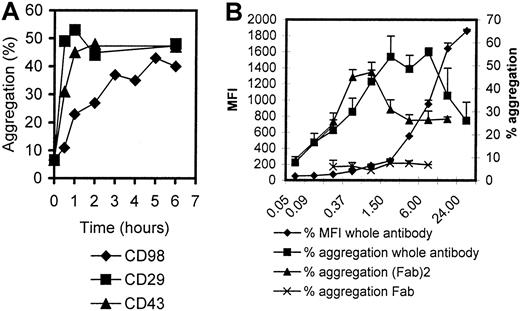
The characteristics of CD98-AHN-18–induced aggregation, as well as binding, were examined in more detail (Figure2). Binding increased in a linear fashion for 6 hours and then reached a plateau. In contrast, aggregation induced via CD29 (MEM 101A) or CD43 (161-46) was much more rapid (Figure 2A). The quantitative level of CD98-AHN-18–induced aggregation was dose dependent, but was maximal at subsaturating doses of bound antibody. Further increase in antibody concentration above this optimal level resulted in a lesser degree of aggregation (Figure 2B). F(ab)2 fractions of CD98-AHN-18 also induced aggregation (Figure 2B). The presence of high levels of human or rabbit immunoglobulin did not inhibit clustering (data not shown). In contrast, Fab fragments of CD98 failed to induce any clustering.
Time and dose dependency of aggregation induced by CD98-J3/AHN-18.
(A) U937 cells were incubated with CD98-AHN-18 (1 μg/mL), MEM 101A (CD29; 0.3 μg/mL), or 161-46 (CD43, 0.3 μg/mL) for various times as shown. Aggregation was measured as described in “Materials and methods.” The results show mean aggregation from triplicate cultures for 1 representative experiment of 2. (B) U937 cells were incubated with CD98-AHN-18 or fragments of CD98-AHN-18 at different concentrations (μg/mL) for 6 hours. Aggregation and binding were measured as for Figure 1. The results show mean aggregation ± SEM for triplicate cultures for 1 representative experiment of 2.
CD98-induced aggregation does not lead to cell death
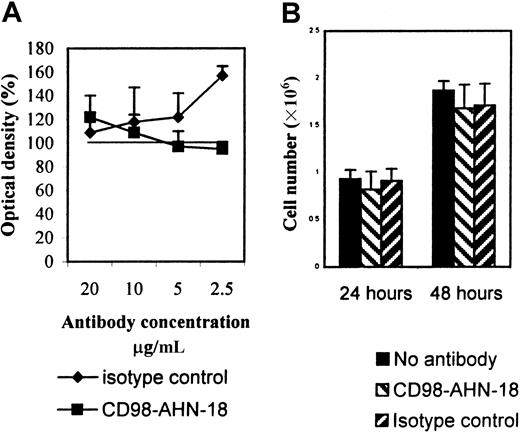
Since a previous study1 had suggested that CD98 triggering could induce cell death, we tested whether the CD98 monoclonal antibody (mAb) AHN-18 also caused killing of U937. As shown in Figure 3, CD98-AHN-18 did not decrease MTT reduction at 48 hours (Figure 3A). Furthermore, CD98-AHN-18 did not appear to cause growth arrest of the U937 cells, since cell numbers during 48 hours in culture increased to the same amount in both treated and control groups (Figure 3B).
CD98-AHN-18 antibody does not induce apoptosis of U937 cells or inhibit cell division.
(A) U937 cells, 5 × 10⁵ were incubated in the presence of different concentrations of CD98-AHN-18 antibody or isotype control in complete medium. MTT reduction was measured after 48 hours. Results are expressed as percentage of OD (mean ± SEM for triplicate cultures), relative to OD in the absence of antibody. The isotype control significantly stimulated MTT reduction at the highest concentration (P < .01), but all other values did not differ significantly from control. (B) U937 cells, 5 × 10⁶ were seeded into 96 well-plates, and incubated for 24 or 48 hours in the presence of CD98-AHN-18 antibody (1.5 μg/mL) or an isotype control. Cells were harvested and counted by means of trypan blue staining and light microscopy. The results show mean ± SEM for triplicate cultures. No value differed significantly from control.
CD98-induced aggregation, but not CD29-induced aggregation, is resistant to EDTA but sensitive to deoxyglucose
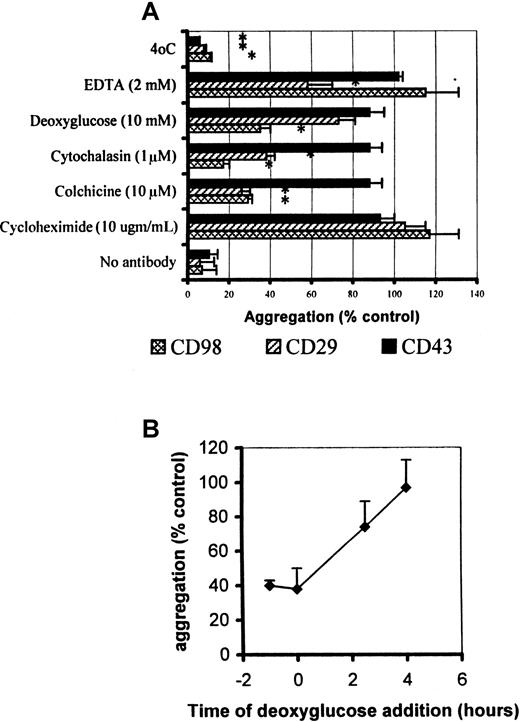
Since CD98 has been reported to associate with CD29 (β1 integrin) in the cell surface,6 we compared the ability of a number of inhibitors of cell function to block the aggregation induced by antibodies to these 2 molecules, as well as aggregation induced by CD43. As shown in Figure 4A, aggregation by antibodies to CD29 and CD98 share the properties of being sensitive to colchicine, cytochalasin, and low temperature, but insensitive to cycloheximide. EDTA blocks the ability of the activating β1-integrin antibody (MEM 101A) to induce aggregation; however, aggregation induced by the CD98 mAb AHN-18 is insensitive to the presence of EDTA. Aggregation induced by CD43 antibody, in contrast, was sensitive only to low temperature, suggesting a completely different mechanism of action for this molecule.
Metabolic inhibitor profile for CD98-, CD29-, and CD43-induced aggregation.
(A) Aggregation was measured under standard conditions as described in “Materials and methods,” in the presence of CD98-AHN-18 (1.5 μg/mL), MEM 101A (CD29, 0.3 μg/mL), and 161-46 (CD43, 0.3 μg/mL). The inhibitors were added 1 hour prior to the antibody and remained in the culture. Results are expressed as aggregation relative to control cultures in the presence of each aggregating antibody, but in the absence of inhibitor (mean ± SEM, triplicate cultures). All values that differ significantly from controls (P < .05) are indicated by an asterisk. (B) As for panel A, but the deoxyglucose (10 mM) was added either before, simultaneously with, or after CD98-AHN-18. Aggregation in all cases was measured at 6 hours. Results are expressed as aggregation relative to control cultures in the presence of each aggregating antibody, but in the absence of inhibitor (mean ± SEM, triplicate cultures).
CD98-dependent aggregation was also much more sensitive than CD29- or CD43-dependent aggregation to inhibition by the metabolic inhibitor deoxyglucose (Figure 4A). However, sensitivity to deoxyglucose was lost soon after addition of aggregating antibody (Figure 4B), suggesting that adenosine 5′-triphosphate dependence was an early step in the CD98-induced signaling pathway.
CD98-induced aggregation and CD29-induced aggregation are associated with distinct patterns of tyrosine phosphorylation
Previous studies have identified tyrosine phosphorylation as a downstream event in signaling by both β1 integrins22 and CD98.23 As shown in Figure5, a comparison of the pattern of phosphotyrosine proteins induced following activation of the U937 cells with CD98-AHN-18 is similar to, but distinct from, that induced by the activating CD29 antibody MEM 101A. In particular, CD98-AHN-18, but not MEM 101A, induces a rapid strong phosphorylation of a 72-kd band. Both antibodies induced bands at 114 and 155 kd.
Ligation of CD98 or CD29 induces rapid and distinct patterns of tyrosine phosphorylation.
U937 cells were incubated in the presence of CD98-AHN-18 (1.5 μg/mL) (A) or MEM 101A (CD29, 0.5 μg/mL) (B) for various time periods. Cells were lysed and analyzed for phosphotyrosine proteins as described in “Materials and methods.” Molecular weights of the major phosphorylated species are shown on the left and were calculated by image analysis of the Western blot, with the use of molecular weight standards to calibrate the software.
Reciprocal cross-inhibition by antibodies to CD98 and CD29
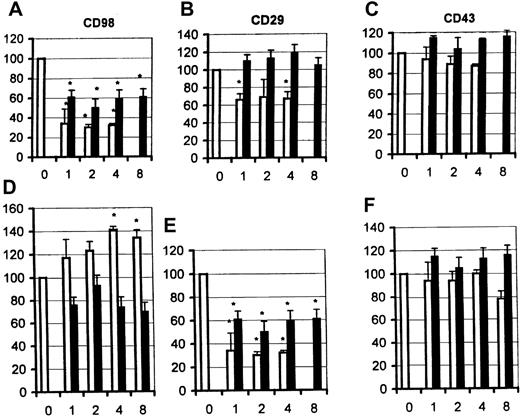
In order to probe further the interaction between CD29 and CD98 in the induction of U937 aggregation, the abilities of blocking antibodies to each of these 2 molecules to inhibit aggregation induced by the other was tested. As shown in Figure6A, 2 nonaggregating CD98 antibodies, MEM 108 and BU89, strongly inhibited CD98-AHN-18–induced aggregation. At the same concentration, CD98–MEM 108 showed no inhibition of aggregation induced by CD29 agonist antibody MEM 101A, while CD98-BU89 showed a significant but partial inhibition (panel B). In the reciprocal experiment, 2 inhibitory antibodies to CD29, P5D2 and MAR4, showed strong inhibition of CD29-induced (MEM 101A) aggregation (Figure6E). P5D2, which almost totally blocked the agonist action of CD29–MEM 101A, and is known to block binding of β1-integrin dimers to fibronectin,6,24 did not have any inhibitory activity against CD98-AHN-18–induced aggregation and indeed reproducibly enhanced the aggregation observed (panel D). The other CD29-blocking antibody, MAR4 (which does not block binding of β1-integrins to fibronectin25), showed a small but reproducible inhibition of CD98-AHN-18–induced aggregation (panel D). None of the blocking antibodies to either CD98 or CD29 that were tested had any inhibitory effect on CD43-induced aggregation (Figure 6C,F).
Cross-inhibition of U937 homotypic aggregation between CD98 and CD29 antibodies.
Aggregation was measured under standard conditions in the presence of CD98-AHN-18 (1.5 μg/mL, left panels), MEM 101A (CD29, 0.3 μg/mL, middle panels), or 161-46 (CD43, 0.3 μg/mL, right panels). Blocking antibodies were added to U937 cultures 1 hour prior to the aggregating antibodies. The blocking antibodies used were to CD98 (A-C) or to CD29 (D-F). Results are expressed as the percentage of aggregation relative to the aggregation in the absence of blocking antibody (column labeled 0 in each panel). Means that differ significantly from control (absence of inhibitory antibody, P < .05) are shown with an asterisk. Antibodies were tested at a series of dilutions, starting with the most dilute and increasing in 2-fold steps along the x-axis. To obtain the actual concentration of antibody at each point (in μg/mL), the x-axis value should be multiplied by 0.6 for BU89 (CD98, □), 0.3 for MEM 108 (CD98, ■), 1.25 for P5D2 (CD29, □), and 0.5 for MAR4 (CD29, ■).
Inhibition of CD98-induced homotypic aggregation by antibodies to β2 integrins
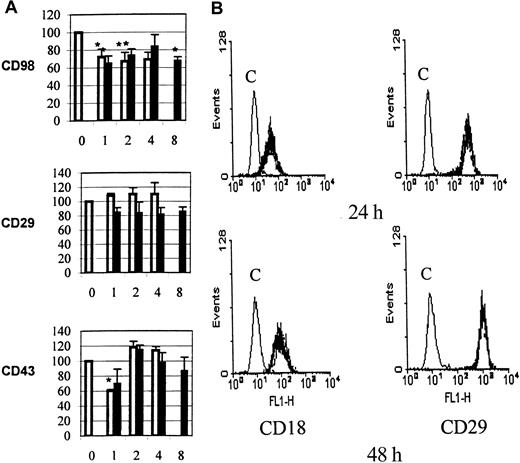
Previous studies have implicated β2 as well as β1 integrins in mediating CD98-induced adhesion. As predicted, blocking antibodies to CD18, the β2-integrin chain, partially blocked aggregation induced via CD98 (Figure 7A, top panel), but not via CD29 (middle panel A) or via CD43 (bottom panel). Both antibodies, at the same concentrations, showed strong inhibition of aggregation induced by PMA (not shown). A panel of anti–intercellular adhesion molecule (ICAM) 1, 2, and 3 (CD54, CD102, CD50) antibodies were also tested, but none inhibited aggregation induced by CD98 (not shown).
Functional interactions between CD98 and β2 integrins (CD18).
(A) Aggregation was measured under standard conditions in the presence of CD98-AHN-18 (1.5 μg/mL, top panel), MEM 101A (CD29, 0.3 μg/mL, middle panel), or 161-46 (CD43, 0.3 μg/mL, bottom panel). Blocking antibodies to CD18 were added to U937 cultures 1 hour prior to the aggregating antibodies. Results are expressed as the percentage of aggregation relative to the aggregation in the absence of blocking antibody (column labeled 0 in each panel). Means that differ significantly from control (absence of inhibitory antibody,P < .05) are shown with an asterisk. Antibodies were tested at a series of dilutions, starting with the most dilute and increasing in 2-fold steps along the x-axis. To obtain the actual concentration of antibody at each point (in μg/mL), the x-axis value should be multiplied by 0.5 for both CLB-LFA1 (CD18, □) and BU86 (CD18, ■). (B) CD98 ligation does not alter cell-surface levels of CD18 or CD29. U937 cells were incubated in the presence of CD98-AHN-18 (1.5 μg/mL) or control for 24 hours (top panels) or 48 hours (bottom panels). Levels of cell-surface CD18 or CD29 were measured by flow cytometry as described in “Materials and methods.” Note that the 2 fluorescence histograms obtained in the presence and absence of CD98 are almost coincident. Histograms marked C are the fluorescence profile of CD98-treated cells stained with isotype control.
U937 cells express relatively little β2 integrin at their cell surface, and the majority is retained within intracellular vesicles. One mechanism of action for CD98 might therefore be to cause a redistribution of CD18 to the cell surface. The cell-surface levels of both β1- and β2-integrin chains were therefore measured following CD98 ligation, by means of directly fluoresceinated anti-CD18 or anti-CD29 antibodies and by flow cytometry. The levels of expression of CD29 and CD18 were unchanged, however, following CD98-AHN-18–induced aggregation (Figure 7B).
Inhibition of CD98-induced homotypic aggregation by antibodies to CD147
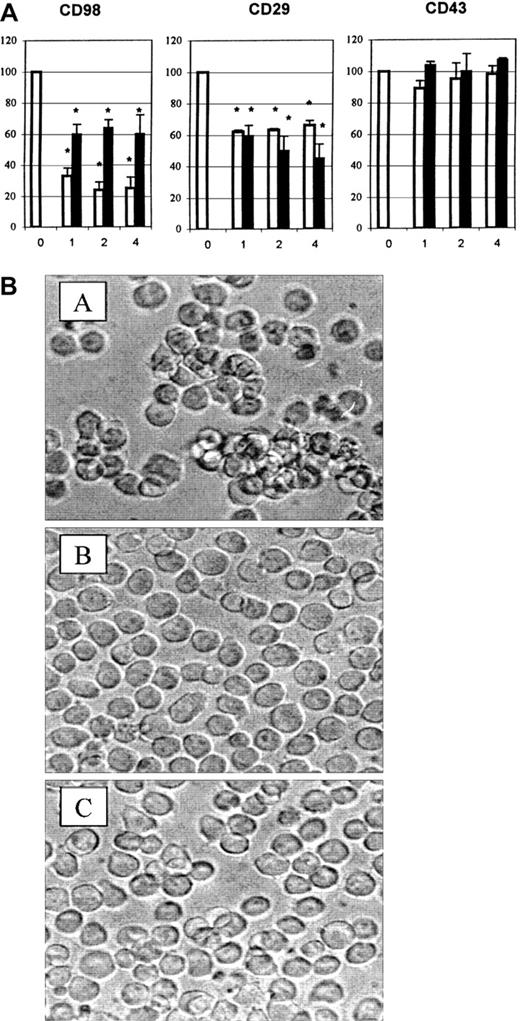
Since inhibition by integrin antibodies was only partial, we tested other antibodies previously shown to be expressed on U937 cells17 for the ability to block CD98-induced aggregation. Unexpectedly, the only significant inhibition was by 2 antibodies to CD147 (Figure 8A, left panel, and Figure8B). The CD147 antibodies also significantly inhibited aggregation induced via CD29 (Figure 8A, middle panel). Neither CD147 antibody inhibited aggregation induced via CD43 (Figure 8A, left panel). Addition of CD147 antibody together with CD18 antibody, CD29 antibody, or all 3 together did not result in further inhibition greater than the level observed with the independent use of each antibody (not shown).
CD147 antibodies block aggregation induced via CD98.
(A) Aggregation was measured under standard conditions in the presence of CD98-AHN-18 (1.5 μg/mL, left panel), MEM 101A (CD29, 0.3 μg/mL, middle panel), or 161-46 (CD43, 0.3 μg/mL, right panel). Blocking antibodies to CD147 were added to U937 cultures 1 hour prior to the aggregating antibodies. Results are expressed as the percentage of aggregation relative to the aggregation in the absence of blocking antibody (column labeled 0 in each panel). Means that differ significantly from control (absence of inhibitory antibody,P < .05) are shown with an asterisk. Antibodies were tested at a series of dilutions, starting with the most dilute and increasing in 2-fold steps along the x-axis. To obtain the actual concentration of antibody at each point (in μg/mL), the x-axis value should be multiplied by 1.2 for MEM M6/1 (CD147, □) and 1.1 for H84AF (CD147, ■). (B) U937 cells were incubated in medium alone (i), CD98-AHN-18 (1.5 μg/mL) (ii), or CD98-J3 and MEM M6/1 (CD147, 1.2 μg/mL) (iii) for 6 hours, as described in “Materials and methods.” Images of cells in culture at this time point were obtained by means of an inverted phase contrast microscope, attached to a video camera, and captured with NIH image software.
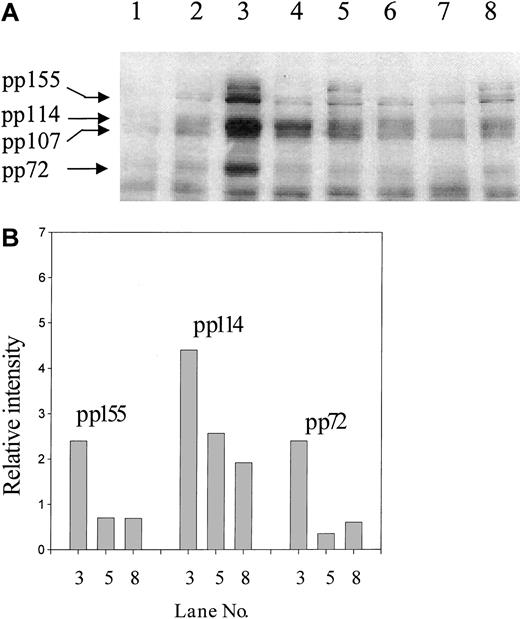
To establish whether CD147 was involved in the induction (signaling) phase of CD98-induced aggregation, the influence of CD147 antibodies on CD98-AHN-18–induced tyrosine phosphorylation was examined (Figure9). The presence of CD147 antibody, as well as the blocking CD98 antibody BU89, almost completely blocked phosphorylation of the 72- and 155-kd band induced by CD98-AHN-18 ligation (lanes 3 and 5). Phosphorylation of the band(s) at around 114 kd was less strongly inhibited. CD147 also partially inhibited CD29-induced tyrosine phosphorylation (lanes 4 and 6). CD147 ligation alone did not induce any changes in protein tyrosine phosphorylation (Figure 9, lane 2). CD147 antibodies did not alter the level of CD98 expression when added 4, 9, or 24 hours before staining (data not shown).
CD147 regulates tyrosine phosphorylation induced via CD98 or CD29 ligation.
(A) U937 cells were incubated in the presence of CD98-AHN-18 (1.5 μg/mL), MEM 101A (CD29, 0.5 μg/mL), MEM M6/1 (CD147, 2.5 μg/mL), BU89 (CD98, 2.3 μg/mL), or combinations of these antibodies for 20 minutes. Cells were lysed and analyzed for phosphotyrosine proteins as described in “Materials and methods.” Molecular weights of the major phosphorylated species are shown on the left and were calculated by image analysis of the Western blot, with the use of molecular weight standards to calibrate the software. Lane 1, isotype control; lane 2, MEM M6/1 (CD147); lane 3, CD98-AHN-18; lane 4, MEM 101A (CD29); lane 5, CD98-AHN-18 + CD147; lane 6, MEM 101A (CD29) + CD147; lane 7, BU89 (CD98); lane 8, CD98-AHN-18 + BU89 (CD98). (B) The relative intensities of the major phosphotyrosine species in bands 3, 5, and 8, calculated by means of gel image analysis software.
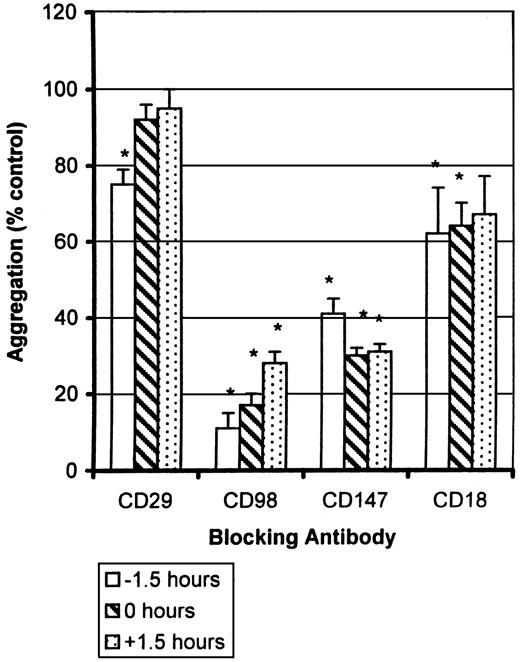
Finally, to try to distinguish further between induction and effector (cell-cell binding) phases of the CD98-AHN-18–induced homotypic aggregation, we tested the ability of the various antibodies to block aggregation when added either prior to, simultaneously with, or after addition of the agonist antibody CD98-AHN-18 (Figure10). CD29 antibody MAR4 blocked CD98-AHN-18–induced aggregation when added 1.5 hours before addition of CD98-AHN-18, but not when added simultaneously or 1.5 hours afterwards. In contrast, antibodies to CD98 itself, to CD18, and to CD147 inhibited to the same extent whether added before CD98-AHN-18 or up to 1.5 hours afterwards.
Sensitivity of CD98-induced aggregation to blocking antibodies added at different times.
U937-cell aggregation was measured under standard conditions in the presence of CD98-AHN-18 (1.5 μg/mL). Antibodies to CD29 (MAR4, 0.5 μg/mL), CD98 (BU89, 1.2 μg/mL), CD147 (MEM M6/1, 1.6 μg/mL), and CD18 (CLB-LFA1, 1.5 μg/mL) were added to the culture before, together with, or after the aggregating antibody as shown. Results are expressed as percentage of aggregation relative to the aggregation in the absence of blocking antibody (column labeled 0 in each panel). Means that differ significantly from control (absence of inhibitory antibody,P < .05) are shown with an asterisk.
Discussion
The diversity of responses in which the 85-kd type II membrane protein, CD98, has been implicated supports the notion that the molecule probably plays a key role in cell-cell interaction and signaling, but (perhaps because of CD98 diversity and ubiquity) this role remains poorly understood. Our recent studies identified CD98 as a major component of the human dendritic cell surface16 and confirmed earlier reports15 that it is involved in T-cell costimulation.17,18 During the course of these studies, however, we also confirmed previous reports10 that some CD98 antibodies induced homotypic aggregation of the U937 cell line, and we focused on this model system to dissect the molecular basis of CD98 function, because of the advantages of working with a uniform cell line rather than a mixed population of T cells and antigen-presenting cells.
A reproducible quantitative assay of U937 homotypic aggregation was developed as a prelude to pharmacological and molecular dissection of CD98 function, and the results from this assay form the basis for the present study. It was clear from this assay that CD98 antibodies are highly heterogenous both in function and in the ability to bind to CD98 on the U937 cell surface (Figure 1). It seems unlikely that this heterogeneity simply reflects concentration or affinity of the antibodies used, since each antibody was tested over a wide range of concentrations. The heterogeneity is very reminiscent of aggregation induced by anti–β1-integrin antibodies25 and presumably reflects the presence of specific conformational epitopes on the CD98 molecule, only some of which are involved in stimulating the downstream signaling cascade that leads to aggregation. A cross-linking event, rather than a direct physical effect of antibody binding to CD98, is also suggested by the requirement for divalent Fab2fragments and by the lack of correlation between antibody-binding levels and aggregation. Indeed, very high levels of CD98 occupancy, by either intact antibody or Fab2 fragments, result in lower levels of aggregation, perhaps because cross-linking by antibody becomes less efficient under conditions of antibody excess.
The next question we addressed, using the same assay, was the relationship between CD98 and other cell-surface molecules thought to have a role in cell-cell interaction. The functional association between CD98 and CD29 (β1 integrin) in the cell membrane6,26 is well documented and has led to the suggestion that CD98 signaling into the cell is in fact mediated via integrin activation. No clear biochemical data showing interaction between CD98 and CD29 in the cell membrane have been published, although a recent study has shown that CD98 can associate with isolated cytoplasmic portions of some β1-integrin isoforms.5 The results from the present study support the general hypothesis that there is a close link between β1 integrin and CD98 function, but not the suggestion that CD98 functions simply by cross-linking β1 integrins. Specifically, although aggregation by both CD29 antibodies and CD98 antibodies share many properties, such as a requirement for an intact cytoskeleton, and although there is some cross-inhibition by antibodies to the 2 molecules, significant differences between the 2 pathways exist. Thus, β1-integrin–mediated aggregation is completely abrogated by EDTA, reflecting the fact that both integrin chains require divalent cations for activity. In contrast, CD98-induced aggregation is EDTA insensitive. An intact integrin heterodimer cannot therefore be an essential intermediate for CD98-induced signaling in these cells. Furthermore, the initial phase of signaling via CD98 appears to be much more sensitive to the metabolic inhibitor deoxyglucose, again suggesting a pathway distinct from that induced via CD29. Finally, the pattern of protein tyrosine phosphorylation induced via CD98 appears to be quite distinct from that induced via CD29, though some substrates of phosphorylation appear to be shared between the 2 pathways. The identity of the phosphorylated proteins remains unknown, although some likely candidates, including focal adhesion kinase, vinculin, and CD29 itself have been ruled out.23 CD98 itself is also not tyrosine phosphorylated23 (seen also in our unpublished data), and indeed its sequence does not contain any known tyrosine phosphorylation motif.
Several features of the CD29/CD98 results presented in this paper suggest that CD29 molecules play a role in the inductive phase of the response, rather than mediating the actual cell-cell adhesion. First, the CD29 antibody that inhibited aggregation induced via CD98 is not the same as the one that blocks the ability of β1 integrins to bind their ligand (eg, fibronectin) in other systems. For example, the antibody P5D2 blocks aggregation induced by the agonist CD29-directed antibody MEM 101A and also blocks the ability of β1 integrins to bind extracellular substrates,6,24 but does not influence CD98-induced aggregation at all. Conversely, MAR4, which does not block binding of β1-integrin dimers to extracellular substrates,25 does inhibit CD98-induced aggregation. Secondly, MAR4, the CD29 antibody that does block CD98-induced aggregation, does so when added prior to CD98, but not after CD98, even though significant aggregation does not occur until 2 to 3 hours postactivation. These results suggest that antibody blocking may reflect interference in CD98/CD29 interaction in the membrane, rather than reflecting a block of CD29/ligand interaction in mediating the cell-cell binding event itself.
In contrast, antibodies to β2 integrins block aggregation even when added after CD98, consistent with a role in the actual cell-cell binding step. A role for β2 integrins in mediating both homotypic27 and heterotypic20 aggregation is now well documented. However, in comparison with other systems, the role of the β2 integrins here seems minor, since aggregation is blocked only by approximately 20% to 30%. Furthermore, no significant inhibition of aggregation was observed by anti–ICAM-1, -2, or -3 antibodies, perhaps because of significant overlap in the function of these molecules as β2-integrin ligands.
The blocking of CD98-induced aggregation by CD147 was an unexpected finding. CD147 is a member of the immunoglobulin superfamily, originally believed to be involved in blood-brain barrier function.28 However, CD147 knockouts did not reveal any defect in this function, but showed some behavioral and immunological abnormalities.29 The ligand (if such a molecule exists) for CD147 has not been described, and hence the partner for its role in mediating cellular aggregation remains unknown. Most intriguingly, however, recent reports have identified some striking parallels between CD147 and CD98. CD147 associates physically with β1 integrins in the membrane,30 as does CD98 with isolated cytoplasmic β1 domains.5 Antibodies to both molecules can induce aggregation of U937 cells, and the aggregation appears to be mediated in part by β2-integrin activation.31 Levels of CD98 and CD147 correlate on T cells, with high levels in the thymus, low levels in resting mature T cells, and higher levels on activated mature T cells.32 Finally and most intriguingly, it appears that CD147, like CD98, is acting as a chaperone for multimembrane-spanning transporter molecules. In the case of CD98, these are amino acid transporters33; in the case of CD147, they are the monocarboxylate transporter family of proton-linked monocarboxylic acid transporters.34
In CD98-mediated U937 aggregation, it is unclear whether CD147 is acting as an ancillary adhesion molecule or mediates the aggregation event itself. The inhibitory action of CD147 is manifest even when antibody is added 1.5 hours after CD98-AHN-18, consistent with a possible role for CD147 in mediating the cell-cell binding. However, an alternative hypothesis for these data is that continuous signaling via CD98 is required to produce aggregation and that CD147 interferes with this signaling event or even sends negative signals that oppose CD98-induced changes. This model is consistent with the observation that CD147 ligation profoundly inhibits the tyrosine phosphorylation induced by CD98-AHN-18 ligation.
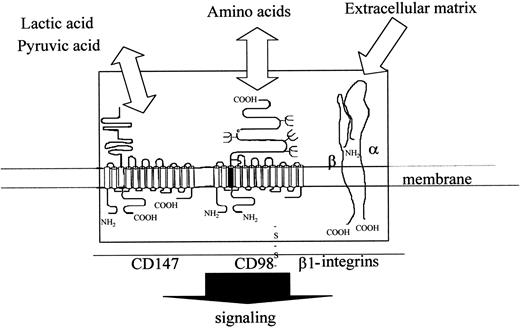
The data presented above, taken together with previous data on this pleiotropic molecule, suggest that CD98 is a central component within a multimolecular complex that can regulate outcomes as diverse as adhesion, growth, differentiation, and antigen presentation. These data prompt us to suggest a speculative model that links CD98-induced aggregation, the central role of β1 integrins in CD98 function, the involvement of CD147, and the curious structural parallels between this molecule and CD98 (Figure 11). This envisages that CD98 forms one component of a “sensory complex,” containing β1 integrins, CD98, and CD147, together with all their associated transporter molecules. The complex induces signals, perhaps via the transporter molecules themselves, to regulate multiple aspects of cell physiology. Parameters that would regulate the function of such a complex may include extracellular matrix, levels of amino acids, and levels of carboxylic acids (eg, lactic acid) that are found in their environment. Work is therefore in progress to determine how this complex might function at a molecular level.
Model of possible functional complex containing CD98 (heavy and light chains, β1-integrins (α/β chains) and CD147 (heavy and light chains).
The figure shows the 3 components of the CD98 signaling complex and their topology within the plasma membrane.
Model of possible functional complex containing CD98 (heavy and light chains, β1-integrins (α/β chains) and CD147 (heavy and light chains).
The figure shows the 3 components of the CD98 signaling complex and their topology within the plasma membrane.
The publication costs of this article were defrayed in part by page charge payment. Therefore, and solely to indicate this fact, this article is hereby marked “advertisement” in accordance with 18 U.S.C. section 1734.
References
Author notes
Benjamin Chain, Department of Immunology, Windeyer Institute of Medical Sciences, UCL, 46 Cleveland St, London W1T 6JF, United Kingdom; e-mail: b.chain@ucl.ac.uk.


This feature is available to Subscribers Only
Sign In or Create an Account Close Modal