Abstract
Although osteolysis is a common complication in patients with multiple myeloma (MM), the biologic mechanisms involved in the pathogenesis of MM-induced bone disease are poorly understood. Two factors produced by stromal-osteoblastic cells seem critical to the regulation of bone resorption: osteoprotegerin (OPG) and its ligand (OPGL). OPGL stimulates osteoclast differentiation and activity, whereas OPG inhibits these processes. The present study investigated whether myeloma cells affect physiologic OPG/OPGL balance in the bone marrow (BM) environment. Ten human myeloma cell lines and myeloma cells isolated from 26 consecutive patients with MM failed to express OPGL and only rarely produced a low amount of OPG. In a coculture system, human myeloma cells up-regulated OPGL expression but strongly down-regulated OPG production in preosteoblastic (preOB) or stromal cells (BMSCs) of primary human BM at the mRNA and protein levels. This effect, which was dependent on cell-to-cell contact between myeloma cells and BMSCs or preOB, partially involved the integrin VLA-4. In addition, overexpression of OPGL mRNA occurred in ex vivo BM cultures obtained from MM patients as compared with healthy donors, and immunohistochemical staining performed on BM biopsy specimens showed an increase of OPGL and a reduction of OPG expression in MM patients as compared with healthy subjects. In summary, these data indicate that myeloma cells affect the OPG/OPGL ratio in the BM environment and tend to confirm that the OPG/OPGL system is involved in the pathogenesis of MM-induced bone disease.
Introduction
Multiple myeloma (MM) is a plasma cell malignancy localized in the bone marrow (BM) and characterized by a high capacity for bone destruction.1 Almost all patients with MM have early osteolytic lesions, which result mainly from increased bone resorption related to stimulation of osteoclastic recruitment and activity in the immediate vicinity of myeloma cells.2-5Although myeloma cells are known to induce excessive osteoclastic bone resorption, the biologic mechanisms involved in the pathogenesis of MM-induced bone disease are still unclear. Recently, 2 molecules belonging to the tumor necrosis factor (TNF) receptor ligand superfamily, osteoprotegerin (OPG) and its ligand (OPGL), have been identified as critical elements in the regulation of osteoclast activity, thereby establishing a new paradigm in bone biology. Extensive studies have shown that OPG and OPGL exert joint control of bone resorption.6-8 OPGL, also known as TNF-related activation-induced cytokine (TRANCE) and receptor activator of NF-kB ligand (RANKL),9,10 is expressed by osteoblastic cells and induces osteoclast differentiation and activation directly by binding to its receptor (RANK) on osteoclastic cells.11 OPG is a naturally occurring soluble factor that antagonizes the effects of OPGL, thereby preserving the integrity of bone mass.6 The biologic importance of this system is highlighted by the presence of severe osteoporosis in OPG knockout mice and the development of osteopetrosis in transgenic mice overexpressing OPG or in OPGL knockout mice.6,12 13 Because OPG and OPGL are likely to play a pivotal role in the control of bone resorption, the present study investigated whether myeloma cells express OPG/OPGL or, alternatively, affect their expression in the BM environment. We show that myeloma cells are able to induce increased OPGL expression and decreased OPG production in vitro and in vivo.
Patients, materials, and methods
Reagents
Recombinant human interleukin-6 (rhIL-6) was kindly provided by Novartis Pharma (Basle, Switzerland). Human soluble IL-6Rα was purchased from R&D Systems (Minneapolis, MN), and IL-1β was from Genzyme (Cambridge, MA).
Cells and culture conditions
Human cell lines.
Human myeloma cell lines (HMCLs) XG-1, XG-6, and MDN were established in our laboratory and cultured as described previously.14HMCL U266 and osteosarcoma cell line Saos-2 were obtained from the American Type Culture Collection (Rockville, MD); HMCL LP-1, OPM-2, and NALM-6 were purchased from DSM (Braunschweig, Germany); and JJN-3 was a gift from Dr Van Camp (Brussels, Belgium).
Human bone marrow stromal cells (BMSCs) and osteoprogenitor cells (preOBs).
BM mononuclear cells were isolated by Ficoll-Hypaque density sedimentation from BM samples of healthy subjects, and primary BMSCs were obtained after 2 to 4 weeks of culture of adherent cells in α-modified Eagle medium (MEM) supplemented with 15% fetal calf serum (FCS) and 2 mM glutamine. To induce the osteoblast phenotype (preOBs), we incubated BM cells recovered after the attachment period (3-5 days) in α-MEM medium with 15% FCS and 2 mM glutamine in the presence of ascorbic acid (50 mg/mL) and dexamethasone (10−8 M) for 2 to 4 weeks, as described previously.15 For some experiments, confluent preOBs were incubated in the presence or absence of IL-1β (10 ng/mL) and IL-6 (100 ng/mL) plus sIL-6Rα (250 ng/mL) for 24 hours.
Coculture.
In coculture experiments, HMCLs or NALM-6 or freshly isolated myeloma cells (10 × 106 cells) were added directly to confluent BMSCs or preOBs (2 × 10⁶) or placed in a transwell insert (0.45 μM pore size) (Falcon, Oxford, United Kingdom) for 24 hours in 5 mL RPMI 1640 medium supplemented with 2% FCS. In some experiments, HMCLs were pretreated for 20 minutes in the presence of VLA-4 monoclonal antibody (mAb clone 2B4; R&D Systems, Abingdon, United Kingdom) (10 μg/mL) or anti–immunoglobulin G (IgG) control, and these antibodies were maintained throughout the coculture period. In a series of experiments, HMCLs or BMSCs/preOBs were fixed for 20 minutes in phosphate-buffered saline (PBS), 1% paraformaldehyde at 4°C, and then washed 3 times in PBS before being used in cocultures.
Patients
Twenty-six consecutive patients with a plasma cell malignancy were studied for OPG and OPGL expression (11 women and 15 men; mean age, 64 ± 10 years; plasmacytosis range, 8% to 70%), including 21 with MM (15 at diagnosis and 6 at relapse) and 5 with plasma cell leukemia (PCL). Fifty-seven percent of the patients presented osteolytic lesions on bone radiography, and 23% had hypercalcemia.
Primary myeloma cells were isolated from BM aspiration or peripheral blood. Myeloma cells were purified on a magnetic cell sorting (MACS) separator (Miltenyi Biotec, Bergisch Gladbach, Germany) using magnetic microbeads coupled to CD138, as described previously.16 Only cell populations with purity above 99.5% were used for experiments.
For ex vivo experiments, all mononuclear cells obtained after Ficoll-Hypaque sedimentation from myeloma BM samples (without myeloma cell depletion) were maintained in conditions similar to those for BM samples from healthy subjects. Medium and nonadherent cells were then washed out, and adherent stromal cells were detached with PBS/EDTA for RNA extraction.
RNA isolation and reverse transcriptase–polymerase chain reaction amplification
For semiquantitative polymerase chain reaction (PCR) analysis, total cellular RNA was extracted from cells using Trizol reagent (Life Technologies, Cergy-Pontoise, France). All RNAs were randomly reverse transcribed with 400 U Moloney murine leukemia virus reverse transcriptase (RT; Life Technologies) according to the manufacturer's protocol. cDNAs were amplified by PCR with the following specific primer pairs: OPGL, sense 5′-AGCACATCAGAGCAGAGAAAGC-3′ and antisense 5′-CAGTAAGGAGGGGTTGGAGACC-3′; OPG, sense 5′-CTTGCCCTGACCACTACT-3′ and antisense 5′-TTGCCGTTTTATCCTCTC-3′; and β-actin, sense 5′-ATCTGGCACCACACCTTCTACAATGAGCTGCG-3′ and antisense 5′-CGTCATACTCCTGCTTGCTGATCCACATCTGC-3′. PCR reactions were performed in a thermal cycler (PCR Express; Hybaid, Ashford, United Kingdom) for 30 cycles. PCR products were subjected to electrophoresis on 1% agarose gel, followed by staining with ethidium bromide. The intensity of bands (464 bp for OPGL, 521 bp for OPG, and 802 bp for β-actin) was analyzed by density and normalized with β-actin.
Determination of OPG levels
The amount of OPG in conditioned media was determined by enzyme-linked immunosorbent assay (ELISA) performed in 96-well immunoplates (Nunc, Taastrup, Denmark) using a standard procedure. Briefly, wells were coated overnight with 100 μL anti–hOPG mAb (clone 69127.11; R&D Systems) at 2 μg/mL, then blocked and incubated with samples for 2 hours. After 3 washes, the plates were incubated with biotinylated anti–hOPG mAb (R&D Systems) at 200 ng/mL for 2 hours and then with streptavidin-horseradish peroxidase (HRP) conjugate (1:200) and tetramethylbenzidine (TMB) substrate solution for 20 to 30 minutes. The reaction was stopped with 1 M phosphoric acid, and absorbance was determined at 450 nm, with correction at 540 nm, using a microplate autoreader (Bio-Tek Instruments, Montigny, France). The sensitivity range of the ELISA was 31.2 to 2000 pg/mL, with intra-assay and interassay coefficients of variation of 0.4% and 15%, respectively. Statistical analysis was performed using analysis of variance for repeated measurements, followed by a Tukey-Kramer posttest.P < .05 was considered significant. Results are expressed as the mean ± SE.
Immunoblot analysis
BMSCs/preOB cells alone or in coculture with HMCLs were detached with PBS/EDTA, 1 mM, and resuspended in 120 μL lysis buffer (10 mM Tris-HCl, pH 7.6, 150 mM NaCl, 5 mM EDTA, 2 mM phenylmethylsulfonyl fluoride [PMSF], 2 mg/mL aprotinin [Sigma, St Louis, MO], and 1% Triton X-100). HMCLs alone were directly resuspended in 120 μL lysis buffer. COS-7 cells lipofected with plasmid expression vector pCEP4, pCEP4-murine OPGL (Amgen, Thousand Oaks, CA), were used as a positive control. After 40 minutes on ice, lysates were cleared by centrifugation at 12 000g for 30 minutes at 4°C. Proteins were separated by sodium dodecyl sulfate polyacrylamide gel electrophoresis using 10% polyacrylamide gels and transferred onto polyvinylidene difluoride membrane. After blocking, membranes were incubated overnight with polyclonal goat anti–RANKL antibody (N-19; Santa Cruz Biotechnology, Cambridge, MA). After washing, membranes were incubated with an HRP-conjugated anti–goat antibody at room temperature for 30 minutes. Blots were then developed using the Supersignal West Dura Extended Duration Substrate detection system (Pierce, Rockford, IL).
Immunohistochemistry
Immunohistochemical staining was performed on BM specimens obtained from patients with MM (n = 15), 10 of them with bone lesions (osteolysis and/or osteoporosis), and normal controls (n = 5). All samples were fixed in B5-formalin mixture, decalcified by EDTA, and embedded in paraffin. Serial sections (3 μm thick) were processed for immunohistochemical staining with anti–hOPG mAb (clone 69127.11, R&D Systems; working dilution 1:100) or anti–hRANKL mAb (clone 70525.11, R&D Systems; working dilution 1:20) using the immunoperoxidase technique (Dako LSAB2 System; HRP, Dako, Carpinteria, CA). Briefly, endogenous peroxidase activity was blocked with 3% H2O2 in distilled water for 8 minutes. Slides were incubated with primary mAbs for 60 and 30 minutes, respectively, followed by biotinylated anti–mouse IgG and streptavidin-HRP for 10 minutes. Finally, the peroxidase reaction was developed with 3,3′-diaminobenzidine and counterstained with hematoxylin. All incubations were performed at room temperature. An antivimentin mAb and an antifibronectin mAb (Dako; working dilutions 1:50 and 1:2000, respectively) were used to identify stromal cells. As a negative control, primary antibodies were omitted or replaced with an isotype control-matched mAb with irrelevant specificity. Statistical analysis was performed using Student t test. P < .05 was considered significant. Results are expressed as the mean ± SE.
Results
OPG and OPGL expression in HMCLs and highly purified myeloma cells
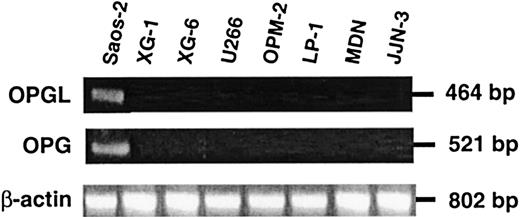
The expression of OPG and OPGL mRNA in HMCLs and freshly isolated myeloma cells was evaluated initially by RT-PCR with the Saos-2 osteoblastic cell line as positive control. No OPGL mRNA expression was detected in the 10 HMCLs tested: XG-1, XG-6, U266, MDN, LP-1, OPM-2, JJN-3, NCI-H929, BCN, and ANBL-6 (results for the first 7 HMCLs are shown in Figure 1). OPGL mRNA was also undetectable in freshly purified myeloma cells obtained from 26 consecutive MM patients (Table 1). In addition, the 10 HMCLs tested were negative for OPG mRNA, and OPG protein levels were undetectable in 24-hour conditioned medium. However, OPG mRNA was detected in 3 of 26 patients, and OPG was produced by fresh myeloma cells isolated from 2 of 2 patients positive for OPG RT-PCR (0.28 and 0.52 ng/mL, respectively) (Table 1). No correlation was found between these results and the presence or absence of osteolytic lesions and/or hypercalcemia.
HMCLs express neither OPGL nor OPG mRNA.
Analysis of the expression of OPGL, OPG, and β-actin mRNA by RT-PCR in HMCLs. The osteosarcoma cell line Saos-2 was used as positive control.
HMCLs express neither OPGL nor OPG mRNA.
Analysis of the expression of OPGL, OPG, and β-actin mRNA by RT-PCR in HMCLs. The osteosarcoma cell line Saos-2 was used as positive control.
OPG/OPGL in highly purified myeloma cells
| Patient . | Age, y . | Sex . | Type . | PC% . | Status . | Osteolysis . | HyperCa . | OPGL mRNA . | OPG mRNA . | OPG ng/mL . |
|---|---|---|---|---|---|---|---|---|---|---|
| 1 | 51 | F | Gκ | 35 | S-PCL | + | ? | − | − | ND |
| 2 | 56 | F | Gκ | 58 | D | + | + | − | − | ? |
| 3 | 64 | M | Gκ | 70 | P-PCL | − | − | − | − | ND |
| 4 | 68 | M | Aκ | 55 | D | − | − | − | − | ND |
| 5 | 49 | M | Gκ | 35 | P-PCL | + | + | − | + | ? |
| 6 | 67 | F | Gλ | 8 | R | + | − | − | − | ND |
| 7 | 75 | M | Gλ | 14 | D | − | − | − | − | ? |
| 8 | 63 | F | Aκ | 20 | D | + | − | − | − | ND |
| 9 | 78 | M | Gλ | 12 | D | + | − | − | − | ND |
| 10 | 58 | F | Aκ | 45 | D | + | + | − | − | ? |
| 11 | 46 | M | Gκ | 50 | D | + | − | − | − | ND |
| 12 | 72 | M | Aκ | 30 | D | − | − | − | − | ND |
| 13 | 60 | M | κ | 46 | P-PCL | + | + | − | − | ND |
| 14 | 81 | F | Gκ | 30 | D | + | + | − | − | ND |
| 15 | 63 | M | Aκ | 45 | P-PCL | − | − | − | − | ND |
| 16 | 71 | M | κ | 30 | R | + | − | − | − | ND |
| 17 | 65 | F | Gκ | 40 | R | − | − | − | − | ND |
| 18 | 43 | F | λ | 27 | D | − | − | − | − | ND |
| 19 | 76 | F | κ | 20 | D | − | − | − | − | ND |
| 20 | 64 | M | Gκ | 20 | R | + | − | − | + | 0.28 |
| 21 | 60 | M | Gλ | 17 | R | + | + | − | − | ND |
| 22 | 63 | M | A | 13 | R | − | − | − | − | ND |
| 23 | 77 | F | Gκ | 45 | D | − | − | − | − | ND |
| 24 | 81 | M | Aκ | 30 | D | + | − | − | − | ND |
| 25 | 65 | M | Gλ | 10 | D | − | − | − | + | 0.52 |
| 26 | 52 | F | Gκ | 50 | D | + | − | − | − | ND |
PC% indicates plasma cell percentage; OPGL, osteoprotegerin ligand; OPG, osteoprotegerin; F, female; S-PCL, secondary plasma cell leukemia; +, present; ?, not determined; −, absent; ND, not detectable; D, multiple myeloma at the diagnosis; M, male; P-PCL, primary plasma cell leukemia; and R, multiple myeloma relapse.
OPG and OPGL mRNA expression in BMSCs and preOB cells: cytokine effect
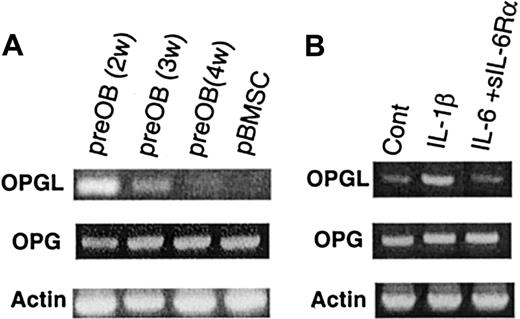
The expression of OPG and OPGL mRNA was studied in primary human BMSCs obtained from healthy donors. In basal conditions, OPG mRNA was expressed, but little or no OPGL mRNA was found. PreOB cells expressed both OPGL and OPG mRNA, and the OPGL/OPG ratio was time dependent. Maximal OPGL expression occurred after 2 weeks, decreased at 3 weeks, and was no longer detectable after 4 weeks of culture (Figure2A). These results were in relation to the osteoblast phenotype assessed by PTH receptor and alkaline phosphatase expression, and by the formation of bone mineral nodules (stained by alizarin red) after 4 weeks when β-glycerophosphate (10 mM) was added to the medium during the last 48 hours of culture (data not shown). Semiquantitative RT-PCR was used to evaluate the effect of IL-1β (10 ng/mL) and IL-6 (100 ng/mL) plus soluble IL-6Rα (250 ng/mL) on OPG and OPGL mRNA expression in preOBs. IL-1β increased OPGL expression in preOBs, whereas IL-6 associated with its soluble receptor had no effect (Figure 2B). These cytokines showed no significant effects on OPG mRNA.
OPG and OPGL mRNAs are expressed in the BM environment and are regulated by IL-1β.
(A) OPGL, OPG, and β-actin mRNA were analyzed by semiquantitative RT-PCR in BMSCs and in preOBs at 2 to 4 weeks of culture. (B) Effect of IL-1β (10 ng/mL) or IL-6 (100 ng/mL) plus sIL-6Rα (250 ng/mL) on OPGL and OPG mRNA expression by preOBs. The figures are representative of 3 independent RT-PCR reactions. Cont indicates control.
Effect of HMCLs on OPGL expression in coculture
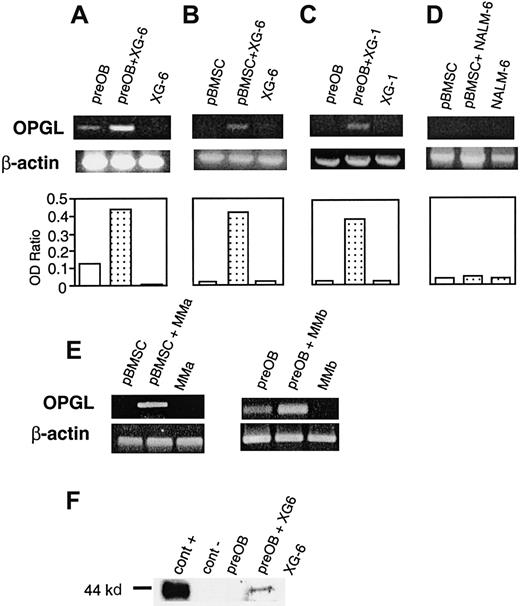
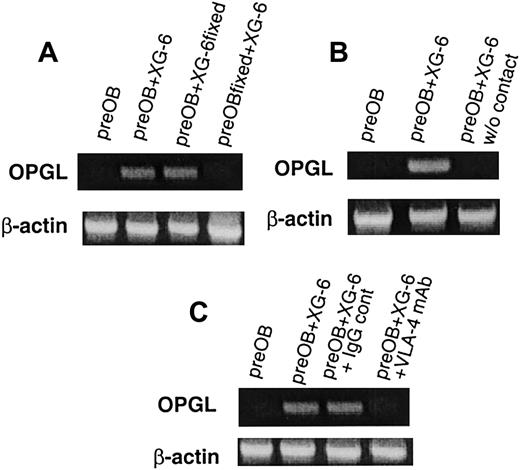
A coculture system with BMSCs or preOB cells was used in further investigations to determine whether myeloma cells affected OPGL expression. When XG-6 or XG-1 was added to confluent preOBs or BMSCs, an up-regulation of OPGL mRNA was observed, as shown for one representative experiment (Figure 3A-C). Conversely, the pre–B-cell line NALM-6 had no effect on OPGL mRNA expression by BMSCs (Figure 3D) or preOBs (data not shown). Similar induction of OPGL mRNA was obtained using freshly isolated myeloma cells from 2 patients (Figure 3E). The effect on OPGL at the protein level was also evaluated by immunoblot analysis. OPGL expression by preOB cells was not detectable in basal conditions, but the positive control (COS-7 transfected with OPGL cDNA) confirmed that a band of about 44 kd in the coculture corresponded to OPGL (Figure3F). A series of coculture experiments with fixed cells indicated in which cells the regulation of OPGL expression occurred. When fixed BMSCs/preOBs were used with nonfixed XG-6, RT-PCR showed no effects on OPGL expression. However, OPGL was up-regulated in cocultures with nonfixed BMSCs/preOBs and fixed XG-6, which suggests that the effect occurred in BMSCs/preOBs and not in myeloma cells (Figure4A). To evaluate the role of cell-to-cell contact, we placed XG-6 cells in a transwell insert before adding them to preOBs/BMSCs. In these conditions, no effect on OPGL mRNA was observed, as shown in one representative experiment (Figure 4B). Moreover, 48-hour conditioned media of XG-6 had no effect on OPGL expression in BMSCs/preOBs (data not shown). Because VLA-4 is essential to interactions between myeloma cells and the BM environment, its potential role in myeloma-induced OPGL overexpression was studied. The induction of OPGL mRNA expression by XG-6 was strongly inhibited when a VLA-4 mAb (10 μg/mL) was added to the coculture, whereas no inhibitory effect was observed when an IgG control was added (Figure 4C).
HMCLs up-regulate OPGL expression in coculture.
Semiquantitative RT-PCR analysis of OPGL and β-actin mRNA in the following coculture systems: XG-6 with preOBs (A) or with BMSCs (B), XG-1 with preOBs (C), pre–B-cell line NALM-6 with BMSCs (D), and primary myeloma cells isolated from 2 patients with BMSCs or preOBs (E). Graphics represent the mean optical density (OD) of OPGL normalized to the OD of β-actin ( = OD ratio) of representative experiments. (F) Immunoblot analysis of OPGL in the following cellular lysates: COS-7 transfected with OPGL-pCEP4 = cont+ (lane 1), COS-7 transfected with empty pCEP4 = cont− (lane 2), preOBs (lane 3), preOBs and XG-6 after 36 hours of coculture (lane 4), and XG-6 (lane 5).
The induction of OPGL mRNA expression in coculture involves cell-to-cell contact mediated in part by the integrin VLA-4.
Semiquantitative RT-PCR analysis of OPGL and β-actin mRNA in a coculture system with fixed preOBs or fixed XG-6 (A), in the presence of a transwell insert (B), and in the presence of VLA-4 mAb (10 μg/mL) compared with an IgG control (C). The figures are representative of 3 independent RT-PCR reactions of repeated experiments.
Effect of HMCLs on OPG expression in coculture
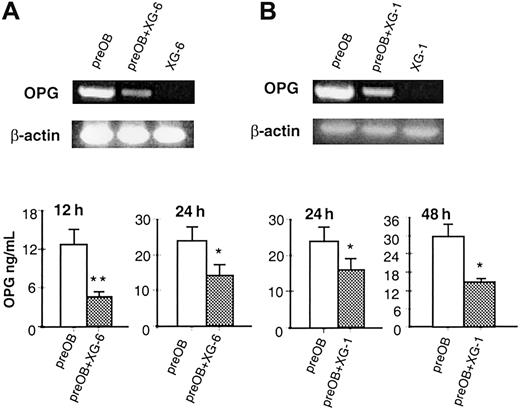
The effect of HMCLs on OPG mRNA and OPG protein levels was also evaluated in the coculture system. XG-6 and XG-1 down-regulated OPG mRNA in BMSCs/preOBs (Figure 5A and 5B, respectively), and XG-6 cells induced a significant reduction of OPG levels in coculture: 63% ± 1.8% at 12 hours (4.69 ± 0.7 versus 12.75 ± 2.4 ng/mL; P = .003) and 54% ± 3.9% at 24 hours (12.45 ± 3.62 versus 22.33 ± 3.2 ng/mL;P = .01) (Figure 5A). Similarly, a significant reduction of OPG levels was found when BMSCs/preOBs were incubated with XG-1 cells: 36% ± 1.6% at 24 hours and 48% ± 2.3% at 48 hours (Figure 5B). A reduction of OPG production was also observed, to a lesser extent, at 24 hours in cocultures with freshly isolated myeloma cells from 2 patients (MMa and MMb, 20% ± 3% and 15% ± 4%, respectively).
HMCLs decrease the OPG mRNA expression and OPG secretion in coculture.
Effect of HMCLs XG-6 (A) and XG-1 (B) on OPG mRNA expression by RT-PCR and OPG protein in a coculture system at different times of culture. Aliquots of conditioned media were assessed for OPG levels by ELISA. Graphics represent the mean levels ± SE of 6 repeated experiments. *P = .01; **P = .001.
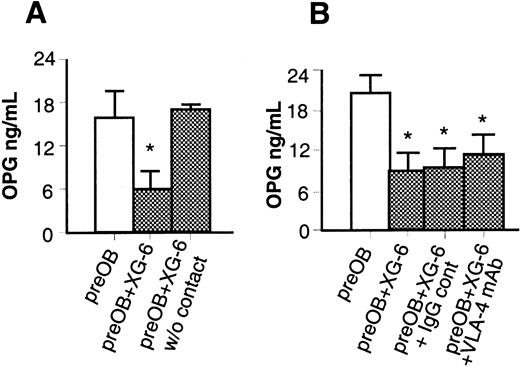
However, when XG-6 cells were placed in a transwell insert and added to BMSCs/preOBs, OPG levels in the supernatant were not reduced compared with those in coculture with cell contact (17.9 ± 0.7 versus 16.78 ± 3.8 ng/mL) (Figure 6A). Although OPGL expression was affected by the addition of anti–VLA-4 (10 μg/mL) to the coculture, this mAb had no effect on OPG production (11.39 ± 3 versus 9.06 ± 3.7 ng/mL) (Figure 6B).
The inhibitory effect of XG-6 on OPG secretion in coculture involves cell-to-cell contact.
Effect of XG-6 on OPG production in coculture system in the presence of a tissue insert in a transwell system (A) or in the presence of VLA-4 mAb compared with an IgG control (B). Aliquots of conditioned media were assessed for OPG concentration by ELISA. Graphics represent the mean levels ± SE of 6 repeated experiments. *P = .01; **P = .001.
OPG/OPGL imbalance in patients with MM
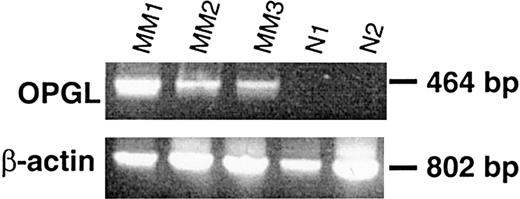
OPGL expression was determined in ex vivo BM adherent cells obtained from specimens of MM patients with osteolytic lesions as compared with those of healthy subjects. Overexpression of OPGL mRNA was observed in BM adherent cells from MM patients (MM1, MM2, and MM3), but no OPGL expression was detected in normal specimens (Figure 7). Moreover, immunohistochemical staining of BM tissue sections confirmed that OPGL protein (Figure8A) and OPG (Figure 8E) were not expressed by myeloma cells. OPG was detectable on osteoblastic and osteoclastic cells, and OPGL on stromal cells. An increase of OPGL-positive stromal cells (Figure 8B,C) and a reduction of OPG expression in trabecular osteoblasts (Figure 8E) were observed in MM patients with bone lesions as compared with patients without bone lesions or control subjects (Figure 8D for OPGL; Figure 8F for OPG) (OPGL-positive/mm2 ± SE: 2.1 ± 0.03 versus 0.91 ± 0.08 and 0.93 ± 0.18, respectively, P < .05; OPG-positive cell percentage ± SE: 3.2 ± 0.7 versus 6.5 ± 1.6 and 6.7 ± 1.2, respectively, P < .05). Moreover, the nodular distribution of myeloma cells seemed to be correlated with a higher number of OPGL-positive stromal cells, with a histologically increased bone resorption, and with the occurrence of osteolytic lesions rather than diffuse myeloma cell invasion.
Ex vivo BM specimens obtained from patients with MM overexpress OPGL mRNA in comparison with those from healthy donors.
All BM mononuclear cells were cultured for 2 weeks, and the expression of mRNA was assessed in adherent cells by semiquantitative RT-PCR analysis in BM samples obtained from MM patients with osteolytic lesions (MM1, MM2, MM3) in comparison with BM samples from healthy donors (N1 and N2).
In vivo OPG/OPGL imbalance in MM patients' BM sections compared with healthy donors.
OPGL immunostaining of (A) infiltrating myeloma cells in the BM of MM patients (original magnification × 100; 12 μm); (B,C) stromal cells in a biopsy specimen from MM patient with osteolytic lesions (original magnification × 20; 50 μm [B] and × 40; 25 μm [C]); and (D) BM biopsy of a healthy subject (original magnification × 20; 50 μm). (E,F) OPG immunostaining in a representative trabecula of an MM patient with osteolytic lesions (E) and a healthy subject (F) (original magnification × 30; 35 μm).
In addition, an ELISA performed for MM patients (n = 30) as compared with a panel of 24 sex-matched healthy subjects (mean age, 62 ± 9 years) showed that OPG serum levels were reduced (mean ± SD: 18.5 ± 6.0 ng/mL versus 26.6 ± 4.8;P = .009).
Discussion
Our investigations of the effect of human myeloma cells on the OPG/OPGL system indicate that these cells are able to induce an imbalance in the OPG/OPGL ratio in the BM environment.
Neither HMCLs nor fresh myeloma cells obtained from patients with MM or PCL produced OPGL directly, and the production of OPG by myeloma cells seems to be an uncommon event (cells of only 3 of 26 patients tested expressed OPG mRNA and produced a small amount of this protein). No correlation was found between OPG production and the presence or absence of bone lesions in our patients, although a larger cohort of subjects would be necessary to confirm this observation. However, OPG production by myeloma cells could be related to the apoptotic process; it has been demonstrated recently that OPG blocks TRAIL-induced apoptosis in Jurkat T cells17 and that TRAIL (TNF-related apoptosis inducing factor) is a potent inducer of apoptosis in myeloma cells.18 Further investigations should clarify this issue.
A coculture with primary BMSCs/preOB cells and HMCLs or primary myeloma cells was established to determine whether myeloma cells have an effect on the OPG/OPGL system through interactions with the bone environment. This experiment showed that myeloma cells induce the expression of OPGL, the final effector of osteoclastogenesis, and decrease that of the bone-protective protein OPG. These effects could be related to the peculiar capacity of myeloma cells within B-cell malignancies to stimulate bone resorption. In fact, no effects were detected in a coculture system involving the human pre–B-cell line NALM-6. Moreover, the presence of a tissue insert in the coculture completely blunted the effect of myeloma cells on the OPG/OPGL system, indicating that this effect was mediated by cell-to-cell contact between myeloma cells and BMSCs/preOBs rather than by direct release of a soluble factor (no effect was observed using the conditioned medium of myeloma cells).
Among the substances involved in myeloma cell adhesion to stromal cells, VLA-4 was investigated for its potential effect on OPG/OPGL imbalance. This integrin, which is responsible for the adhesion of myeloma cells to fibronectin and to vascular cell adhesion molecule-1 expressed by stromal cells, is involved in IL-6 induction in BMSCs.19,20 Our in vitro system showed that addition of VLA-4 mAb to cocultures blunted OPGL induction and dramatically reduced myeloma cell adhesion to stromal cells (data not shown). Thus, the involvement of VLA-4 in OPGL induction may be due to the reduction of myeloma cell adhesion to BMSCs, but other mechanisms could also account for the lack of effect on cell-contact–dependent reduction of OPG. The importance of cell-to-cell contact and the role of VLA-4 in MM-associated bone lesions were demonstrated recently in experiments in which neutralizing VLA-4 mAb prevented enhanced production of osteoclast-stimulating activity and bone destruction in a murine model of MM-induced bone disease.21 Thus, this effect could be mediated at least in part by myeloma cell blockage of OPGL induction in the bone environment.
The involvement of cell contact in our system contrasts with the mechanisms described in a murine model, in which breast cancer cells induced an alteration of the OPG/OPGL ratio in murine stromal cells through direct release of soluble factor PTHrp.22 Some reports have suggested that myeloma cells produce several bone-resorbing factors (IL-1β, IL-6, or TNF-α) directly, but most studies on freshly isolated myeloma cells showed inconclusive results because of the presence of other contaminating cell types.23,24 More recently, it has been shown that myeloma cells induce the release of osteoclastogenic cytokines (especially IL-6) into the microenvironment by an unidentified cell-to-cell contact mechanism.20,23,25,26 However, the OPGL overexpression observed in our model seems unrelated to the high level of IL-6 induced by myeloma cells in the bone environment. In fact, no effect of IL-6 and its soluble receptor was observed on OPGL mRNA expression in human BMSCs, which is consistent with the recent findings of Hofbauer et al.27 Moreover, the addition of blocking antibodies against IL-6, IL-1β, or TNF-α (10 μg/mL) in cocultures did not prevent OPGL up-regulation or OPG down-regulation in BMSCs/preOBs (data not shown). These results seem to exclude the involvement of such cytokines in the regulation of the OPG/OPGL ratio by myeloma cells in BM.
OPG/OPGL expression was evaluated in MM patients to provide a clinical perspective for our in vitro findings. Short-term cultures of BM mononuclear cells obtained from MM patients showed an overexpression of OPGL mRNA in BM adherent cells as compared with those from healthy donors. Enhanced OPGL expression has also been observed in patients with Paget disease; thus, this system may be involved when physiopathologic conditions are characterized by enhanced osteoclastogenesis.28 Moreover, OPGL protein was overexpressed in stromal cells and OPG was reduced in trabecular osteoblasts in BM sections obtained from myeloma patients with osteolytic lesions as compared with those from patients without bone lesions or from healthy subjects. These findings provide direct evidence that MM is associated with imbalance of the OPG/OPGL system in vivo. The immunohistochemical observations seem to indicate that the nodular infiltration of myeloma cells was correlated with a higher number of OPGL-positive stromal cells, an increased bone resorption, and the occurrence of osteolytic lesions rather than diffuse myeloma cell infiltration. In addition, the presence of bone lesions is associated with an increased number of OPGL-positive stromal cells. These results might be confirmed in a larger group of patients.
Furthermore, OPG serum levels were reduced in MM patients as compared with healthy subjects, which corroborates the findings of Ali et al.29 The levels of OPG detected in our panel of sera were higher than those obtained by others, possibly because of the use of different antibodies to perform the ELISA.
In conclusion, our data provide support for the hypothesis that an imbalance of the OPG/OPGL system is involved in myeloma-associated bone destruction. Other investigations in our laboratory have shown that human myeloma cells are able to increase in vitro osteoclastogenesis by CD34+ cells in the presence of BMSCs and that OPG could prevent myeloma-induced osteoclastogenesis (unpublished data, October 2000). Our findings are consistent with those of studies showing that the blockage of OPGL by its natural antagonist OPG could prevent the occurrence of bone disease in a murine model of MM.30 OPG has been shown recently to reduce bone turnover considerably in postmenopausal women31 and hypercalcemia in a murine model of colon cancer,32 and to inhibit skeletal destruction in murine models of induced osteosarcoma33 and bone metastasis.34 In this context, our data suggest that OPG could be used effectively in the management of MM-induced bone disease.
We thank Dr Domenico Corradi for his assistance in the immunohistochemical procedures.
Supported by a grant from Amgen France. N.G. was a visiting fellow supported by the Pays de Loire Region, France.
The publication costs of this article were defrayed in part by page charge payment. Therefore, and solely to indicate this fact, this article is hereby marked “advertisement” in accordance with 18 U.S.C. section 1734.
References
Author notes
Sophie Barillé, INSERM U463, Institut de Biologie, 9 quai Moncousu, 44035 Nantes cedex 01, France; e-mail:sbarille@nantes.inserm.fr.

![Fig. 8. In vivo OPG/OPGL imbalance in MM patients' BM sections compared with healthy donors. / OPGL immunostaining of (A) infiltrating myeloma cells in the BM of MM patients (original magnification × 100; 12 μm); (B,C) stromal cells in a biopsy specimen from MM patient with osteolytic lesions (original magnification × 20; 50 μm [B] and × 40; 25 μm [C]); and (D) BM biopsy of a healthy subject (original magnification × 20; 50 μm). (E,F) OPG immunostaining in a representative trabecula of an MM patient with osteolytic lesions (E) and a healthy subject (F) (original magnification × 30; 35 μm).](https://ash.silverchair-cdn.com/ash/content_public/journal/blood/98/13/10.1182_blood.v98.13.3527/6/m_h82411867008.jpeg?Expires=1769144149&Signature=J4IkvbY9W1van77qR3nLUHPlpvv2~MrrCTw0eUyTqxRPU9Zp7UZRsPck573AyytJk9yomaCx0Jn8LrdI0Xw~SAfbDQOsqyoZurIs31ruKqi0a~xogT63rrDIOKuUmawb9UA9QaGPVYEyJh-uH1P8vrdwJn3BE0vsHQFtxM-9nf9JrBGoP2243sfDPc5WkEpp8rTaNQpMM2hFkRhUQdIzVUqdRzyUGsMv~WtYley0~xZh1Daf5GqHpIhzYpg7yZb321Pzan3sD8hJgHp9iRcTkYhMk4fm7WWayxthEpC0D623V3c-fsI4bQwdrrrNDEev0v4TsWglY55fP5-lImP3kg__&Key-Pair-Id=APKAIE5G5CRDK6RD3PGA)
This feature is available to Subscribers Only
Sign In or Create an Account Close Modal