Abstract
The reciprocal translocation t(1;3)(p36;q21) occurs in a subset of myelodysplastic syndrome (MDS) and acute myeloid leukemia (AML), which is frequently characterized by trilineage dysplasia, in particular dysmegakaryocytopoiesis, and poor prognosis. Previously, the breakpoint cluster region (BCR) at 3q21 was identified within a 60-kilobase (kb) region centromeric to the BCR of 3q21q26 syndrome and that at 1p36.3 within a 90-kb region. In this study, genes were searched near the breakpoints at 1p36.3, and a novel gene was isolated that encoded a zinc finger protein with a PR domain, which is highly homologous to theMDS1/EVI1 gene. The novel gene, designated asMEL1(MDS1/EVI1-like gene 1), with 1257 amino acid residues is 64% similar in nucleotide and 63% similar in amino acid sequences to MDS1/EVI1 with the same domain structure. The MEL1 gene is expressed in leukemia cells with t(1;3) but not in other cell lines or bone marrow, spleen, and fetal liver, suggesting that MEL1 is specifically in the t(1;3)(p36;q21)-positive MDS/AML. On the basis of the positional relationship between the EVI1 and MEL1 genes in each translocation, it was suggested that both genes are transcriptionally activated by the translocation of the 3q21 region with the Ribophorin I gene. Because of the transcriptional activation of the EVI1 family genes in both t(1;3)(p36;q21)-positive MDS/AML and 3q21q26 syndrome, it is suggested that they share a common molecular mechanism for the leukemogenic transformation of the cells.
Introduction
On the long arm of chromosome 3, various types of translocational breakpoints are clustered in the q21 and q26 regions, such as inv(3)(q21q26), t(3;3)(q21;q26), t(1;3)(p36;q21), t(3;5)(q21;q31), t(3;8)(q21;q24), t(3;21)(q26;q22), and t(3;12)(q26;p13).1 We previously characterized chromosomal breakpoints of 3q21q26 syndrome. 3q21q26 syndrome is a group of diseases with a recurrent translocation, inversion, or insertion between the regions of 3q21 and 3q26 and is associated with myelodysplastic syndrome (MDS) or acute myeloid leukemia (AML).2,3 3q21q26 syndrome has specific clinical features, including normal or elevated platelet counts at the initial diagnosis, hyperplasia with dysplasia of megakaryocytes, poor response to chemotherapy, and poor prognosis. We have shown that chromosomal breakpoints at 3q26 are clustered at the 5′ region of theEVI1 gene in t(3;3)(q21;q26) and at the 3′ region in inv(3)(q21q26).4-6 However, the breakpoints at 3q21 in both t(3;3)(q21;q26) and inv(3)(q21q26) are clustered within a 50-kilobase (kb) region near the Ribophorin I (RPN1) gene, which is a member of membrane proteins of rough endoplasmic reticulum. On the basis of these results, it is suggested that the region of 3q21 with the RPN1 gene translocated to the q26 region near theEVI1 gene may activate EVI1 expression as an enhancer element.
Along with 3q21q26 syndrome, a similar type of MDS/AML has been reported to have recurrent t(1;3)(p36;q21) translocations.7-9 Recently, we have identified the breakpoint cluster region (BCR) in 4 cases of t(1;3)(p36;q21)-positive MDS/AML.10 Clinicopathological features of the t(1;3)(p36;q21)-positive MDS/AML are similar to those of 3q21q26 syndrome, including normal or elevated platelet counts, hyperplasia with dysplasia of megakaryocytes, poor response to chemotherapy, and poor prognosis. BCRs were detected within a 60-kb region at 3q21 adjacent to the BCR of 3q21q26 syndrome and within a 90-kb region at 1p36. The BCR in 1p36 was mapped to 1p36.3 by fluorescence in situ hybridization (FISH) and by radiation hybrid mapping analyses.
To identify genes that are involved in leukemogenesis of t(1;3)(1p36;3q21)-positive MDS/AML, we have extensively searched for genes near the BCRs at 3q21 and 1p36. A novel gene encoding a zinc finger protein was isolated near the BCR at 1p36 and is transcriptionally activated in leukemia cells with t(1;3)(p36;q21). Interestingly, the gene, designated as MEL(MDS1/EVI1-like gene 1), was highly homologous to MDS1/EVI1, which is an alternatively spliced transcript of the EVI1 gene. Because of the transcriptional activation of the EVI1 family genes in both t(1;3)(1p36;3q21)-positive MDS/AML and 3q21q26 syndrome, it was suggested that they have a common molecular mechanism for the leukemogenic transformation of the cells.
Materials and methods
Bone marrow and peripheral blood samples from patient leukemia cells with t(1;3)(p36;q21)-positive MDS/AML
The characteristics of 4 cases with MDS overt-AML with t(1;3)(p36;q21) were previously detailed.10 Briefly, 3 of 4 cases showed elevated platelets at initial diagnosis and all of them had dysmegakaryocytopoiesis. All the cases were converted into AML with FAB-M4 in a short period, and the patients died within a short period with poor responsiveness to chemotherapy. Mononuclear cells (MNCs) from patient's blood were separated by centrifugation with the Ficoll-opaque cushion (Pharmacia, Uppasla, Sweden) for further analysis.
Cell lines
Southern and Northern blot analyses
High-molecular-weight DNA was prepared from MNCs and cell lines by proteinase K digestion followed by phenol/chloroform extraction. Ten micrograms of DNA was digested with appropriate restriction enzymes under suitable conditions, subjected to electrophoresis on 0.7% agarose gel, transferred to charged-nylon membranes (Pall BioSupport, East Hills, NY), and hybridized to DNA probes labeled by the random hexamer method.
Poly (A)+RNA from MNCs and cell lines was extracted with a Fast Track messenger RNA (mRNA) Isolation Kit (Invitrogen, Carlsbad, CA) according to the manufacturer's directions. Five micrograms of poly(A)+RNA were electrophoresed, transferred onto nylon membranes, and hybridized to a32P-labeled DNA probe, which was an amplified complimentary DNA (cDNA) clone, using PCR with specified primers.
Construction and screening of cDNA library
cDNA libraries were constructed with poly(A)-selected mRNA from leukemia cells with t(1;3). In brief, oligo(dT)-primed synthesized cDNAs were ligated with EcoRI adapters and cloned intoEcoRI-digested ZAPII cloning vector (Stratagene, La Jolla, CA). After packaging cDNA with commercial packaging kits (Stratagene), phage plaques (1 × 10⁶ pfu) were screened with the probes labeled by a random primer synthesis kit (Stratagene).
Nucleotide sequencing
Nucleotide sequences of genomic clones were determined by the PCR cycling DNA sequence method with a commercial kit (fmolDNA Sequencing System; Promega, Madison, WI), based on the dideoxynucleotide chain termination reaction. Thermo Sequenase II dye terminator cycle sequencing kit (Amersham Pharmacia Biotech AB, Uppsala, Sweden) was used for sequences of cDNA clones.
RT-PCR amplification
One microgram of poly(A)+RNA was transcribed to cDNA either with oligo(dT) primer by avian leukemia virus RT (Seikagaku-Kogyo, Tokyo, Japan) or with random primers, using a cDNA synthesis kit (Amersham, Arlington Height, IL). Of the 20-μL reaction mixture, 0.5 to 2.0 μL was used for PCR amplification. Amplification was performed for 30 cycles in a thermal cycler (PerkinElmer, Norwalk, CT) under the cycling conditions of 1 minute at 96°C, 30 seconds at 60°C, and 2 minutes at 72°C.
Primers prepared for RT-PCR are as follows: hMEL1-F, 5′-TTCTCACTGGCTAGGCCTGG-3′; hMEL1-R, 5′-CAGCCATAGAGACCATGACA-3′; hEVI1-F, 5′-CGAAAGCGAGAATGATCTCC-3′; hEVI1-R, 5′-GGAAGACGTAGTGCTGAACA-3′; GAPDH-F, 5′-CCAAGGTCATCCATGACAAC-3′; and GAPDH-R, 5′-CACCCTGTTGCTGTAGCCA-3′.
FISH analysis
BAC clones, 209F and 273M, and 4 kb of MEL1 cDNA were used for FISH analysis as labeled probes. The probes were labeled by standard nick translation using biotin-11-dUTP (Sigma, St Louis, MO) and purified over Sephadex G50 spin columns (Pharmacia). A biotinylated probe was detected with avidin-fluorescein isothiocyanate (FITC) (Vector Laboratories, Inc, Burlingame, CA), biotinylated goat anti-avidin, and a second layer of avidin-FITC. FISH was performed as described previously.18 Images were captured with a CCD camera (SenSys0400-G1, Photometrics Ltd, Tucson, AZ).
Exon trapping and cDNA selection from genomic clones
We used an Exon Trapping Kit (GIBCO BRL)19 and a modified cDNA selection method for isolating novel exons in P1 and BAC clones as described before.20 In exon trapping, partially Sau3A-digested BAC clones were inserted intoBamHI-digested pSPL plasmid. The plasmids were electroporated into Cos-7 cells, and mRNA was extracted after 48 hours. cDNAs amplified from the mRNA were digested by BstXI restriction enzyme, and the digested cDNAs were amplified by the specific primers at the end of the PSL3 plasmid. The amplified cDNAs were used for Northern hybridization as probes and were sequenced for homology search in the DNA bank. In a modified cDNA selection, Sau3A-digested and biotinylated phage DNA was mixed with random hexamer-primed cDNA prepared from mRNA of t(1;3)(p36;q21)-positive cells in ENE buffer. After heating at 100°C followed by incubation at 65°C for 36 hours, the double-strand DNA fraction was purified by ultrafiltration and extracted by avidin-coated magnetic bead suspension. Recovered cDNA fragments were amplified by the adapter primers and selected by hybridization to the genomic DNA fragment again. The selected cDNAs were used for Northern hybridization as probes and were sequenced for homology search in the DNA bank.
Results
Isolation of genes near the BCR of t(1;3)(p36;q21)
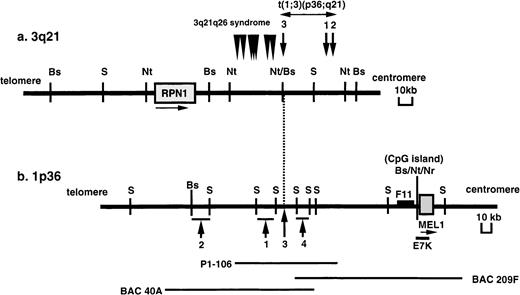
In our previous work, we identified chromosomal BCRs in 4 cases of t(1;3)(p36;q21)-positive MDS/AML. As shown in Figure1, the BCR at the 3q21 region is in the 60-kb NotI fragment and is close to and centromeric to the BCR of the 3q21q26 syndrome, which was previously identified in t(3;3)(q21;q26) or inv(3)(q21q26).5 The BCR at 1p36.3 is within an approximate 90-kb region in 4 cases with t(1;3)(p36;q21). To search for genes near the BCR, a 300-kb contig of BAC and P1 clones covering the breakpoint at 1p36 region was constructed.
Physical maps of the chromosomal breakpoints at 3q21 and 1p36 in t(1;3)-positive MDS/AML.
(A) Mapping of the breakpoints at 3q21. Arrows and numbers indicate the breakpoints in cases 1 to 3 with t(1;3)(p36;q21), and arrowheads indicate the breakpoints in 7 AML cases with t(3;3)(q21;q26) or inv(3)(q21q26) (3q21q26 syndrome) previously reported.4-6The position and orientation of the RPN1 gene are indicated by a horizontal arrow. (B) Mapping of the breakpoints at 1p36. Arrows and numbers indicate the breakpoints in the 4 cases analyzed. The positions of the P1 phage clone (P1-106) and BAC clones (40A and 209F) are indicated below. A F11 cDNA fragment was isolated by the exon trapping method. The position and orientation of the MEL1gene are indicated by a horizontal arrow. Restriction sites are indicated by the following letters: B (BssHII), S (SfiI), Nt (NotI), and Nr (NruI).
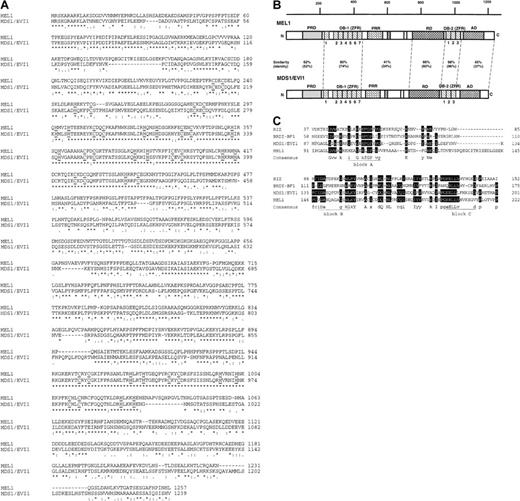
Exon trapping, cDNA hybrid selection, and Northern hybridization using small genomic fragments as probes were used for identifying exons near the BCRs at 1p36 and 3q21 regions. Two cDNA clones, including theRPN1 at the 3q21 region, and 3 cDNA clones, including an F11 cDNA fragment at the 1p36 region, were isolated by the exon trapping method (data not shown) (Figure 1). On the one hand, the mRNA expression pattern of these cDNA clones did not match the t(1;3)(p36;q21)-positive cases. On the other hand, a 7.5-kbEcoRI fragment from the BAC209F clone at 1p36 was specifically hybridized to RNA from the t(1;3)(p36;q21)-positive leukemia cells and detected a band of approximately 8 kb in size by Northern hybridization (data not shown). Therefore, we constructed a cDNA library from the patient's RNA and screened using the 7.5-kbEcoRI fragment as a probe. A 5450-base pair (bp) cDNA-contig was made with 45 bp of 5′ and 1634 bp of 3′ noncoding regions by these cDNA clones. Deduced amino acid sequences from the cDNA was compared with whole registered amino acid sequences in SWISSPORT using a BLAST search program in NCBI and the GenomeNet World Wide Web server. Interestingly, the first 222 amino acid residues of the amino acid sequences were highly homologous to the PR domain in theMDS1 gene, and the rest of the sequence was homologous to the EVI1 gene (Figure2A-B). Therefore, the novel gene was designated as MEL1.
Comparison of the predicted amino acid sequences withMDS1/EVI1 and MEL1.
(A) Alignment of the predicted amino acid sequences of the humanMEL1 (upper) and MDS1/EVI1 (lower) proteins. ‘*’ indicates identical amino acids, ‘:’ and ‘.’ indicate similar amino acids, and ‘–’ represents a gap that has been introduced to optimize the homology. The sequences were compared by the Clustalw program of The EMBL-European Bioinformatics Institute (EBI). Underlines indicate the position of metal binding cysteines and histidines in zinc finger motif. (B) Comparison of the domain structure betweenMDS1/EVI1 and MEL1. Each abbreviation is indicated by the following letters: PRD, PR domain; DBD-1, DNA binding domain-1; PRR, proline-rich domain; RD, repressor domain; DB-2, DNA binding domain-2; AD, acidic domain. (C) Sequence comparison of the conserved PR domain among RIZ, BLIMP1, MDS1/EVI1, and MEL1.
The MEL1 gene is a member of the MDS1/EVI1gene family
As a translational start point of the MEL1 gene, the position of the first methionine was defined as the same position of the first methionine of the MDS1 gene and the coding region of the cDNA contig was 3771 bp long with deduced 1257 amino acid residues. According to the sequence comparison for the BESTFIT program in UWGCG between MEL1 and MDS1/EVI1, similarities were 64.3% in nucleotide and 64.2% in amino acid sequences, and identities were 63.2% in nucleotide and 56.0% in amino acid sequences, respectively (Figure 2A). The domain structure of theMEL1 gene product was the same as that of theEVI1 protein (Figure 2B). First, MEL1 protein has 2 DNA binding domains, which are 7 zinc finger repeats of the C2-H2 type at the N-terminal region and 3 zinc finger repeats at the C-terminal region. The amino acid sequence of the second DNA binding domain in the MEL1 protein showed 96% identity with that of EVI1 protein. Second, a 132–amino acid stretch at the N-terminal end of the MEL1 protein was 52% identical to the N-terminal PR domain of the MDS1 protein, which is reported as a transcriptional regulator with conservation among RIZ, BLIMP1, egl-43, and MDS1 (Figure2C).21,22 In a sequence comparison of the PR domain among RIZ, BLIMP1, MDS1, and MEL1, the PR domain of the MEL1 protein retained the consensus sequence of A, B, and C boxes, but an extra 17 amino acid stretch is inserted in the middle of the PR domain in the MEL1 protein. Third, the repressor domain was conserved in the middle of the MEL1 protein, which was found as a consensus binding sequence for the C-terminal binding protein (CtBP2) in BKLF, AREB6, FOG, and Krüppel zinc finger proteins.23 Also, proline-rich and acidic amino acid cluster regions are conserved in both proteins. Thus, MEL1 is a novel member of the MDS1/EVI1family genes.
Expression of the MEL1 and EVI1 genes in various leukemia cell lines and AML with t(1;3)
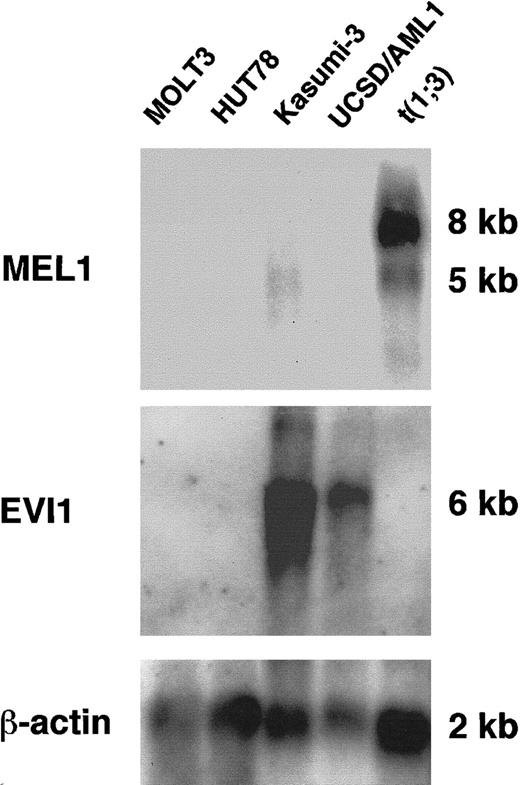
MEL1 expression was analyzed in several cell lines, including leukemia cells with t(1;3)(p36;q21), by Northern blot hybridization. A major 8.0-kb MEL1 transcript was detected only in leukemia cells with t(1;3) (Figure3, lanes 5 and 6). The MEL1gene was not expressed in either myeloid leukemia cell lines (UCSD/AML-1, Kasumi-3) or lymphoid leukemia cell lines (HUT78, MOLT-3). However, a 6.0-kb transcript for the EVI1 gene was detected in RNA from UCSD/AML-1 with t(3;3)(q21;q26) and Kasumi-3 with t(3;7)(q26;q22). Along with these leukemia cells, we have analyzedMEL1 expression in several other leukemia cell lines, including 5 myeloid (UCSD/AML1, HEL, KP-L-RY, F36, and Kasumi-3) and 3 lymphoid (Jurkat, SKW3, and MOLT16) leukemia cells, but aMEL1 transcript was not detected in these cell lines by Northern blot analysis (data not shown). Therefore, it is likely that the MEL1 gene is not expressed in myeloid and lymphoid leukemia cells but ectopically expressed in the leukemia cells with t(1;3).
Expression of the MEL1 gene in mRNA from leukemia cells with t(1;3)(p36;q21) by Northern hybridization.
The MEL1 transcript (8 kb) was expressed in leukemia cells with t(1;3)(p36;q21) (lane 5). However, the MEL1 gene did not express in other leukemia cell lines, HUT78 (lane 1), MOLT3 (lane 2), Kasumi-3 (lane 3), and UCSD/AML1 (lane 4). The same membrane was hybridized to EVI1 or β-actin probes, sequentially.EVI1 transcripts (6 kb) were expressed in both Kasumi-3 with t(3;7)(q26;q22) (lane 3) and UCSD/AML1 with t(3;3)(q21;q26) (lane 4).
Expression of the MEL1 gene in the various cell lines and organs
MEL1 expression was determined in various leukemia cells, including t(1;3)-positive leukemia, and in various organs by RT-PCR using specific primers for MEL1 (see “Materials and methods”). As shown in Figure 4A, a 935 bp of the PCR product was amplified only from RNA of the leukemia cells with t(1;3)(p36;q21), but it was not amplified from RNA of other leukemia cells (KG-1, MOLT4, Kasumi-4, and CMK). This result suggested that MEL1 is transcriptionally activated in t(1;3)(p36;q21)-positive MDS/AML cells but not in t(1;3)(p36;q21)-negative cells. To further investigate whether the MEL1 gene is expressed in hematopoietic organs, we performed RT-PCR to RNA from various human organs. The MEL1 cDNA was amplified from the RNA of uterus and fetal kidney but not from other organs, including bone marrow, spleen, and fetal liver (Figure 4B). Therefore, the expression profile in the organs of the MEL1 gene may be distinctly different from that of the EVI1 gene. On the basis of the results, it was indicated that the MEL1 gene is not expressed in hematopoietic cells but is specifically expressed in t(1;3)-positive leukemia cells.
Detection of the MEL1 expression in patient RNA, cell lines, and organs by RT-PCR.
(A) Expression of the MEL1 gene in RNA from patient leukemia cells or cell lines by RT-PCR. Each transcribed cDNA from leukemia cells with t(1;3)(p36;q21) or cell lines as source of RT-PCR was amplified by the MEL1 specific primers (see “Methods and materials”). Lanes are indicated as follows: 1, 1-kb ladder marker (Promega Biotech); 2, negative control (water); 3, control genomic DNA; 4 to 6, leukemia cells with t(1;3)(p36;q21), cases 1 to 310; 7, KG-1; 8, leukemia cells with inv(3); 9, MOLT4; 10, Kasumi-4; 11, CMK; and 12, MEL1 cDNA fragment (N1163) as a positive control. (B) Expression of the MEL1 gene in various organ RNAs by RT-PCR. The MEL1 and EVI1expressions were analyzed in various organs by RT-PCR using each specific primer set.
Chromosomal mapping of the MEL1 gene by FISH analysis
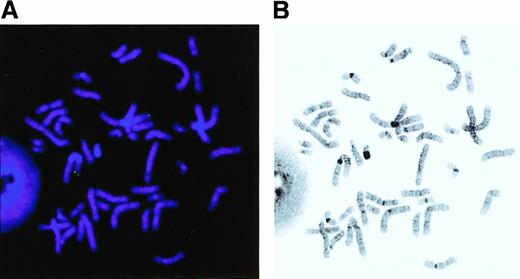
To define the precise location of the MEL1 gene in the restriction map of the 1p36 region with BCR of t(1;3), an E7K fragment with exon(s) of the MEL1 gene was hybridized to the isolated BAC and P1 clones. The E7K fragment was mapped within a 50-kbSfiI fragment, which was approximately 90 kb centromeric to the BCR (Figure 1). The C-terminal region of the MEL1 gene is hybridized to BAC273 but not to BAC209, suggesting that theMEL1 gene is directed to the centromere of chromosome 1 (Figure 1). FISH analysis revealed that the MEL1 gene was mapped to 1p36.3 (Figure 5), which was the same position as the BCR mapped in the previous study.
The MEL1 gene is localized to 1p36.3 by fluorescence in situ hybridization (FISH) analysis.
FISH was carried out with the MEL1 cDNA clone (N1163) as a probe by the method described previously. Hybridization of an FITC-labeled probe to human metaphase spread shows specific green signals (A) on chromosome 1 at band p36.3 (B). Original magnification × 1000.
Discussion
Recurrent translocation between chromosome bands 1p36 and 3q21 has been reported as one of the chromosomal abnormalities associated with MDS. In this study, we identified a novel gene near the BCR at 1p36.3 of t(1;3)-positive MDS/AML. Because the novel gene is a member of theMDS1/EVI1 gene family, we designated it as theMEL1 gene. The MEL1 gene is expressed in t(1;3)-positive MDS/AML leukemia cells but not in other leukemia cell lines and normal hematopoietic cells, suggesting that theMEL1 gene is transcriptionally activated in association with t(1;3)(p36;q21) and contributes to the pathogenesis of MDS and AML with t(1;3)(p36;q21).
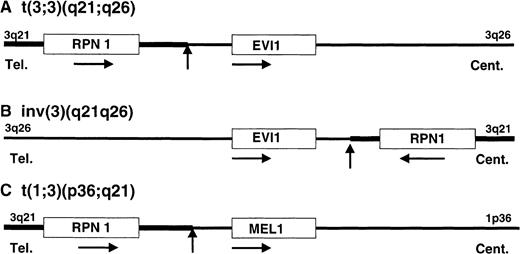
In this study, we have isolated 2 genes from the BCRs of t(1;3)(p36;q21), which are the RPN1 gene at 3q21 and theMEL1 gene at 1p36. In AML, many transcription factors have been isolated as fusion proteins by the translocation, except the EVI1 protein in 3q21q26 syndrome. In MDS-derived AML with t(3;3) or inv(3), the 3q21 region with the RPN1 gene near the BCR, was translocated to the 5′ region of the EVI1 gene by the t(3;3)(q21;q26) and to the 3′ region of the EVI1 gene by the inv(3)(q21q26) with high expression of the EVI1 gene. It was reported that a fusion transcript between the RPN1 and EVI1 genes was detected in a leukemia case with t(3;3)(q21;q26) by RT-PCR.24 However, we did not detect any fusion transcripts or proteins between the 2 genes in the cases with t(3;3)(q21;q26) by Northern hybridization5 and by Western blotting analyses (data not shown). In MDS-derived AML with t(1;3)(p36;q21), the same 3q21 region with the RPN1 gene was also translocated to the 5′ region of the MEL1 gene at 1p36 with high expression of the MEL1 gene. We examined the expression of both RPN1 and MEL1 genes in leukemia cells with t(1;3) by Northern hybridization and RT-PCR. A 2.4-kb RPN1 transcript was expressed in all of the leukemia cells,10 and 8-kb and 5-kb MEL1 transcripts were expressed in the cases with t(1;3). No fusion cDNA was detected in the leukemia cells with t(1;3). Therefore, it is likely that transcriptional activation of the EVI1 gene and the MEL1 gene may have occurred by a common molecular mechanism in both types of chromosomal translocations (Figure 6). In a previous report,25 it was shown that the 5′ flanking regions of the rat RPN1 gene contained 2 GC-rich elements and an octamer motif, which were required for basic and responsive promoter activities, respectively. Therefore, it can be speculated that the 3q21 region with the RPN1 gene activated transcription of the MEL1 gene as an enhancer mechanism.
Schematic illustration of gene activation model in each chromosomal abnormality of 3q21q26 syndrome and t(1;3)-positive AML.
The position and orientation of RPN1, EVI1, andMEL1 are indicated by a horizontal arrow. Tel indicates telomere; Cent, centromere. The vertical arrows indicate the position of breakpoint cluster regions.
By comparison to the EVI1 protein, the MEL1 protein has an extra PR domain at the N-terminal end. The PR (PRDI-BF1,RIZ1) domain is in the coding region of MDS1with noncoding exon 2 in the EVI1 gene and is conserved among RIZ, PRDI-BF1, and egl-4321,22 and is homologous to the SET (Suvar3-9, Enhancer-of-zeste,Trithorax) domain that is involved in chromatin-mediated gene activation and silencing.26 We have isolatedMEL1 cDNAs with the PR domain (MDS1/EVI1 type) but not without the PR domain (EVI1 type). By comparison of amino acid sequences between EVI1 and MEL1, the first and second methionine residues in the EVI1 protein were replaced to valine residues in the MEL1 protein. Thus, it is possible that translation of a truncated MEL1 protein starts from 2 internal methionine residues in the PR domain (Figure 2A). Interestingly, it is reported that EVI1 protein is a transcriptional repressor protein, but MDS1/EVI1 protein is a transcriptional activator protein,27 suggesting that the PR domain changed its transcriptional regulation. Moreover, it is reported that EVI-1 represses transforming growth factor β1 (TGF-β-1)–mediated growth suppression in 32Dcl3 cells, but MDS1/EVI1 enhances TGF-β1 signaling and strengthens its growth-inhibitory effect.28 On the basis of these studies, it is suggested that the MEL1 protein with the PR domain may have distinctly different functions of transcription regulation and TGF-β1 responsiveness from those of the EVI1 protein. In our preliminary data, 2 different-sized MEL1 proteins were detected by in vitro transcription and translation analysis. Therefore, we are currently trying to identify and characterize 2 forms of MEL1 proteins expressed in the leukemia cells with t(1;3).
Supported in part by Grants-in-Aid from the Ministry of Health and Welfare for Research on Human Genome and Gene Therapy of Japan.
The publication costs of this article were defrayed in part by page charge payment. Therefore, and solely to indicate this fact, this article is hereby marked “advertisement” in accordance with 18 U.S.C. section 1734.
References
Author notes
Kazuhiro Morishita, Department of Biochemistry, Miyazaki Medical College, 5200 Kihara, Kiyotake-cho, Miyazaki-gun, Miyazaki 889-1692, Japan; e-mail: kmorishi@fc.miyazaki-med.ac.jp.


This feature is available to Subscribers Only
Sign In or Create an Account Close Modal