Abstract
CXC chemokine receptor 3 (CXCR3), which is known to be expressed predominately on memory and activated T lymphocytes, is a receptor for both interferon γ (IFN-γ)–inducible protein 10 (γIP-10) and monokine induced by IFN-γ (Mig). We report the novel finding that CXCR3 is also expressed on CD34+ hematopoietic progenitors from human cord blood stimulated with granulocyte-macrophage colony-stimulating factor (GM-CSF) but not on freshly isolated CD34+ progenitors. Freshly isolated CD34+progenitors expressed low levels of CXCR3 messenger RNA, but this expression was highly up-regulated by GM-CSF, as indicated by a real-time quantitative reverse transcriptase–polymerase chain reaction technique. γIP-10 and Mig induced chemotaxis of GM-CSF–stimulated CD34+ progenitors by means of CXCR3, since an anti-CXCR3 monoclonal antibody (mAb) was found to block γIP-10–induced and Mig-induced CD34+ progenitor chemotaxis. These chemotactic attracted CD34+ progenitors are colony-forming units—granulocyte-macrophage. γIP-10 and Mig also induced GM-CSF–stimulated CD34+ progenitor adhesion and aggregation by means of CXCR3, a finding confirmed by the observation that anti-CXCR3 mAb blocked these functions of γIP-10 and Mig but not of chemokine stromal cell–derived factor 1α. γIP-10–induced and Mig-induced up-regulation of integrins (CD49a and CD49b) was found to play a crucial role in adhesion of GM-CSF–stimulated CD34+progenitors. Moreover, γIP-10 and Mig stimulated CXCR3 redistribution and cellular polarization in GM-CSF–stimulated CD34+progenitors. These results indicate that CXCR3–γIP-10 and CXCR3–Mig receptor-ligand pairs, as well as the effects of GM-CSF on them, may be especially important in the cytokine/chemokine environment for the physiologic and pathophysiologic events of differentiation of CD34+ hematopoietic progenitors into lymphoid and myeloid stem cells, subsequently immune and inflammatory cells. These processes include transmigration, relocation, differentiation, and maturation of CD34+ hematopoietic progenitors.
Introduction
The trafficking of hematopoietic progenitor cells occurs during mobilization and homing, which play a key role in subsequent proliferation, differentiation, and maturation of these cells. However, little is known about the mechanisms and molecules that regulate the homing, retention, and migration of hematopoietic progenitor cells in hematopoietic organs. Analogous with the processes in mature leukocytes, these processes likely involve chemoattractant molecules and their receptors, which are known to regulate the trafficking of leukocytes under both physiologic and pathologic conditions. The CXC chemokine receptor (CXCR) 3, a G-protein–coupled 7-transmembrane receptor, is expressed at high levels on activated and memory T cells, B cells, natural killer cells, and plasmacytoid monocytes.1-3 It has also been shown to bind interferon (IFN) γ–inducible protein 10 (γIP-10) and monokine induced by IFN-γ (Mig), with Ki values of 0.14 and 4.9 nmol/L, respectively.
γIP-10 and Mig are 2 members of the CXC chemokine superfamily whose expression is dramatically up-regulated by IFN-γ. Both chemokines have been shown to be functional agonists of CXCR3.4 The CC chemokine 6Ckine and IFN-inducible T-cell α chemoattractant (I-TAC) were identified as ligands for CXCR3.5-7 γIP-10 and Mig induce rapid and transient adhesion of human interleukin (IL) 2–stimulated T lymphocytes to immobilized integrin ligands through their receptor CXCR3, which is selectively expressed on activated T cells.8 Immature T cells expressed only CXCR4, whereas most memory and activated T cells expressed CXCR3, and a small proportion expressed CC chemokine receptor (CCR) 3 and CCR5.9 CXCR3 was found to be expressed at high levels on T-helper (Th) 0 and Th1 lymphocytes and at low levels on Th2 lymphocytes.3 In contrast, CCR3 and CCR4 were found on Th2 lymphocytes.9 Circulating blood T cells, B cells, and natural killer cells also express CXCR3.3
Blood T cells expressing CXCR3 were mostly CD45RO+ and generally expressed high levels of β1 integrins. CXCR3 and CCR5 are markers for T cells associated with certain inflammatory reactions, particularly Th1-type reactions such as rheumatoid arthritis. CXCR3 and CCR5 appear to identify subsets of T cells in blood with a predilection for homing to these sites.3 Interestingly, Mig was reported to promote tumor necrosis in vivo.10 However, it is still unclear whether CXCR3 is expressed on CD34+hematopoietic progenitors and whether CXCR3 and its ligands (γIP-10 and Mig) play any role in differentiation of CD34+hematopoietic progenitors.
Materials and methods
Purification of CD34+ hematopoietic progenitor cells
CD34+ hematopoietic progenitor cells were purified as described elsewhere.11 Briefly, umbilical cord blood samples were collected in accordance with institutional guidelines, and CD34+ hematopoietic progenitors were isolated from mononuclear cells from cord blood. A positive-selection procedure using beads (Dynabeads M-450; Dynal A/S, Dynal, Norway) coated with anti-CD34 monoclonal antibody (mAb) was performed by following the manufacturer's instructions. The purity of the CD34+hematopoietic progenitors ranged from 90% to 99%, as determined by flow cytometry.
Flow cytometry
As previously described,12 for detection of CXCR3, CD34+ hematopoietic progenitors, either freshly isolated or stimulated with cytokines, were first incubated with a mouse antihuman CXCR3 mAb labeled with fluorescein isothiocyanate, conjugated (FITC) (49801.111; R&D Systems Europe Ltd, Abingdon, UK) or FITC-labeled CXCR4 mAb (12G5 [5 μg/mL]; R&D Systems Europe Ltd) as the positive control or matched isotype mouse IgG1 (5 μg/mL; Dako, Glostrup, Denmark) to which secondary FITC-labeled bovine antimouse mAb was consequently added. The incubation was done for 20 minutes in phosphate-buffered saline (PBS) containing 2% bovine serum albumin (BSA) and 0.1% sodium azide. The cells were then washed twice in staining buffer and incubated with a mouse antihuman CD34 class I phosphatidylethanolamine (PE)-labeled mAb (Immu409 [5 μg/mL]; Coulter-Immunoteck Co, Margency, France) in PBS containing 2% BSA and 0.1% sodium azide for 20 minutes and subsequently washed twice. For detection of integrins, CD34+ hematopoietic progenitors stimulated with granulocyte-macrophage colony-stimulating factor (GM-CSF) or with chemokine (for 8 hours) were incubated with a mouse antihuman antibody (5 μg/mL of either anti-CD29, 4B4; anti-CD49a, HP2B6; anti-CD49b, Gi9; anti-CD49c, C3VLA3; anti-CD49d, HP2/1; anti-CD49e, SAM1; or anti-CD49f, GoH3; Coulter-Immunoteck Co) for 20 minutes and then incubated with FITC-conjugated bovine antimouse mAb (1:250 vol/vol, SeroTec Inc, Oxford, England) for 20 minutes. Subsequently, the cells were labeled with mouse antihuman CD34 class I PE-labeled mAb (Immu409) for 20 minutes as described above. All procedures were carried out at 4°C. The cells were then fixed with 1% paraformaldehyde. Analyses were performed with a flow cytometer (Coulter XL; Coulter Corporation, Miami, FL).
Real-time quantitative reverse transcription–polymerase chain reaction (RT-PCR) assay
All real-time quantitative RT-PCR reactions were performed as described elsewhere.13-15 Briefly, total RNA from CD34+ hematopoietic progenitor cells (1 × 10⁶; purity > 99%) was prepared by using a Quick Prep total RNA extraction kit (Pharmacia Biotech, Uppsala, Sweden), and any potential contaminating chromosomal DNA was digested with DNAase I according to the manufacturer's instructions. The RNA was reverse transcribed by using oligo(dT)12-18 and Superscript II reverse transcriptase (Life Technologies, Grand Island, NY) according to the manufacturer's instructions. Reverse transcription was performed for 60 minutes at 37°C, and any potential contaminating protein was denatured by incubation for 10 minutes at 95° C. The real-time quantitative PCR was performed in special optical tubes in a 96-well microtiter plate (Perkin Elmer Applied Biosystems, Foster City, CA) by using a sequence detector system (ABI Prism 7700; Perkin Elmer Applied Biosystems) according to the manufacturer's instructions. An SYBR green PCR core reagents kit (Perkin Elmer Applied Biosystems) was used to generate fluorescence during each PCR cycle by means of the 5′ to 3′ endonuclease activity of AmpliTaq Gold13 to provide real-time quantitative PCR information. The CXCR3 genes were generated by connecting the following sequences of the specific primers (DNA Technology, Aarhus, Denmark): sense, 5′-GGAGCTGCTCAGAGTAAATCAC-3′; and antisense, 5′-GCACGAGTCACTCTCGTTTTC-3′.
All unknown complementary DNAs (cDNAs) were diluted to contain equal amounts of β-actin cDNA. The standards, “no template” controls, and unknown samples were added in a total volume of 50 μL per reaction. PCR conditions were 2 minutes at 50°C, 10 minutes at 95°C, 40 cycles of 15 seconds at 95°C, and 60 seconds at 60°C for each amplification. Potential contaminants of the PCR product were digested by uracil-N-glycosylase (UNG), since deoxythymidine triphosphate is substituted with deoxyuridine triphosphate.14 All PCR experiments were performed with a hot start. In the reaction system, UNG and AmpliTaq Gold (Perkin Elmer Applied Biosystems) were used according to the manufacturer's instructions.13 14 To analyze data from the PCR products, 2 terms were used to express the results: δRn, representing the normalized reporter signal minus the baseline signal established in the first few cycles of the PCR; and CT(threshold cycle), representing the PCR cycle in which an increase in reporter fluorescence signal above baseline levels could first be detected.
Northern blot analysis
As previously described,16 total RNA from peripheral cells was prepared by using a Quick Prep total RNA extraction kit. Five micrograms of total RNA from each sample was electrophoresed under denaturing conditions, blotted on Nytran membranes (Schleicher & Schuell Inc, Keene, NH), and cross-linked by UV irradiation. cDNA probes were labeled with α-phosphorus 32 (32P) deoxycytidine triphosphate. A CXCR3 cDNA probe was obtained by PCR amplification of the sequence shown above from total RNA of peripheral CD3+ T lymphocytes from healthy adults. The membranes were hybridized overnight with 106 cpm/mL of32P-labeled probe and then washed with 0.2 × SSC (1 × SSC = 0.15 mol/L sodium chloride (NaCl) and 0.015 mol/L sodium citrate [pH 7.0]) and 0.1% sodium dodecyl sulfate before being autoradiographed.
In vitro chemotaxis assay
As described by Kim and Broxmeyer,17 chemotaxis and chemokinesis were assayed by a modification of the checkerboard assay. Fifty microliters of chemotaxis buffer (RPMI 1640, 0.5% BSA, and antibiotics) suspended with 2 × 10⁵ cells/mL was added to the upper well of the chamber, which was separated from the lower well by a polycarbonate, polyvinylpyrrolidone-free membrane (5 μm pore size) without a collagen coating (Nucleopore, Pleasanton, CA). Chemotaxis buffer was added to the lower chamber. Various amounts of chemoattractants were added to the chemotaxis buffer in the upper chamber, the lower chamber, or both, to form various chemoattractant concentration gradients to form various chemotactic gradients (positive gradient [0/+], negative gradient [+/0], and zero gradient [+/+ or 0/0]). All tests were performed in triplicate. Chambers were incubated at 37°C in 5% carbon dioxide (CO2) for 4 hours. Cells that migrated into the 3 lower chambers were collected and counted by using either a flow cytometer (Coulter XL) for 20 seconds at a high flow rate or a light microscope, by which identical results could be obtained. The cell migration was determined by calculating the percentage of input cells that migrated into the lower chamber.
Colony-forming cell assays
As described by Broxmeyer et al,18 migrated or input cells were plated at concentrations of about 300 CD34+ cells/mL in 35-mm plastic tissue-culture dishes (Nunc, Roskilde, Denmark) containing 1 U/mL recombinant human erythropoietin (EPO; Sigma Chemical Co, St Louis, MO), 100 U/mL GM-CSF, and 100 U/mL IL-3, with and without various chemokines, in 1% methylcellulose culture medium containing 30% fetal-calf serum (FCS). After 7 to 10 days of incubation, burst-forming units–erythroid (BFU-E), colony-forming units–granulocyte-macrophage (CFU-GM), and mixed-cell units (colony-forming units–granulocyte-erythroid-macrophage-megakaryocyte [GEMM]), which respectively identify erythrocyte, granulocyte-macrophage, and multipotential progenitor cells, were scored in situ with an inverted microscope by using standard criteria for their identification.19
Adhesion assays
Adhesion assays were performed as described previously.12 Briefly, 96-well microtiter plates were coated with laminin (20 μg/mL; Sigma Chemical Co) in PBS for 1 hour at 37°C in a humidified atmosphere. The plates were washed with PBS and incubated with medium containing 0.2% BSA for 1 hour in 5% CO2 to block nonspecific adhesion. Thereafter, single-cell suspensions were prepared in RPMI 1640 medium with 0.2% BSA (4 × 10⁵ cells/mL), and γIP-10, Mig, or chemokine stromal cell–derived factor 1α (SDF-1α) was added (100 ng/mL). The cell suspension was added in triplicate to 96-well plates (100 μL per well) and incubated for 60 minutes at 37°C. To remove nonadherent cells, an 8-tipped manifold was used to aspirate all but about 50 μL of liquid from the wells by suspending the manifold at a uniform distance from the bottom of each well. The wells were then washed by carefully directing a stream of 0.2% BSA in PBS along the sides of the wells with the 8-tipped manifold after aspiration. Subsequently, the adherent cells were fixed with 1% formaldehyde and stained with 1% crystal violet. The crystal violet was then extracted by adding a 1:1 mixture of 0.1 mol/L sodium citrate (pH 4.2) and ethanol, and absorbency was read at 540 nm. Cells bound to collagen I (10 μg/mL) on separate wells were used to represent 100% attachment. Background cell adhesion to 2% BSA-coated wells was subtracted from all readings. For inhibition assays, cells were preincubated with different antibodies at 4°C for 30 minutes before the assay.
Aggregation assays
Aggregation assays were performed as described previously.12,20 Briefly, the cells were added at a concentration of 106/mL to culture plates with 24 wells. The chemokines were added to RPMI 1640 culture medium with 10% FCS. After 24 hours, the cells were observed, scored, and photographed by using a Leitz microphotography system. The following semiquantitative scoring method12 20 was used: 0, no aggregation; 1+, less than 10% of cells aggregated; 2+, more than 50% of cells aggregated; 3+, up to 90% of cells small, loose clusters; and 4+, more than 90% of cells aggregated in large clusters.
Polarization assay and immunofluorescence digital confocal microscopy
Immunofluorescence experiments were performed as described elsewhere.21 Briefly, chemokines (100 ng/mL) were used in RPMI 1640 culture medium with 10% FCS in chemotaxis assays. The GM-CSF–stimulated CD34+ hematopoietic progenitor cells were added at a concentration of 106/mL to a chemotactic chamber. After assay, the migrated GM-CSF–stimulated CD34+cells were collected and spun down on a slide, fixed with a mixture of methanol and acetone, and immersed in 1% BSA blocking buffer for 10 minutes to avoid nonspecific binding. Primary antibody, either anti-CXCR3 mAb (49801.111 [10 μg/mL]; R&D Systems Europe Ltd) or with isotype IgG1 (10 μg/mL), was added, and after incubation overnight at 4°C, secondary FITC-labeled donkey antimouse antibody (1:250 vol/vol; Jackson ImmunoResearch Laboratories Inc, West Grove, PA) was added. Cells were observed with a fluorescence microscope (BX60; Olympus, Japan). Confocal microscopy analysis was performed with a confocal laser scanning system and an inverted microscope (LSMSIO; Zeiss, Germany). Images of serial cellular sections were acquired with a graphical user interface (Comos; Bio-Rad, Hercules, CA) as described previously.21
Results
Expression of CXCR3 on CD34+ progenitors is induced by GM-CSF
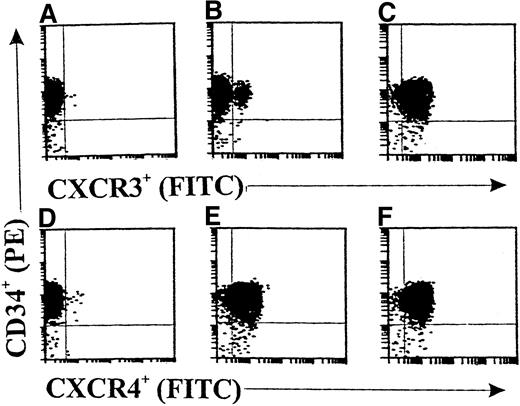
Flow cytometric analyses (Figure 1) showed only rare CXCR3+ cell fractions in freshly isolated CD34+ progenitors from cord blood (<3%; Figure 1B). After 36 hours of incubation with cytokine-free medium, there was no significant change in the CXCR3+ cell fraction (data not shown). Interestingly, 10 ng/mL of GM-CSF significantly up-regulated the expression of CXCR3 on CD34+ progenitors up to 97.6% (Figure 1C). Moreover, CXCR4 was constantly expressed in both freshly isolated CD34+ progenitors (96.9%; Figure 1E) and GM-CSF–stimulated CD34+ progenitors (98.2%; Figure 1F). Figures 1A and 1B show the results with the isotype controls for anti-CXCR3 and anti-CXCR4 antibodies, respectively.
Double-color flow cytometric analysis of the distribution and modulation of CXC chemokine receptor (CXCR) 3 or CXCR4 on CD34+ hematopoietic progenitors.
The CD34+ cells were either freshly isolated (A, B, D, and E) or stimulated with granulocyte-macrophage colony-stimulating factor (GM-CSF) for 36 hours (C and F). Panels A and D show results with isotype controls. The data are from a single experiment representative of 4 similar experiments performed.
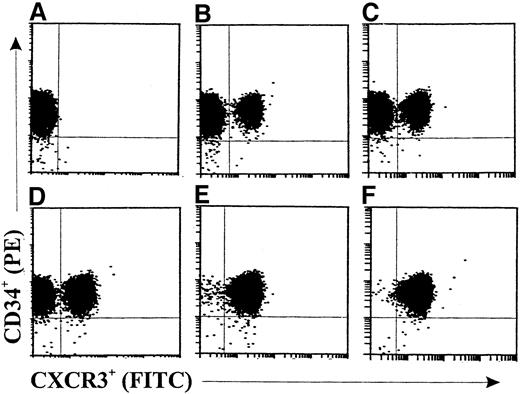
In the kinetic study shown in Figure 2, a slightly increased expression (about 15.7%) of CXCR3 on GM-CSF–stimulated CD34+ progenitors (Figure 2B) compared with freshly isolated cells (Figure 2A) was observed after 6 hours. The fractions of CXCR3+ progenitors were 37.1%, 67.6%, 98.9%, and 99.4% after 16 hours (Figure 2C), 24 hours (Figure 2D), 36 hours (Figure 2E), and 48 hours (Figure 2F), respectively, of stimulation with GM-CSF. CXCR3 expression was not significantly changed in medium-cultured CD34+ progenitors compared with freshly isolated cells at the different assessment times (data not shown).
Double-color flow cytometric analysis of the kinetics of CXCR3 expression on human cord blood CD34+ hematopoietic progenitors.
The cells were either freshly isolated (A) or stimulated with GM-CSF (10 ng/mL) for 6 hours (B), 16 hours (C), 24 hours (D), 36 hours (E), or 48 hours (F). The cells were then stained with fluorescein isothiocyanate, conjugated (FITC)–labeled anti-CXCR3 monoclonal antibody (mAb). The data are from a single experiment representative of 2 similar experiments performed.
CXCR3 messenger RNA (mRNA) expression in CD34+progenitors is up-regulated by GM-CSF
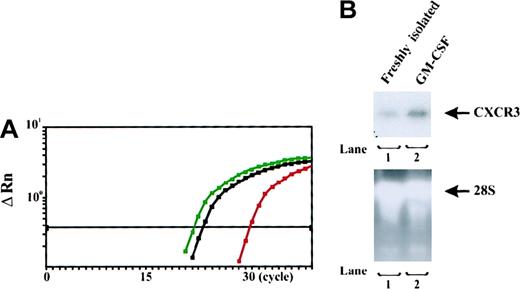
As shown in Figure 3, mRNA of CXCR3 was detected at low levels in freshly isolated CD34+hematopoietic progenitors from human umbilical blood. Compared with the amplification of standard DNA template (2.0 × 10⁴copies) with a housekeeping gene (β-actin), there were approximately 6.3 × 101 copies for CXCR3 in the tested samples of freshly isolated CD34+ progenitors. GM-CSF stimulation significantly up-regulated the expression of CXCR3 mRNA in CD34+ progenitors. There were approximately 4.3 × 10⁴ copies for CXCR3 in the tested samples of GM-CSF–stimulated CD34+ progenitors at 36 hours, whereas there were only about 1.6 × 10² copies for CXCR3 in the tested samples of cultured nonstimulated CD34+ progenitors at 36 hours (data not shown). A linear relation between CTand the log starting quantity of standard DNA template or target cDNA (CXCR3) was detected (data not shown). In all experiments, the correlation coefficient was approximately 0.94. CXCR3 mRNA expression in freshly isolated or GM-CSF–stimulated CD34+ progenitors was confirmed by Northern blot assessment (Figure 3B). The upper panel in Figure 3B shows that freshly isolated CD34+ progenitors expressed CXCR3 mRNA at low levels, whereas GM-CSF–stimulated CD34+ progenitors abundantly expressed CXCR3 mRNA. The lower panel shows that comparable total RNA amounts from different cells were added.
Assessment of messenger RNA (mRNA) expression in CD34+ progenitors.
(A) Plots of real-time detection and amplification of mRNA of CXCR3 in freshly isolated and GM-CSF–stimulated CD34+ progenitors from human cord blood. Red plots represent the amplification of mRNA of CXCR3 in freshly isolated CD34+ progenitors; blue plots represent the amplification of CXCR3 mRNA of GM-CSF-stimulated CD34+ progenitors; and black plots represent the amplification of standard DNA template (2.0 × 10⁴copies) with a housekeeping gene (β-actin). CTs were 23.5 for standard DNA template; 30.1 for mRNA of CXCR3 in freshly isolated CD34+ progenitors; and 22.3 for mRNA of CXCR3 in GM-CSF–stimulated CD34+ progenitors. The plots shown are representative of 2 similar experiments conducted. (B) CXCR3 mRNA Northern blot analysis of freshly isolated and GM-CSF–stimulated CD34+ progenitors. Total RNA from different cells was isolated, electrophoresed, and blotted. The hybridization signals for CXCR3 mRNA from the cells are shown in the upper panel. Results with 28S recombinant RNAs (lower panel) confirmed that there were comparable amounts of loaded total RNA.
γIP-10 and Mig induce GM-CSF–stimulated CD34+progenitor chemotaxis by means of CXCR3
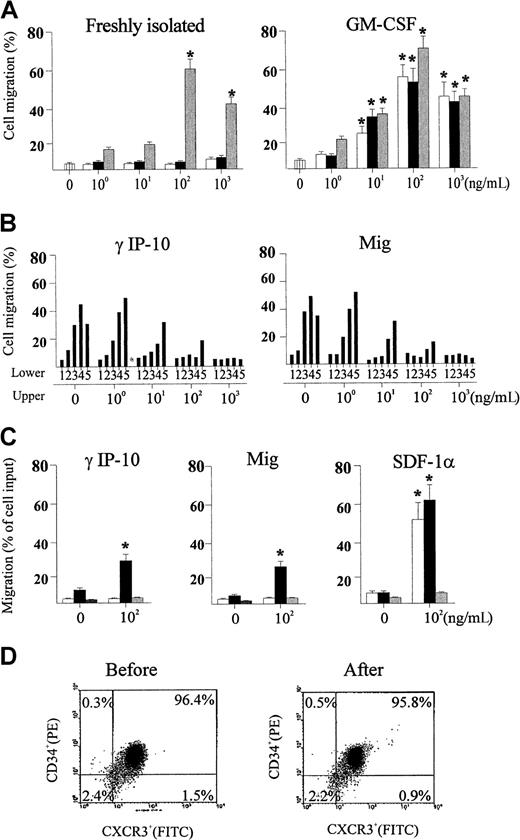
We examined the ability of γIP-10 and Mig to induce chemotaxis in GM-CSF–stimulated CD34+ progenitors and found that they induced significant chemotactic migration in the stimulated cells. As shown in Figure 4A (left), γIP-10 and Mig did not induce chemotactic migration in freshly isolated CD34+ progenitors. SDF-1α was used as the positive control because it induces a strong CD34+ progenitor chemotactic migration. As shown in Figure 4A (right), γIP-10 and Mig induced chemotactic migration in GM-CSF–stimulated CD34+progenitors, yielding typical bell-shaped, dose-dependent chemotaxis response curves. The optimal chemotactic concentration of both γIP-10 and Mig was 100 ng/mL (56.4% ± 8.5% and 51.7% ± 9.8% of input cells, respectively). SDF-1α, the positive control, induced a similar GM-CSF–stimulated CD34+ progenitor chemotactic migration (75.6% ± 9.6% of input cells). Spontaneous migration (medium control) of different CD34+ progenitors was less then 5% (Figure 3A). γIP-10 and Mig did not induce significant chemotactic migration of CD34+ progenitor cells cultured in medium alone (data not shown).
Assessments of migration of CD34+hematopoietic progenitors.
(A) Migration of freshly isolated (left) and GM-CSF–stimulated (right) CD34+ hematopoietic progenitors toward interferon (IFN) γ–inducible protein 10 (γIP-10) (open bars), monokine induced by IFN-γ (Mig) (black bars), and chemokine stromal cell-derived factor 1α (SDF-1α) (gray bars). All results are expressed as the mean ± SD percentage of input cells that migrated (n = 5) and are based on triplicate determinations of chemotaxis for each concentration of chemokines. An asterisk indicates a significant difference from the medium control (P < .03, except in one case, in whichP < .04). (B) Checkerboard analysis for GM-CSF–stimulated CD34+ hematopoietic progenitors toward γIP-10 (right) and Mig (right). Chemokines were applied in the upper chamber, the lower chamber, or both. The concentrations of chemokines applied in the lower chambers were 0, 1, 10, 100, and 1000 ng/mL (indicated as 1, 2, 3, 4, and 5, respectively). The data are from one representative experiment of 2 performed. (C) Specific chemotactic activity of γIP-10 (right), Mig (middle), and SDF-1α (right) for subtypes of colony-forming, GM-CSF–stimulated CD34+hematopoietic progenitors from cord blood. CD34+ cells attracted to different chemokines at the indicated concentrations were assayed for colony-forming cells and the results expressed as the mean ± SD percentage of input cells that migrated (n = 3). Open bars, black bars, and gray bars indicate burst-forming units–erythroid, colony-forming units–granulocyte-macrophage, and colony-forming units–granulocyte-erythroid-macrophage-megakaryocyte, respectively. An asterisk indicates a significant difference from the medium control (P < .04). (D) Flow cytometry analysis for CD34+ cells before (left) and after (right) migration toward γIP-10. The cells were dual stained; percentages indicate positive or negative cells.
To confirm that the observed GM-CSF–stimulated CD34+progenitor chemotaxis was indeed induced by γIP-10 and Mig by means of CXCR3, we used anti-CXCR3 mAb to block the GM-CSF–stimulated CD34+ progenitor chemotactic activity of γIP-10 and Mig. The anti-CXCR3 mAb completely blocked the chemotaxis of GM-CSF–stimulated CD34+ progenitors toward γIP-10 and Mig (data not shown), whereas it had no effect on the chemotaxis of GM-CSF–stimulated CD34+ progenitors toward SDF-1α (data not shown). The isotype antibody had no blocking effect (data not shown).
To address the question of whether enhanced migration of GM-CSF–stimulated CD34+ progenitors toward γIP-10 and Mig is due to directional migration (chemotaxis), random migration (chemokinesis), or both,17 we performed checkerboard chemotaxis assays in the presence of γIP-10 or Mig in the lower chamber, the upper chamber, or both, in a combined manner. As the γIP-10 or Mig concentration in the upper chamber increased, migration of GM-CSF–stimulated CD34+ progenitors toward the lower chamber decreased (Figure 4B). When the chemotactic gradient became negative or zero, migration of GM-CSF–stimulated CD34+progenitors toward γIP-10 (Figure 4B, left) or Mig (Figure 4B, right) to the lower chamber decreased to background levels, demonstrating that enhanced motility of the cells toward both chemokines was due to chemotaxis rather than chemokinesis.
To determine whether γIP-10, Mig, and SDF-1α had specificity to attract certain types of CD34+ progenitors with respect to colony formation, we assayed the migrated CD34+ progenitors in methylcellulose medium containing growth factors (GM-CSF, IL-3, EPO, and various chemokines). Interestingly, at a concentration of 100 ng/mL, γIP-10 (Figure 4C, left) and Mig (Figure 4C, middle) attracted mainly (and in significant numbers) CFU-GM in cord blood CD34+ progenitors. The chemotactic activity for other cord blood progenitors, such as BFU-E and the more immature CFU-GEMM, was weak and not significant. However, the attractions of CFU-GM and BFU-E to SDF-1α (Figure 4C, right) were significant and equal, whereas the attraction of CFU-GEMM was weak and not significant. This observation can be explained by the conditions in our experiments.19We also examined the purity of GM-CSF–stimulated CD34+progenitors before and after migration toward γIP-10 (Figure 4D) and Mig (data not shown). The identical purity of GM-CSF–stimulated CD34+ cells before (left) and after (right) migration excludes the possibility that contaminated T lymphocytes preferably migrated toward γIP-10.
γIP-10 and Mig induce GM-CSF–stimulated CD34+progenitor adhesion by means of CXCR3
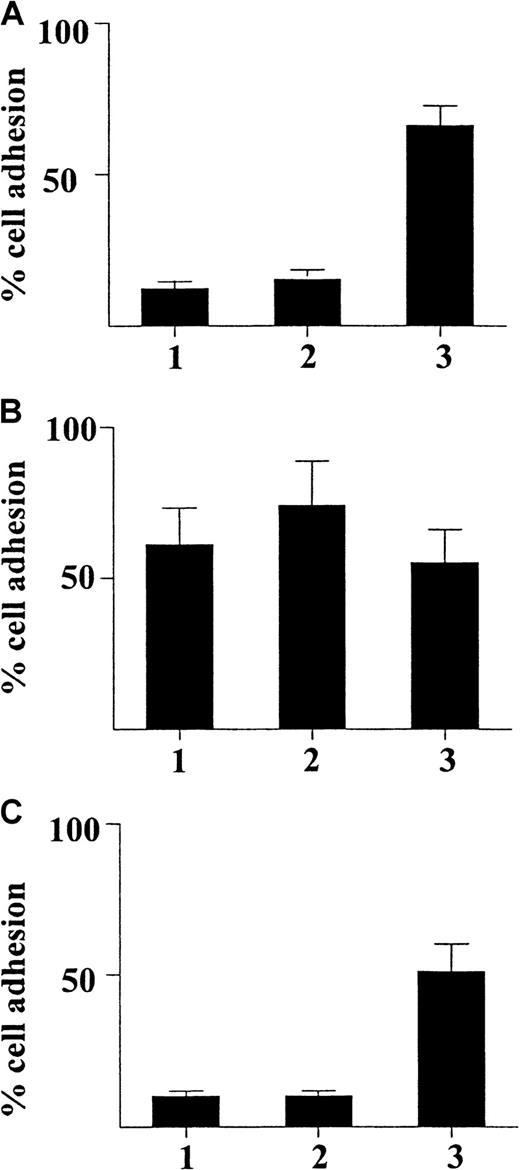
We examined the ability of γIP-10 and Mig to induce GM-CSF–stimulated CD34+ progenitor adhesion. Figure5A shows that neither γIP-10 nor Mig induced adhesion in freshly isolated CD34+ progenitors (< 15% for both). SDF-1α was used as the positive control because it induces a strong CD34+ progenitor adhesion (about 70%). Figure 5B shows that γIP-10 and Mig induced a strong adhesion in GM-CSF–stimulated CD34+ progenitors. About 68% and 75% of cells, respectively, had adhered 60 minutes after the addition of γIP-10 or Mig for (100 ng/mL). SDF-1α, the positive control, induced a similar GM-CSF–stimulated CD34+ progenitor adhesion (65%). γIP-10 and Mig did not induce significant adhesion of medium-cultured CD34+ progenitor cells (data not shown).
Adhesion of CD34+ hematopoietic progenitors from human cord blood induced by γIP-10 (indicated by 1), Mig (2), or SDF-1α (3).
The CD34+ progenitor cells were either freshly isolated (A), stimulated with GM-CSF (B), or stimulated with GM-CSF and incubated with anti-CXCR3 mAb (C). The cells were either freshly isolated from cord blood from a normal birth, preincubated with GM-CSF for 36 hours only, or preincubated with GM-CSF and then incubated with CXCR3 mAb (5 μg/mL) for 60 minutes at room temperature before the adhesion assay. All chemokines were applied at a concentration of 100 ng/mL. The data represent mean values from at least 3 experiments performed. Results are expressed as the mean ± SD percentage of adherent cells and are based on triplicate determinations of adhesion for each chemokine used.
To confirm that the observed GM-CSF–stimulated CD34+progenitor adhesion was induced by γIP-10 and Mig by means of CXCR3, we used anti-CXCR3 mAb to block the GM-CSF–stimulated CD34+ progenitor adhesive activity of γIP-10 and Mig. The mAb completely blocked the adhesion of GM-CSF–stimulated CD34+ progenitors induced by γIP-10 and Mig (Figure 5C) (< 12%, respectively), whereas it had no effect on the adhesion of GM-CSF–stimulated CD34+ progenitors induced by SDF-1α (about 50%). The isotype antibody had no blocking effect (data not shown).
γIP-10 and Mig induce GM-CSF–stimulated CD34+progenitor aggregation by means of CXCR3
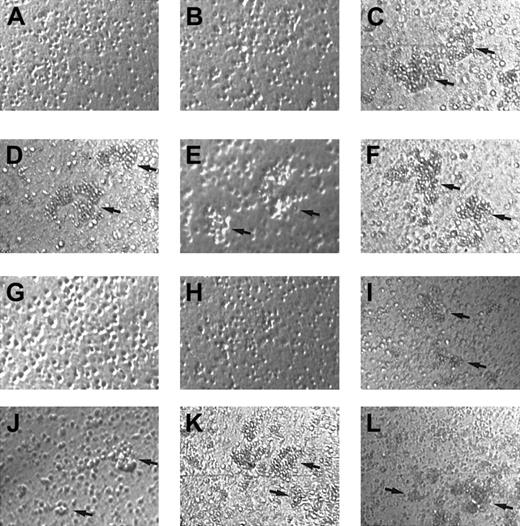
To examine whether γIP-10 and Mig play an additional role in GM-CSF–stimulated CD34+ progenitor adhesion, we performed aggregation tests of CD34+ progenitors stimulated with γIP-10, Mig, or SDF-1α. The results shown in Figure6 indicate that γIP-10 and Mig do not induce aggregation in freshly isolated CD34+ progenitors (Figure 6A and 6B, scored as 0). SDF-1α was used as the positive control because it induces a strong CD34+ progenitor aggregation (Figure 6C, scored as 4+). γIP-10 and Mig induced a strong aggregation in GM-CSF–stimulated CD34+ progenitors (Figure 6D, scored as 3+; and Figure 6E, scored as 2+), as did SDF-1α (Figure 6F, scored as 3+). γIP-10 and Mig did not induce significant aggregation of medium-cultured CD34+ progenitor cells (data not shown).
Aggregation of CD34+ hematopoietic progenitors.
Aggregation induced by γIP-10 (A, D, G, and J), Mig (B, E, H, and K), or SDF-1α (C, F, I, and L) is shown. CD34+ hematopoietic progenitors from human cord blood were either freshly isolated (A-C), stimulated with GM-CSF (D-F), incubated with anti-CXCR3 mAb and stimulated with GM-CSF (G-I), or incubated with isotype mAb and stimulated with GM-CSF (J-L). Arrows indicate the aggregation clusters. The cells were photographed at ×100 magnification. Aggregation in A, B, G, and H was estimated to be 0; that in D, E, F, I, J, and L to be 2+ to 3+; and that in C and K to be 4+. The photographs are representative of 3 similar experiments.
To confirm that the observed GM-CSF–stimulated CD34+progenitor aggregation was induced by γIP-10 and Mig by means of CXCR3, we used anti-CXCR3 mAb to block the GM-CSF–stimulated CD34+ progenitor aggregation activity of γIP-10 and Mig. The mAb completely blocked the aggregation of GM-CSF–stimulated CD34+ progenitors induced by γIP-10 and Mig (Figure 6G and 6H, scored as 0), whereas it had no effect on the aggregation of GM-CSF–stimulated CD34+ progenitors induced by SDF-1α (Figure 6I, scored as 2+). The isotype antibody had no blocking effect (Figure 6J, scored as 2+; Figure 6K, scored as 4+; and Figure 6L, scored as 3+).
Role of integrins in GM-CSF–stimulated CD34+progenitor adhesion induced by γIP-10 and Mig
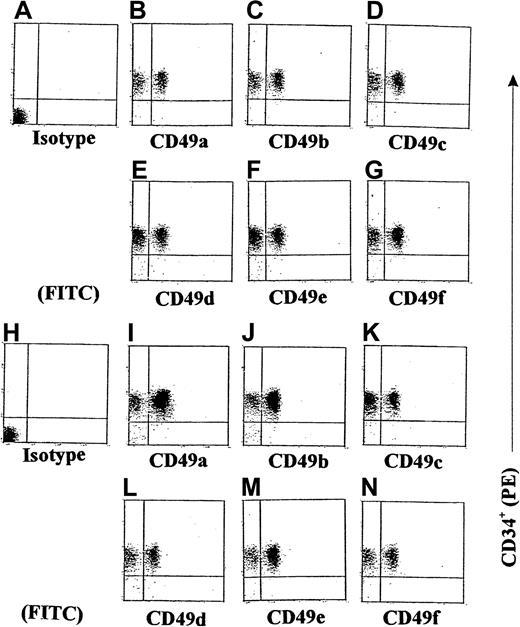
We next examined the expression of some integrins on GM-CSF–stimulated CD34+ progenitors induced by γIP-10 or Mig. Because we had already demonstrated that γIP-10 and Mig each produced a significant induction of GM-CSF–stimulated CD34+ progenitor adhesion and aggregation, we conducted additional experiments to investigate whether γIP-10 or Mig would enhance the expression of integrins on GM-CSF–stimulated CD34+ progenitors. The results of the flow cytometric analyses shown in Figure 7 indicate that γIP-10 can significantly increase the expression of certain integrins on GM-CSF–stimulated CD34+ progenitors. On average, there were 32.5% ± 5.1% CD49a+ cells on GM-CSF–stimulated CD34+ progenitors (Figure 7B), 31.5% ± 2.2% CD49c+ cells (Figure 7C), 36.2% ± 7.8% CD49d+ cells (Figure 7D), 42% ± 10.2% CD49e+cells (Figure 7E), 41.5% ± 12.5% CD49f+ cells (Figure7F), and 39% ± 7.7% CD49b+ cells (Figure 7G). After stimulation with γIP-10 (100 ng/mL) for 8 hours, the expression of CD49a and CD49b was selectively and substantially up-regulated. On average, there were 84% ± 2.8% CD49a+ cells on γIP-10–cultured GM-CSF–stimulated CD34+ progenitors (Figure 7I) and 74.2% ± 4.7% CD49b+ cells (Figure 7J). Statistical analysis for the 4 experiments showed a significant difference in CD49a and CD49b expression in GM-CSF–stimulated CD34+ cells compared with GM-CSF–stimulated CD34+ cells or γIP-10–stimulated CD34+ cells (both P < .003; n = 4). On average, there were 45.7% ± 4.5% CD49c+ cells on γIP-10–cultured, GM-CSF–stimulated CD34+ progenitors (Figure 7K), 45.5% ± 4.7% CD49d+ cells (Figure 7L), 45.2% ± 3.8% CD49e+ cells (Figure 7M), and 46.2% ± 5.1% CD49f+ cells (Figure 7N). There was no significant difference in CD49c, CD49d, CD49e, or CD49f cell expression in GM-CSF–stimulated CD34+ cells compared with GM-CSF–stimulated and γIP-10–stimulated CD34+ cells (all P > .05; n = 4). Figures 7A and 7H show the results with isotype controls for a-CD49a and a-CD49b.
Double-color flow cytometric analysis of the distribution of different integrins on CD34+ hematopoietic progenitors.
The CD34+ cells were either stimulated with GM-CSF for 36 hours (A-G) or stimulated with GM-CSF and then with γIP-10 for 8 hours (H-N). The cells were isolated from cord blood from a normal birth and either preincubated with GM-CSF (10 ng/mL) for 36 hours only or preincubated with GM-CSF and then stimulated with γIP-10 (100 ng/mL) for 8 hours. Subsequently, the cells were stained with the indicated anti-integrin mAbs. The data are from a single experiment representative of 4 similar experiments performed.
We also observed that Mig (100 ng/mL) selectively and substantially up-regulated the expression of CD49a and CD49b on GM-CSF–stimulated CD34+ progenitors (data not shown). In addition, we examined the expression of integrins on freshly isolated CD34+ hematopoietic progenitors. There was no significant difference between freshly isolated and GM-CSF–stimulated CD34+ hematopoietic progenitors in the expression of certain integrins (data not shown).
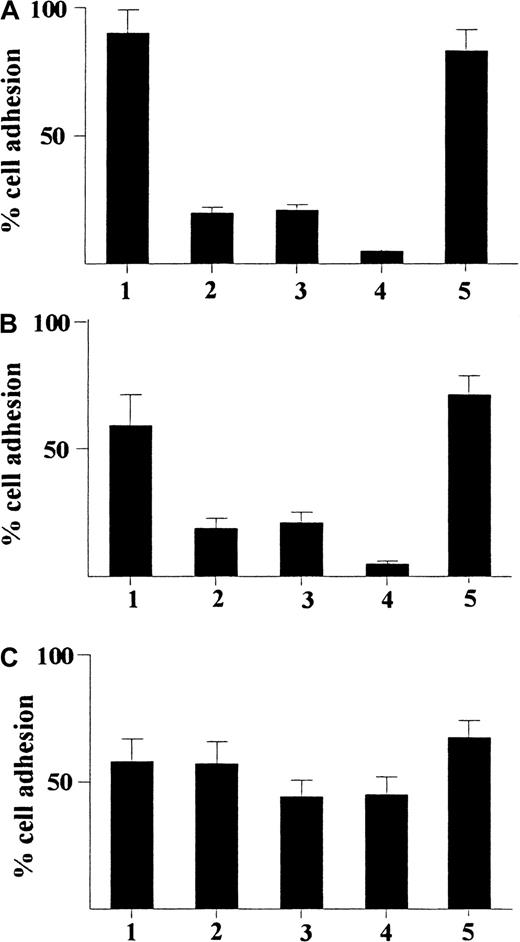
Because we found a selective and substantial up-regulation of expression of CD49a and CD49b on GM-CSF–stimulated CD34+progenitors induced by γIP-10 or Mig, we explored the role of these integrins in the adhesion of GM-CSF–stimulated CD34+progenitors induced by IP-10 or Mig. As shown in Figure8A, γIP-10 induced significant adhesion in GM-CSF–stimulated CD34+ progenitors in the absence of anti-integrin antibodies (about 90%). Anti-CD49a or anti-CD49b mAb significantly inhibited the adhesion of GM-CSF–stimulated CD34+ progenitors induced by γIP-10 (about 20% for each). However, the combination of anti-CD49a mAb and anti-CD49b mAb almost completely abolished the adhesion of GM-CSF–stimulated CD34+ progenitors induced by γIP-10 (< 10%), whereas isotype IgG1 had no inhibitory effect on adhesion (about 85%). A similar blocking effect on Mig-induced adhesion of GM-CSF–stimulated CD34+ progenitors was observed by using a combination of anti-CD49a mAb and anti-CD49b mAb (Figure 8B), whereas isotype IgG1 had no inhibitory effect on adhesion. In some experiments in which fibronectin replaced laminin as the substratum, similar blocking effects of anti-CD49a mAb and anti-CD49b mAb were observed (data not shown). Interestingly, neither anti-CD49a mAb, anti-CD49b mAb, nor isotype IgG1 significantly prohibited the adhesion of GM-CSF–stimulated CD34+ progenitors induced by SDF-1α (Figure 8C). The results shown in Figure 8 indicate that γIP-10 or Mig induces adhesion of GM-CSF–stimulated CD34+progenitors by means of up-regulation of some adhesion molecules (certain integrins, CD49a and CD49b). CD49a and CD49b may be important ligands in the pathway of this reaction.
Adhesion of CD34+ hematopoietic progenitors from human cord blood.
Adhesion induced by γIP-10 (A), Mig (B), and SDF-1α (C) is shown. The cells were either stimulated with GM-CSF alone (indicated by 1) or stimulated with GM-CSF and then incubated with anti-CD49a mAb (2), anti-CD49b mAb (3), anti-CD49a and anti-CD49b mAbs (4), or isotype IgG1 (5; control for a-CD49a and a-CD49b). The cells were preincubated with different mAbs (5 μg/mL) for 60 minutes at room temperature before the adhesion assay. All chemokines were applied at a concentration of 100 ng/mL The data represent mean values from at least 3 experiments performed. Results are expressed as the mean ± SD percentage of adherent cells and are based on a triplicate determination of adhesion for each antibody used.
γIP-10 and Mig induce CXCR3 polarization on GM-CSF–stimulated CD34+ progenitors
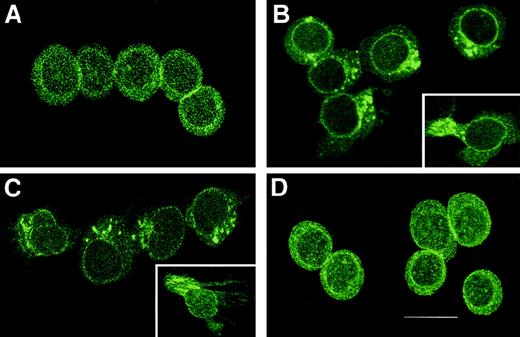
Because cell migration induced by chemoattractant gradients requires cell polarization and relative receptor redistribution, we assessed the cellular distribution of CXCR3 during stimulation of GM-CSF–stimulated CD34+ progenitors with γIP-10, Mig, or SDF-1α. As shown in Figure 9, CXCR3 was evenly distributed throughout the GM-CSF–stimulated CD34+progenitors (Figure 9A). On stimulation of GM-CSF–stimulated CD34+ progenitors with γIP-10 (Figure 9B) or Mig (Figure9C), a rapid redistribution of CXCR3 took place that resulted in movement of the receptors to the leading edge of the cells. The insets in Figure 9 show the clusters of CXCR3 oriented in a certain direction. Figure 9D shows the CXCR3 evenly distributed throughout the GM-CSF–stimulated CD34+ progenitors, although the cells migrated through the gradient of SDF-1α, indicating that the polarization of CXCR3 on the GM-CSF–stimulated CD34+progenitors is receptor-ligand (γIP-10 and Mig) specific.
Assessment of cellular distribution of CXCR3 after stimulation.
(A) CXCR3 distribution on GM-CSF–stimulated CD34+hematopoietic progenitors before the chemotaxis assay. After stimulation, the CXCR3 receptors redistributed to the leading edge of the polarized migrating GM-CSF–stimulated CD34+hematopoietic progenitors, toward γIP-10 (B), Mig (C), or SDF-1α (D). The CD34+ cells were stimulated with GM-CSF for 36 hours and then subjected to the chemotaxis assay. The migrating cells were collected and stained and then photographed under epifluorescence conditions (original magnification ×1200; bar, 12 μm).
Discussion
The mechanisms and specific molecules involved in the mobilization of hematopoietic progenitor cells from the hematopoietic organs into peripheral blood, in the homing of hematopoietic progenitor cells, and in their trafficking through the hematopoietic organs during maturation are unclear. Hematopoietic progenitor cells express CXCR422 and migrate toward a gradient of the chemotactic factor SDF-1α.23 CXCR3 is not broadly expressed in cells of the immune system: 40% of resting T lymphocytes and low numbers of B cells and natural killer cells were found to stain positive for CXCR3.24 Interestingly, pretreatment with IL-2 resulted in cultures of fully responsive, CXCR3-positive T lymphocytes.24 CXCR3 has been identified as the receptor for γIP-10, Mig, secondary lymphoid-tissue chemokine (SLC) (6Ckine and I-TAC.5,6,25 CXCR3 and CCR5 are preferentially expressed on human Th1 lymphocytes, whereas CCR4 and CCR3 are preferentially expressed on Th2 lymphocytes.26 Lymphocytic cells and cerebrospinal fluid T cells from patients with active multiple sclerosis are significantly enriched with cells expressing CXCR3 or CCR5.27 γIP-10 plays a role in the epidermotropism of cutaneous T-cell lymphoma.28 γIP-10 and Mig appear to target stimulated lymphocytes specifically, but have no activity on either neutrophils or monocytes.29 The gene for CXCR3 is on human chromosome Xq13, suggesting unique functions for this receptor and its ligands beyond their established role in T-cell–dependent immunity.24
The function of adhesion molecules on the surface of leukocytes is critically regulated by activating events triggered by chemoattractants binding to specific receptors on the leukocytes.30Hematopoietic progenitor cells home to the extravascular compartment of the bone marrow during transplantation. Multipotential and self-renewing hematopoietic cells migrate to the bone marrow from the fetal liver during fetal development. In the other direction, hematopoietic progenitor cells are mobilized from the bone marrow to the peripheral blood in response to injected cytokines such as GM-CSF, granulocyte colony-stimulating factor (G-CSF), and Steel factor (SLF).31
How do multiple chemoattractants cooperate in directing the migration of hematopoietic progenitor cells for homing and peripheral blood mobilization? SDF-1 and SLF were found to cooperate in attracting MO7e cells, cord blood cells, and bone marrow CD34+ cells.32 SDF-1 and SLF, along with other unidentified bone marrow chemoattractants, may be involved cooperatively in the migration of hematopoietic progenitor cells to the bone marrow and in preventing spontaneous mobilization of hematopoietic progenitor cells out of the bone marrow.32 Chemokines play a direct role in mobilization of hematopoietic stem cells, although cytokines have other functions, such as proliferation, modulation of adhesion molecules, and alteration of the blood–bone marrow barrier. For example, G-CSF and GM-CSF appear to have no chemotactic or chemokinetic effects on hematopoietic stem cells, whereas SLF, IL-3, and IL-11 have been reported to chemoattract murine hematopoietic progenitor cells.33
In the current study, we demonstrated that γIP-10 and Mig activate hematopoietic progenitors to chemotaxis and adhesion on induction of CXCR3 by GM-CSF. To our knowledge, this is the first report of CXCR3 expression on human hematopoietic progenitors induced by a growth factor–like cytokine, and it provides the first direct evidence of biologic activity of hematopoietic progenitors induced by CXC chemokines γIP-10 and Mig. A rather complex picture is beginning to form regarding how hematopoietic progenitors selectively enter different hematopoietic organs, nest on sites, differentiate, and further transmigrate into functional destinations to cause physiologic and pathophysiologic events during continuous interaction with chemokines and cytokines.
Our finding that γIP-10 and Mig do not induce freshly isolated CD34+ progenitor chemotaxis and adhesion are in agreement with the results of Kim and Broxmeyer,34 who observed that the CXCR3 ligands γIP-10 and Mig did not induce chemotaxis of freshly isolated CD34+ hematopoietic progenitors but that another CXCR3 ligand, SLC, is a potential trafficking factor for hematopoietic progenitors. Interestingly, we found that GM-CSF is a strong inducer of expression of CXCR3 on progenitors at the mRNA and protein levels. Only GM-CSF–stimulated CD34+progenitors had chemotactic activity toward γIP-10 and Mig. These results indicate that hematopoietic progenitors express different chemokine receptors at different stages of maturation and these receptors have different affinity to their ligands at the different stages. During the maturation of hematopoietic progenitors, GM-CSF plays a important role in the induction of expression of chemokine receptors and increases their affinity.
Transplanted human hematopoietic cells must retain specific adhesive capacity to interact with the vascular endothelium of the bone marrow.35 Murine hematopoietic progenitor cells interact in vivo with both P-selectin and E-selectin on vascular endothelium of bone marrow.33 Optimal recruitment of hematopoietic progenitor cells to the bone marrow requires the combined action of both selectins and vascular cell adhesion molecule 1.36,37The rolling of hematopoietic progenitor cells on bone marrow endothelium may be accompanied by a coordinated sequence of adhesive and activation events leading to cell arrest, a critical step in the successful extravasation of blood-borne cells to extravascular sites.38,39 Leukocyte function–associated molecule 1 (LFA-1) and very late antigen (VLA) 4 are constitutively expressed by cord blood CD34+ hematopoietic progenitors in inactive forms.40 LFA-1 binding to endothelial intercellular adhesion molecule 1 is the principal adhesive interaction that mediates the firm arrest of leukocytes on vascular endothelium.40-42 Murine hematopoietic progenitors roll in vivo along bone marrow microvessels that display selectins and integrins.43 SDF-1 is expressed at high levels on bone marrow endothelium and stimulates a firm integrin-dependent adhesion of circulating CD34+ progenitors to the bone marrow microvasculature.44
We demonstrated that up-regulation of γIP-10–induced and Mig-induced integrins (CD49a and CD49b, also called VLA-1 and VLA-2) plays a crucial role in the adhesion of GM-CSF–stimulated CD34+progenitors. This finding suggests that γIP-10, Mig, and their receptor, CXCR3, take part in the multistep mobilization of hematopoietic cells of migration to or from the bone marrow during their development, as well as mutual-direction mobilization between the bone marrow and the peripheral blood during immune reactions. Adhesion molecules, including integrins, are important elements in these processes.
In summary, we found that γIP-10 and Mig, by means of CXCR3 induced by GM-CSF, activate CD34+ progenitor cells to chemotaxis and adhesion. This finding provides a useful insight into novel mechanisms of action of γIP-10 and Mig that may be especially important in the cytokine/chemokine environment for the physiologic and pathophysiologic events of mobilization and homing during proliferation, differentiation, and maturation of hematopoietic progenitor cells.
Acknowledgments
We thank Gitte Pedersen, Anne Corfitz, Ulla Minuva, and Tina Mortensen for excellent technical assistance and Dr Fritz von Bülow, Institute of Anatomy, Panum Institute, University of Copenhagen, Denmark, for assistance in immunofluorescence digital confocal microscopy.
Supported by the Danish Allergy Research Center (T.J., S.Q., and A.M.), Directionen af Hovedstadens Sygehusfællensskab, Denmark (C.J.), Novo Nordisk A/S, Denmark (S.Q.), and the National Science Foundation of China (39870674).
The publication costs of this article were defrayed in part by page charge payment. Therefore, and solely to indicate this fact, this article is hereby marked “advertisement” in accordance with 18 U.S.C. section 1734.
References
Author notes
Tan Jinquan or Lars K. Poulsen, Laboratory of Medical Allergology, National University Hospital, 9 Blegdamsvej, DK-2200 Copenhagen Ø, Denmark; e-mail:tan@rh.dk or lkpallgy@inet.uni2.dk.

This feature is available to Subscribers Only
Sign In or Create an Account Close Modal