Abstract
In the immune system, extracellular adenosine 5′-triphosphate (ATP) mediates a variety of effects mainly through activation of a particular receptor subtype, the pore-forming P2Z/P2X7 purinoceptor. This purinergic receptor has been described chiefly in cells of hemopoietic origin such as T cells, thymocytes, monocytes, macrophages, and phagocytic cells of thymic reticulum. In this study, we characterized the P2Z/P2X7 purinoceptor and the ATP-mediated apoptosis in murine spleen–derived dendritic cells (DCs). Dye uptake and apoptosis were evaluated by flow cytometry. ATP-treated DCs were permeable to different low-molecular-weight fluorescent probes such as ethidium bromide, YO-PRO 1, and lucifer yellow. Such an effect was dose-dependent (EC50: 721 μmol/L); mediated by the fully anionic agonist (ATP4−); and specifically stimulated by ATP, BzATP, and ATPγS. Additionally, an ATP-induced increase in intracellular calcium was detected by microfluorometry. Furthermore, ATP treatment induced a significant increase in apoptotic DCs (64.46% ± 3.8%) when compared with untreated control cells (34% ± 5.8%), as ascertained by the TdT-mediated dUTP nick end labeling technique. Both ATP-induced DC permeabilization and apoptosis were inhibited by oxidized ATP, a P2Z/P2X7-specific antagonist. In conclusion, we characterized the expression of the P2Z/P2X7purinoceptor in murine spleen–derived DCs and described its role on the induction of apoptosis.
Adenosine 5′-triphosphate (ATP) has been described as an important molecule in both the intracellular and extracellular microenvironments of the cell. Despite the regulatory control exerted by ectonucleotidases, which maintain its low physiologic concentrations, extracellular ATP1 may reach high concentrations when released exocytotically from various cell types such as neurons, platelets, basophils, and mast cells, or when released nonexocytotically from damaged cells.2 Since the pioneering work of Drury and Szent-Györgyi3 showing the effects of extracellular adenine compounds in mammalian hearts, modulatory effects of extracellular ATP have been described in the majority of cells and tissues studied so far.2,4,5 Such effects are mediated by the activation of P2 receptors, which were recently classified into 2 major families, P2X and P2Y.6The receptors that represent the P2X and P2Y families are linked to ligand-gated ion channels and G proteins, respectively.6,7The P2X family–related P2Z/P2X7 purinoceptor has been described in various cell types including those of hemopoietic origin, such as thymocytes, peripheral T lymphocytes, mast cells, monocytes, macrophages, and phagocytic cells of the thymic reticulum.8-10 The activation of the P2Z/P2X7 receptor induces progressive pore opening and cell membrane permeabilization, allowing the exchange of ions and molecules of up to 900 d and an increase in intracellular calcium.11,12 Recently, the activation of NFAT and NF-κβ transcriptional factors, as well as phospholipase D, was also associated with the intracellular signaling triggered by the P2Z/P2X7receptor.13-15
Yet, the physiologic importance of the P2Z/P2X7purinoceptor described in different cells of the immune system remains unclear and has become a major focus of investigation. In macrophages, the activation of P2Z/P2X7 has been related to the formation of multinucleated giant cells, enhancement of intracellular bactericide mechanisms, increase of posttranscriptional processing and release of interleukin-1β and cell death.16-18 In peripheral T lymphocytes, loss of L-selectin expression has been described after P2Z/P2X7activation.19 Recently, we demonstrated the expression of the P2Z/P2X7 purinoceptor in phagocytic cells of the thymic reticulum.20 These cells, first characterized by Papiernik et al,21 share several features with interdigitating dendritic cells (DCs) and macrophages, such as few lysosomes, DC shape, high expression of major histocompatibility complex (MHC) class II molecules, CR3 complement receptor, and phagocytosis of IgG-opsonized sheep red blood cells. Such similarities prompted us to investigate the presence of P2 receptors in peripheral DCs, described as the major professional antigen-presenting cells. These cells express high levels of MHC class II and costimulatory molecules, enabling the activation of naive T lymphocytes in vivo.22-24 In addition, DCs are widely distributed in lymphoid and nonlymphoid organs, initiating migration to T-cell areas of draining lymph nodes upon activation.25 Such a feature theoretically increases the possibility to interact with extracellular adenine nucleotides released by different sources.2
In this study, we characterize the P2Z/P2X7receptor in murine spleen–derived DCs by pharmacologic and functional criteria. Moreover, we show that apoptosis in these cells is enhanced following P2Z/P2X7 activation by extracellular ATP.
Materials and methods
Reagents
Acridine orange, adenosine, cyclic adenosine 5′-monophosphate (cAMP), adenosine 5′-diphosphate (ADP), adenosine 5′-triphosphate (ATP), 3′-0-(4-benzoylbenzoyl)-adenosine 5′-triphosphate (BzATP), N,N-dimethyl formamide (DMF), ethidium bromide, ethylenediaminetetraacetic acid (EDTA), ethylene glycol-bis(β-aminoethyl ether) N,N,N′,N′-tetraacetic acid (EGTA), 5′-p-fluorosulfonyl-benzoyladenosine (5′FSBA),L-glutamine, lucifer yellow, periodate oxidized ATP (oATP), probenecid, propidium iodide, RPMI 1640 medium, uridine 5′-triphosphate (UTP), and trypan blue were purchased from Sigma Chemical Co (St Louis, MO). FURA-2AM and YO-PRO 1 were obtained from Molecular Probes (Eugene, OR), and adenosine 5′-O-(3-thiotriphosphate) (ATPγS) was from Boehringer Mannheim Biochemicals (Indianapolis, IN). Fetal calf serum was obtained from GIBCO/BRL (Gaithersburg, MD).
Animals
Swiss-Webster female mice, 8 to 10 weeks old, were obtained from the animal facilities of the Oswaldo Cruz Foundation and the Institute of Microbiology and Immunology of the Federal University of Rio de Janeiro. The animals were maintained in a light-controlled environment and fed ad libitum.
Antibodies
Spleen-derived DCs were stained with fluorescein isothiocyanate (FITC)- or phycoerythrin (PE)-labeled monoclonal antibodies (mAbs). The following mAbs were also used: anti-CD3 (clone 29B; purchased from GIBCO/BRL), anti-CD45R (clone RA3-6B2), biotinylated anti-CD80 (clone 1G10), and anti-CD86 (clone GL-1), which were obtained from Pharmingen (San Diego, CA). The anti-F4/80 (macrophage marker) was from Caltag (Burlingame, CA), and the anti-Ia (clone Ox 6) was from Crawley Down (Sussex, England). The unlabeled hamster anti-mouse CD11c (clone N418) was a gift from Dr Mireille Dardenne (Hospital Necker, Paris, France), whereas the anti-FcγRII/FcγRIII mAb (clone 2.4G2) was kindly provided by Dr Tania C. de Araújo Jorge (Oswaldo Cruz Foundation, Rio de Janeiro, Brazil). The biotin-labeled anti-hamster IgG was obtained from Vector Laboratories (Burlingame, CA), and both FITC- and PE-streptavidin conjugates were from Amersham Pharmacia Biotech (Buckinghamshire, UK).
Isolation and phenotypic characterization of DCs
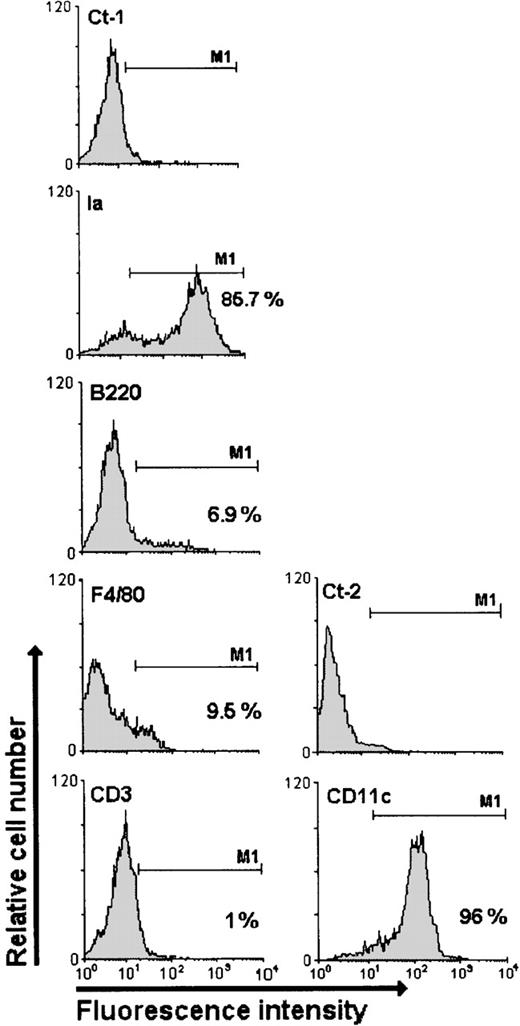
DCs were obtained as described.26 Briefly, spleens were disrupted and the cells were centrifuged at 1300 rpm for 5 minutes, resuspended in supplemented RPMI 1640 medium (10% heat-inactivated fetal calf serum, 2 mmol/L L-glutamine, 1 mmol/L pyruvate, 50 μmol/L mercaptoethanol, 100 U/mL penicillin, and 100 μg/mL streptomycin), and incubated for 2 hours at 37°C in a 5% CO2 atmosphere in plastic cell culture plates. Culture plates were then washed vigorously 3 times with supplemented RPMI 1640 medium, and the nonadherent cells were discarded. The adherent cells were maintained in the culture medium and incubated overnight at 37°C in a 5% CO2 atmosphere. After incubation, DCs (which exhibit adherence capacity in the first hours of culture) become nonadherent and float in the medium. The DCs were collected and immediately used in our assays. To verify the degree of contaminating cells in DC preparations, we stained floating cells with the following mAbs: anti-F4/80 (macrophage), anti-CD45R (B cells), anti-Ia (MHC class II molecules), anti-CD3 (T cells), and anti-CD11c (all DC subpopulations); 80% to 95% of the cells were Ia/CD11cHigh (Figure 1).
Cytofluorometric profiles of DCs labeled with different antibodies.
The specificity or type of each antibody is displayed above the respective panel. The anti-F4/80, anti-CD3, anti-CD45R (B220), and anti-MHC II (Ia) antibodies were analyzed taking into account the negative control Ct-1 (rat IgG), and the anti- CD11c antibody was analyzed based on the negative control Ct-2 (hamster IgG). The M1 marker defined the positive cells (%). The profiles are representative of 3 separate experiments.
Immunofluorescence
Freshly isolated DCs were centrifuged for 5 minutes at 1300 rpm and suspended in phosphate-buffered saline (PBS) with 5% normal mouse serum (vol/vol) and 2% of the 2.4G2 hybridoma supernatant. The cell suspensions were distributed in microplate wells and incubated at 4°C for 20 minutes. After incubation, the cells were centrifuged as described earlier and incubated separately with anti-CD3–FITC, anti-CD45R–PE, anti-Ia–FITC, or anti-F4/80–PE at 4°C for 20 minutes. Isotype control was performed with unrelated PE- or FITC-labeled rat IgG (Pharmingen). When anti-CD11c was used as the primary antibody, the cell suspension was subsequently labeled with biotinylated goat anti-hamster mAb, followed by FITC-streptavidin or PE-streptavidin; both incubations were performed at 4°C for 20 minutes. In this case, a hamster anti-mouse γδ T cell receptor (TCR) was used as the isotype control (Pharmingen). The cells were further washed with PBS and ultimately fixed with 1% formaldehyde/PBS. The data were analyzed by flow cytometry using an Epics Elite (Beckman Coulter, Fullerton, CA) with WinMDI software.
Permeabilization assay
Freshly isolated DCs were suspended in RPMI 1640 medium. In some experiments, RPMI 1640 medium with 5 mmol/L EDTA was used to deplete calcium and magnesium divalent cations. DCs were incubated with ethidium bromide (10 μmol/L), lucifer yellow (0.5 mg/mL), or YO-PRO 1 (10 μg/mL) for 15 minutes at 37°C in the presence or absence of ATP, or another selected nucleotide analog. The cell suspensions were washed 3 times with medium before the fluorescence analysis using a Zeiss Axiovert 100 microscope (Carl Zeiss, Oberkochen, Germany). The fluorescence pattern was also analyzed by flow cytometry, as described previously. In this case, at least 104 cells were analyzed in each group. Dead cells and cellular debris were excluded based on low forward and side scatters and the very high fluorescence profile. The dose-response curves obtained from permeabilization assays were fitted with the logistic equation (Microcal Origin 4.1 software, Microcal, Northampton, MA) depicted as follows: y = [A1 − A2] / [1 + (X /Xo)p] + A2, where A1 and A2 correspond to minimal and maximal percentages of permeabilized cells, respectively; y corresponds to permeabilized cells (%) at each treatment point; and X corresponds to the agonist concentration. XO represents the half-maximal effective concentration (EC50), and P represents the Hill coefficient,27 28 which indicates the possible number of ligand-binding sites in the receptor.
In our evaluations, we substituted saline solutions for RPMI 1640 medium to ascertain optimal culture conditions in DC permeabilization assays. We did this because, for us and our colleagues, these cells presented sensitivity to great variations in culture conditions (ie, temperature, medium, cytokines, serum, and pH). The RPMI 1640 medium is a complex solution that contains amino acids and some vitamins. However, the known binding constants between amino acids or vitamins and the ions of interest are much lower when compared with those of EDTA and ATP. Assuming this, we calculated the ATP4−concentration based on the total concentration of K+, Mg2+, Ca2+, ATP, and EDTA. The pH and the Fabiato binding constants were also considered.29The calculation was done with the aid of a computer program originally developed by Mark Kurzmack.30
Inhibition of ectonucleotidase activity
To ascertain the interference of ectonucleotidase activity in ATP-dependent DC permeabilization, we pretreated the cells with 5′FSBA, a known irreversible ectonucleotidase inhibitor.31 32 Briefly, the DCs were suspended in RPMI 1640 medium and treated with 1 mmol/L of 5′FSBA for 1 hour at 37°C (5% CO2). The cells were washed twice, suspended in RPMI 1640 medium, and incubated with ATP (5 mmol/L) and ethidium bromide (10 μmol/L) for 15 minutes at 37°C (5% CO2). DC permeabilization was analyzed by flow cytometry. To evaluate the specificity of the 5′FSBA effect, we also treated DCs with DMF only (1%), the 5′FSBA diluent. In these experiments, DMF application did not induce any effect (data not shown).
Intracellular calcium measurement
Intracellular calcium measurement in DCs was performed as described.33 Briefly, DC suspensions (106cells/mL in RPMI 1640 medium) were plated in 31-mm-diameter round glass coverslips (Biophysica Technologies, Sparks, MD), treated with 2.5 mmol/L probenecid, and loaded with 6 μmol/L Fura2-AM in RPMI 1640 medium for 45 minutes at room temperature. After incubation, the coverslips were rinsed with standard saline (composition in mmol/L: 140 NaCl, 5 KCl, 1 CaCl2, 1 MgCl2, and 10 HEPES, pH 7.4) and the experiments were performed using a photomultiplier-based calcium detection system (Photon Technology, Princeton, NJ) in a modified 3-compartment superfusion chamber with the bottom formed by the coverslip.34 Microscopic fields containing 20 to 40 DCs were selected and excited at 340- and 380-nm wavelengths; the intracellular calcium was monitored based on the ratio of emission at 510 nm (340 nm/380 nm). In all of the experiments, cells were perfused with standard saline at room temperature and ATP was applied in the initial mixing compartment, reaching the cells at a final concentration of 5 mmol/L. In some cases, saline without calcium was perfused (composition in mmol/L: 140 NaCl, 5 KCl, 1 MgCl2, 10 HEPES, 1 EGTA, pH 7.4).
Morphologic analysis of apoptosis
DCs were suspended in RPMI 1640 medium and plated in a V-bottom 96-well microtiter plate (105 cells per well). The cells were treated with ATP (5 mmol/L) for 30 minutes, washed twice, and further incubated for 6 hours with supplemented medium alone at 37°C in a 5% CO2 incubator. The DC suspension was then centrifuged and suspended in PBS containing the fluorescent dyes acridine orange (5 μg/mL) and propidium iodide (10 μg/mL). Both of these dyes intercalate DNA; however, acridine orange (green labeling) is lipophilic whereas propidium iodide (red labeling) is hydrophilic. Thus, acridine orange allows the analysis of nuclear morphology of viable cells if normal (intact) or apoptotic (fragmented), whereas propidium iodide allows cell viability determination. Additionally, the nuclear morphology of dead cells labeled with propidium iodide can suggest whether it is just necrotic or in advanced apoptosis (secondary necrosis).
The DCs were analyzed by confocal laser scanning microscopy (LSM 410; Zeiss, Jena, Germany). Acridine orange was excited at 488 nm (argon laser) and propidium iodide at 543 nm (helium/neon laser); the filter settings were BP 510-525 nm and LP 570 nm, respectively. The correspondent transmitted light images were obtained at 543 nm (helium/neon laser) using a differential interference contrast device.
Quantification of apoptosis
The DCs were suspended in RPMI 1640 medium and treated with ATP, BzATP, or UTP (all at 5 mmol/L) for 30 minutes; later, the cells were washed twice, resuspended in supplemented RPMI 1640 medium, and further incubated for 6 hours at 37°C (5% CO2). Apoptosis was quantified by cytofluorometry using the terminal deoxyribonucleotidyl transferase (TdT)-mediated dUTP nick end labeling (TUNEL) technique, as described elsewhere.35 Briefly, cells were fixed in 2% paraformaldehyde/PBS for 30 minutes, washed twice with PBS (1% bovine serum albumin [BSA]), and incubated with permeabilization solution (0.1% Triton X-100, 0.1% sodium citrate) for 2 minutes at 4°C. Cells were further washed twice with PBS and resuspended in TUNEL reaction mixture (in situ cell death detection kit; Boehringer Mannheim, Mannheim, Germany) composed of buffer solution with TdT and FITC-conjugated dUTP. After 50 minutes of incubation, the cells were washed with PBS and analyzed by flow cytometry. In some cases, the DCs were labeled with anti-CD11c mAb (followed by biotinylated anti-hamster IgG and PE-streptavidin) or PE-conjugated anti-CD80 or anti-CD86 mAb before the TUNEL assay. As a negative control, DCs were incubated with FITC-conjugated dUTP only. A positive control was performed by treating the cells with DNAse (10 μg/mL) immediately before incubation with TUNEL reaction mixture.
Statistical analysis
Statistical comparisons were done by the Student t test. Differences were considered significant at P < .05.
Results
Permeabilization effect of ATP
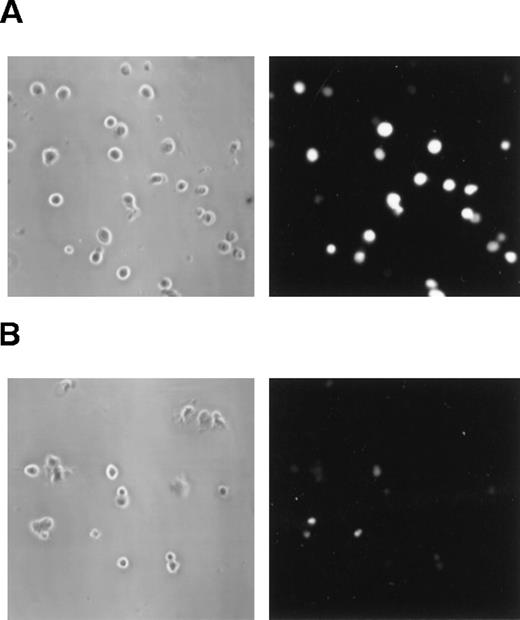
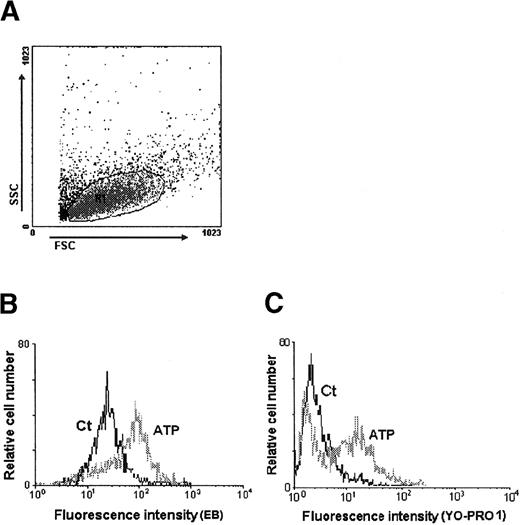
The expression of the P2Z/P2X7 purinoceptor can be detected by low-molecular-weight dye-uptake assays19,36 37 based on the feature of this receptor, which opens a poorly selective pore when activated. Figure2 shows the fluorescence microscopy of DCs left untreated or treated with ATP (5 mmol/L) in the presence of the fluorescent dye lucifer yellow. The fluorescent dye could be seen diffusely throughout the cytoplasm of treated DCs, indicating membrane permeabilization (Figure 2A). This same pattern was not observed in control cells (Figure 2B). The degree of permeabilization was also quantified by cytofluorometry. Figure 3shows that DCs treated with ATP became permeabilized to 2 other fluorescent dyes, ethidium bromide (Figure 3B) and YO-PRO 1 (Figure3C). Analysis by phase contrast microscopy demonstrated that DCs treated with ATP did not become permeabilized to trypan blue (MW 961) (data not shown), indicating a molecular-weight limitation of the permeabilization phenomenon.
Extracellular ATP induces permeabilization in DCs.
Phase contrast microscopy (left panels) and the respective fluorescence microscopy (right panels) of DCs incubated for 15 minutes at 37°C with lucifer yellow (0.5 mg/mL) either with (A) or without (B) 5 mmol/L ATP. It is clear that ATP treatment enhanced the entrance of the fluorescence dye into the cells. (Magnification, 320×.)
Cytofluorometric profiles of DC permeabilization induced by ATP.
(A) Forward-scatter (FSC) and side-scatter (SSC) dot plot. R1 represents the DC population that was gated for analysis, thus excluding cellular debris and dead cells. DCs were incubated with 10 μmol/L ethidium bromide (B) or 10 μg/mL YO-PRO 1 (C) and treated (ATP) or not (Ct) with 5 mmol/L ATP for 15 minutes at 37°C.
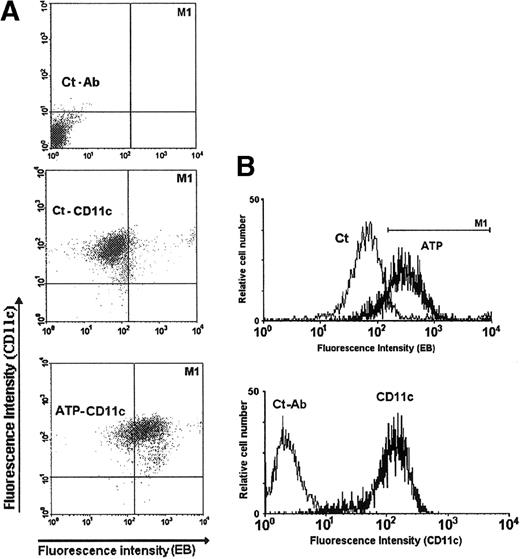
Cell suspensions prelabeled with the anti-CD11c mAb were also subject to the permeabilization assay, confirming the phenotype of the cells sensitive to extracellular ATP (Figure 4).
Permeabilization assay of DCs previously labeled with the anti-CD11c mAb.
(A) Dual DC labeling with ethidium bromide (EB) and anti-CD11c antibody (FITC). The upper panel represents the DCs labeled with just the unrelated control antibody (Ct-Ab); the central panel represents the DCs labeled with anti-CD11c mAb and incubated with ethidium bromide alone (Ct-CD11c); the lower panel represents the DCs labeled with anti-CD11c mAb and incubated with ethidium bromide plus 5 mmol/L ATP (ATP-CD11c) for 15 minutes at 37°C. (B) The top histogram represents the fluorescence profile of CD11c+ cells incubated with 10 μmol/L ethidium bromide, either with (ATP) or without (Ct) 5 mmol/L ATP. The M1 marker defines the threshold for defining cell permeabilization. The bottom histogram represents the fluorescence profile of the DC population labeled with anti-CD11c mAb (CD11c) or with unrelated control antibody (Ct-Ab).
ATP4− as the active ligand that triggers permeabilization
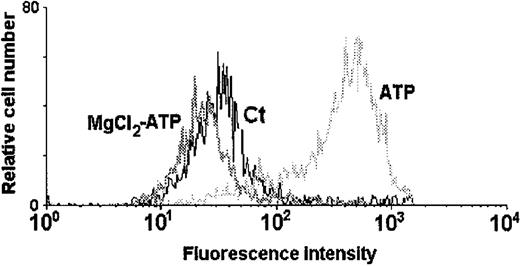
ATP4− normally binds to divalent cations, such as calcium and magnesium, to form a complex.38 It is well established that the tetra-anionic ATP4− is the active ligand of the P2Z/P2X7 purinoceptor.8 36Figure 5 shows the fluorescence profile of DCs incubated with ethidium bromide (10 μmol/L) plus MgCl2(5 mmol/L) before the application of ATP (5 mmol/L). The ATP-induced permeabilization was completely inhibited by MgCl2 treatment, indicating that the active form of the ligand is actually the fully ionized ATP4−.
Treatment of DCs with MgCl2 completely blocks the ATP-induced permeabilization.
DCs were incubated in the presence of 10 μmol/L ethidium bromide and 5 mmol/L MgCl2 before the application of 5 mmol/L ATP. The histogram represents the fluorescence intensity of control DCs (Ct) incubated with ethidium bromide alone, those treated with ATP in the presence of ethidium bromide (ATP), and those subjected to 5 mmol/L ATP in the presence of ethidium bromide plus 5 mmol/L MgCl2(MgCl2-ATP).
Dose dependence
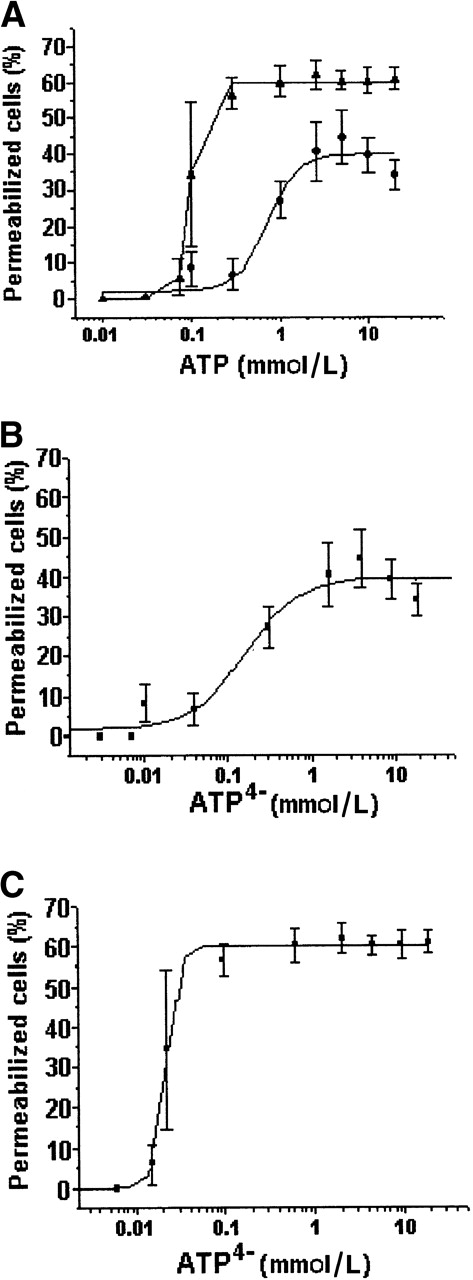
To verify the dose dependence of ATP-triggered permeabilization, we treated DCs with different concentrations of ATP (Figure6). In RPMI 1640 medium, the effective permeabilization began at 0.1 mmol/L and the peak, at which 44.5% of the DC population became permeabilized, was reached at 5 mmol/L. The EC50 was 0.721 mmol/L (Figure 6A, circle), and the calculated Hill coefficient was 2.46.
Dose-response curve of DC permeabilization following ATP treatment: effect of Ca2+ and Mg2+ chelation.
(A) DCs were treated with different concentrations of ATP (0.01 to 20 mmol/L) and exposed to ethidium bromide (10 μmol/L) for 15 minutes at 37°C. The experiments were performed in RPMI 1640 medium alone (circle) or in the presence of EDTA (5 mmol/L) (triangle). The dose-response curves were also plotted based on the P2Z/P2X7 active ligand ATP4−concentration calculated from the experiments performed in RPMI 1640 medium alone (B) or in the presence of EDTA (C). Plotted data represent the mean ± SD of 3 distinct experiments.
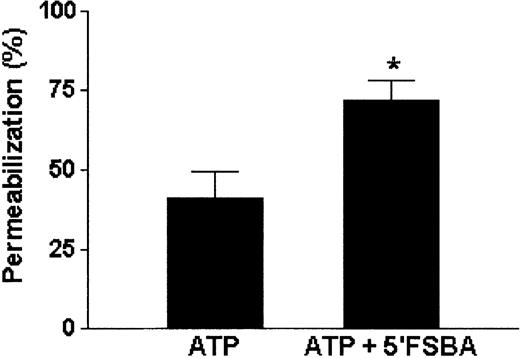
The fact that just half of the DC population responded to the assay prompted us to investigate the possible effect of ectonucleotidases in this process. The same assay was carried out in RPMI 1640 medium with 5 mmol/L of EDTA to decrease manyfold the Ca2+ and Mg2+concentrations, which have been described as being essential to the activity of ectonucleotidases.1 39 Under such conditions, the EC50 shifted to 0.094 mmol/L (Figure 6A, triangle). As shown in Figure 5, it was the anionic form of the agonist (ATP4−) that induced the permeabilization of DCs. Hence, to investigate whether the shift in EC50, observed during permeabilization performed in medium containing EDTA, was due to an increase of noncomplexed active ligand (ATP4−) or to an inhibition of ectonucleotidases, we normalized the dose-response curves based on the concentration of ATP4− calculated in each condition. Even after normalization, we observed that differences in EC50 were still present (Figure 6B,C), indicating that part of this effect might well be the result of ectonucleotidase inhibition. Our assays using 5′FSBA, an irreversible ectonucleotidase inhibitor, further indicated that this was the case. As seen in Figure 7, when the DCs were previously treated with 5′FSBA (1 mmol/L), we observed an increased number of permeabilized cells (71.8% ± 6.2%) when compared with the untreated control (41.2% ± 7.9%).
The ectonucleotidase inhibitor, 5′FSBA, enhances ATP-mediated DC permeabilization.
The DC suspension was previously treated with 1 mmol/L of 5′FSBA for 1 hour at 37°C. These cells were then washed twice and incubated with ATP (5 mmol/L) and ethidium bromide (10 μmol/L) for 15 minutes at 37°C. The degree of permeabilization was analyzed by flow cytometry. Data shown were normalized and compared by Studentt test. *Results from DCs treated with 5′FSBA were significantly different from those of untreated cells (P < .001). Data are the average of 3 experiments (mean ± SD).
Pharmacologic profile
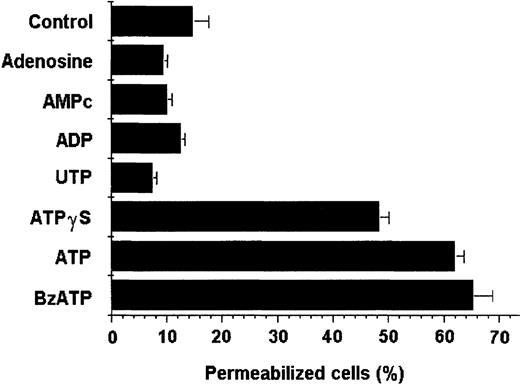
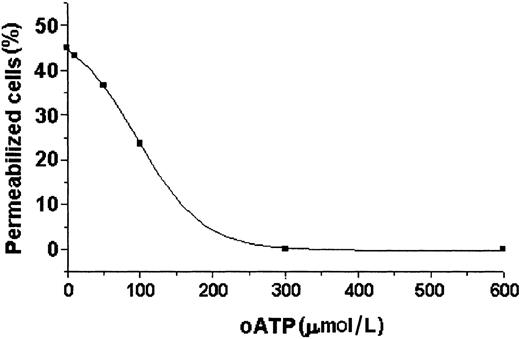
Different nucleotide analogs were tested for their capacity to permeabilize DCs. Adenosine, cAMP, ADP, UTP, BzATP, and ATPγS were tested at 5 mmol/L in all assays, and their effects were compared with that of 5 mmol/L ATP. As depicted in Figure8, ATP, BzATP, and ATPγS selectively permeabilized DCs above the background level, whereas the other analogs did not cause any effect. In additional experiments, DCs were treated with increasing concentrations of oATP, previously described as a selective P2Z/P2X7 receptor antagonist that binds covalently and irreversibly to the receptor, inhibiting its effects.40 DCs were incubated with oATP for 2 hours at 37°C. The cells were then incubated with or without ATP in the presence of ethidium bromide for 15 minutes. As shown in Figure9, pretreatment with oATP at concentrations greater than 300 μmol/L completely blocked the ATP-mediated permeabilization.
DC permeabilization was induced selectively by adenine triphosphate nucleotide analogs.
Adenosine, cAMP, ADP, UTP, ATPγS, and ATP were analyzed for their ability to permeabilize DCs. DC suspensions containing 10 μmol/L ethidium bromide were incubated for 15 minutes at 37°C with different nucleotide analogs (all at 5 mmol/L). Data shown were not normalized. Results express the average of 3 experiments (mean ± SD).
Oxidized ATP treatment blocks the ATP-mediated DC permeabilization.
DC suspensions were pretreated with different concentrations of oxidized ATP (oATP) for 2 hours at 37°C. These cells were subsequently treated with ATP (5 mmol/L) plus ethidium bromide (10 μmol/L) and incubated for 15 minutes more. The permeabilization inhibition was analyzed by flow cytometry.
ATP treatment induces intracellular calcium increase in DCs
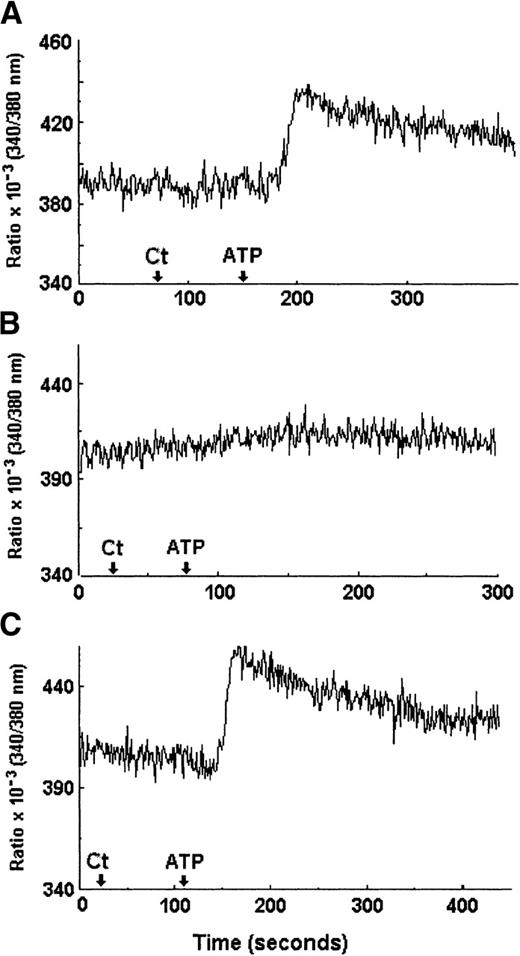
An increase in intracellular calcium ([Ca2+]i) has been described as a hallmark of the activation of all subtypes of P2 receptors studied so far.41 Thus, we measured by microfluorometry with FURA2-AM DC [Ca2+]i before and after ATP treatment. Figure10A depicts the 510-nm emission wavelength ratio showing the [Ca2+]i increase in DCs after a 5-mmol/L ATP application in standard saline; this increase was not observed when saline alone was applied as a negative control. When the same microscopic field was maintained and perfused with saline without calcium (see “Materials and methods”), ATP application was not able to induce any intracellular calcium alteration (Figure 10B). In contrast, when the same cells were subsequently perfused with standard saline, the intracellular calcium increase was again observed after ATP application (Figure 10C), indicating that the extracellular environment is the source for the calcium increase detected in the intracellular milieu after the ATP treatment.
Intracellular calcium increase induced by ATP treatment.
DCs previously loaded with 6 μmol/L FURA2-AM and treated with 2.5 mmol/L probenecid were tested in perfusion with either standard saline (including 1 mmol/L CaCl2) (A,C) or calcium-free saline (including 1 mmol/L EGTA) (B). The arrows indicate the application of control saline alone (Ct) or 5 mmol/L ATP (ATP). Intracellular calcium changes were detected by monitoring the variation of the ratio obtained from emission at 510 nm elicited under 340-nm and 380-nm excitation wavelengths. These measurements are representative of 3 separate experiments and were obtained from the same cellular microscopic field.
ATP-induced apoptosis of DCs
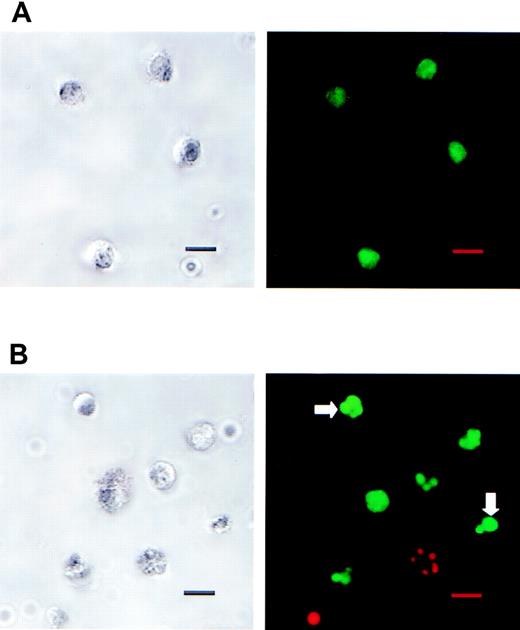
After establishing the presence of the P2Z/P2X7 purinoceptor in murine spleen–derived DCs, we investigated one possible function associated with its activation. One of the effects associated with P2Z/P2X7 activation in other cell types is the induction of apoptosis.8,42 43 To investigate this possibility, we incubated DCs with ATP for 30 minutes and subsequently with medium alone for 6 hours more. First, ATP-treated DCs were evaluated morphologically. As ascertained by double staining with acridine orange (green labeling) and propidium iodide (red labeling), the DCs presented morphologic characteristics of apoptotic cells upon ATP treatment (Figure 11B): (1) chromatin condensation, evidenced by the increased fluorescence intensity of the nucleus; (2) fragmented nuclei; and (3) apoptotic bodies. Interestingly, even the nonviable cells, labeled with propidium iodide, presented fragmented nuclei (Figure 11B, right panel), an indication of secondary necrosis that follows the initial apoptosis.
ATP treatment induces morphologic changes in DCs compatible with apoptosis.
DC suspension was incubated with ATP (5 mmol/L) for 30 minutes at 37°C, washed twice with PBS, and incubated additionally for 6 hours in complete RPMI 1640 medium. DCs were incubated immediately before the analyses with acridine orange (5 μg/mL) and propidium iodide (10 μmol/L) to determine nuclear morphology and cell integrity, respectively. The DC apoptotic phenotype was ascertained by laser scanning confocal microscopy. The right panels represent the images of fluorescence data and the left ones represent the corresponding transmitted images. (A) Control DCs were viable, presenting green-labeled round nuclei. (B) The ATP-treated DC suspension presented cells with features associated with different stages of apoptosis: chromatin condensation (increased nuclei fluorescence), fragmented nuclei and apoptotic bodies (arrows), and secondary necrosis (fragmented nuclei labeled red with propidium iodide). Bar: 10 μm.
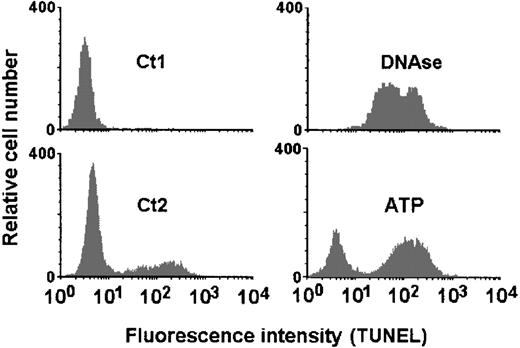
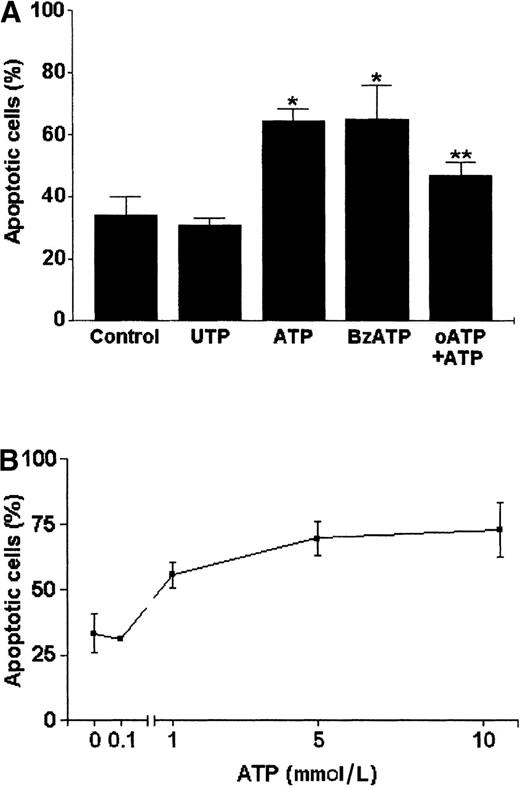
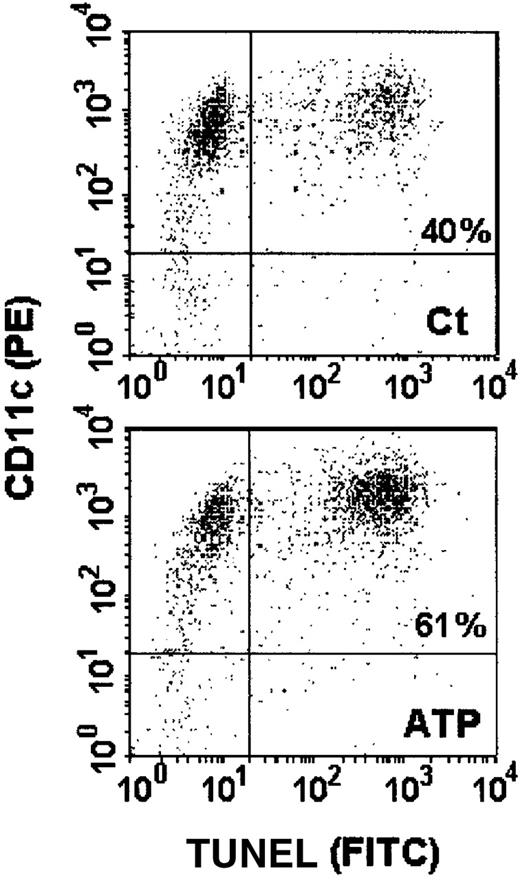
In subsequent experiments, the executive phase of apoptosis characterized by genomic DNA cleavage was ascertained by the TUNEL technique. The incorporation of FITC-conjugated dUTP could be evidenced as an increase in fluorescence profile of the cells when analyzed by flow cytometry (Figure 12). A high concentration of ATP as that applied to permeabilize the cells (5 mmol/L) induced a significant increase in apoptotic DCs (65% ± 4.4%) when compared with controls (35.4% ± 7.6%) (Figure 13A). This effect was dose dependent (Figure 13B), and the EC50 was 0.989 mmol/L. DC phenotype was ascertained by labeling the cells with the anti-CD11c mAb before the TUNEL assay. Thus, we confirmed that all cells analyzed, independent of being resistant or susceptible to ATP-induced apoptosis, presented the DC CD11chigh phenotype (Figure14).
ATP-induced apoptosis detected by the TdT-mediated dUTP nick end labeling (TUNEL) technique.
DCs were incubated with ATP (5 mmol/L) for 30 minutes at 37°C, washed twice with PBS/BSA, and incubated additionally for 6 hours in complete RPMI medium. Apoptosis was ascertained by the TUNEL technique and flow cytometry. The resulting fluorescence intensity profiles of control DCs (lower left histogram; Ct2) and those treated with 5 mmol/L ATP (lower right histogram; ATP) are shown. As a negative control, DCs were incubated with FITC-conjugated dUTP only (upper left histogram; Ct1) without TdT. Positive control was performed by treating the DCs with DNAse (10 μg/mL) immediately before incubation with TUNEL reaction mixture (upper right histogram; DNAse).
P2ZP2X7 activation-dependent apoptosis of DCs.
(A) DCs were incubated with UTP, BzATP, or ATP (all at 5 mmol/L) for 30 minutes at 37°C; washed twice with PBS/BSA; and incubated additionally for 6 hours in complete RPMI 1640 medium. Alternatively, DCs were incubated with 500 μmol/L of the P2Z/P2X7 antagonist, oATP, for 2 hours before ATP (5 mmol/L) treatment. The DCs treated with oATP plus ATP (oATP + ATP) were compared with the control untreated DCs (Control) and with those treated with ATP alone (5 mmol/L). Data are based on at least 3 independent experiments. The results (mean ± SD) were compared with Student t test. *Data from DCs treated with ATP or BzATP were significantly different from control (P < .001); **data from ATP-treated DCs submitted to oATP inhibition were significantly different from ATP-treated DCs (P < .001). (B) Dose-response curve of ATP-induced apoptosis. Apoptosis was ascertained by the TUNEL technique and flow cytometry. Data are based on 3 independent experiments (mean ± SD).
Anti-CD11c antibody labeling of apoptotic and nonapoptotic DCs.
The DCs were treated with 5 mmol/L ATP for 30 minutes, washed, and incubated for an additional 6 hours. These cells were then labeled with the anti-CD11c mAb before the detection of apoptosis by TUNEL. The dot plots show the double labeling for CD11c (PE) and TUNEL (FITC) of either control cells (Ct) (upper panel) or those treated with ATP (ATP) (lower panel).
To analyze whether the ATP-induced apoptosis of DCs is mediated specifically by P2Z/P2X7 activation, we incubated the DCs with 500 μmol/L of the antagonist oATP for 2 hours before the treatment with ATP. As shown, this antagonist significantly inhibited the apoptotic effect triggered by ATP (P < .001) (Figure 13A). Additionally, the P2Z/P2X7-specific receptor agonist BzATP also induced DC apoptosis, in contrast to UTP, which did not induce this effect (Figure 13A).
Evaluation of costimulatory molecules in ATP-treated DCs
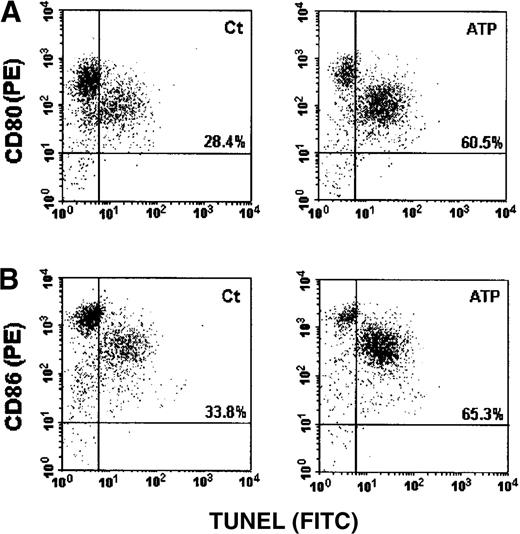
After normalizing ATP-induced apoptosis, we observed that only 39.6% of the DCs entered apoptosis after treatment with 10 mmol/L ATP (Figure 13B). Thus, not all DCs are susceptible to ATP-induced apoptosis. To verify whether the apoptosis-resistant DCs had been activated by a purinergic stimulus, we evaluated the expression of costimulatory molecules CD80 (B7.1) and CD86 (B7.2) because up-regulation of these molecules has been related to DC activation by different inflammatory stimuli.44 45 For this purpose, we labeled the cells with anti-CD80 and anti-CD86 mAbs before the TUNEL assay. Thus, we could analyze the expression of these costimulatory molecules in apoptotic and nonapoptotic cells after ATP treatment. As expected, DCs presented a high expression of CD80 and CD86 molecules (Figure 15A,B). Such expression was not modified in apoptosis-resistant cells after ATP treatment. Conversely, the expression of both molecules was decreased in cells susceptible to ATP-induced apoptosis.
Evaluation of CD80 and CD86 expression on apoptotic and nonapoptotic DCs following ATP treatment.
DCs were exposed to ATP for 30 minutes, washed, and incubated for an additional 6 hours. They were then labeled with the PE-conjugated anti-CD80 (B7.1) or anti-CD86 (B7.2) mAb before the detection of apoptosis by TUNEL (FITC). The dot plots show the CD80 (A) or CD86 (B) and TUNEL double labeling of control cells (Ct) (left panel) and those treated with 5 mmol/L ATP (ATP) (right panel).
Discussion
Studies concerning P2 receptors and their importance in cell and systemic physiology have increased substantially46 since Drury and Szent-Györgyi's pioneering work.3 The P2 receptors have been described in many cell types, either excitable or not, and the effects observed upon their activation are quite variable.2 5 In the present work, we demonstrate the expression of the P2Z/P2X7 purinoceptor in murine spleen–derived DCs and the relation of this receptor to ATP-induced apoptosis in these cells.
The basic approach used to characterize the P2Z/P2X7 purinoceptor was the dye-uptake assay, ascertained by fluorescence microscopy and cytofluorometry. Different molecular-weight fluorescent probes were tested, and most of them (ethidium bromide, a 314-d cation; YO-PRO 1, a 374-d cation; and lucifer yellow, a 443-d anion) entered into ATP-treated DCs, except for the nonfluorescent probe trypan blue (Mr 961), which did not cross the cell membrane. These results are consistent with those described in other cell types such as macrophages, microglia, and lymphocytes, whose P2Z/P2X7-associated pores are permeable to low-molecular-weight dyes.36,47 48
In DCs, the permeabilization phenomenon was effectively seen with ATP concentrations higher than 100 μmol/L, a result that is consistent with the high concentrations necessary to activate the P2Z/P2X7 receptor, as compared with the requirements of all other P2X and P2Y purinoceptor subtypes, which can be activated with ATP concentrations as low as 1 μmol/L.4,5,8 When the permeabilization was performed in divalent cation–depleted medium, a shift in ATP EC50 was observed from 0.721 mmol/L in standard medium to 0.094 mmol/L. This finding can be explained in 2 ways: (1) In standard medium, Mg2+ and Ca2+ can bind to fully ionized ATP4− forming MgATP2− and CaATP2− complexes,38 which have not been described as active ligands of the P2Z/P2X7receptor,49,50 thus affecting the available active ATP4− concentration; or (2) DCs express Ca2+/Mg2+-dependent ectonucleotidases that hydrolyze ATP4−, reducing its concentration.39 We observed that both factors are involved because application of extra MgCl2 before ATP treatment blocked the permeabilization effect. In addition, the previous treatment of DC suspension with 5′FSBA, an irreversible ectonucleotidase inhibitor, significantly increased the ATP permeabilization effect. Moreover, when the dose-response curves were plotted as a function of ATP4− concentration, the EC50 and the curves obtained under these different conditions (using standard or divalent cation–depleted media) did not overlap, thus also supporting the action of Ca2+/Mg2+-dependent ectonucleotidases on DCs, as previously described.39
Additionally, based on the dose-response curve obtained under standard conditions (medium without EDTA), a Hill coefficient of 2.46 was found, which is very close to that attributed to the P2Z/P2X7 purinoceptor present in macrophages (2.4-3),51 lymphocytes (2.3),47 and mast cells (1.6-2.1),52 suggesting that this receptor presents at least 2 binding sites to the ligand.
In our permeabilization assays, even under optimized conditions, no more than 70% of the DCs became permeabilized when treated with ATP. Such a permeabilization resistance cannot be merely attributed to possible ATP-resistant contaminant cells because they were all CD11c+. Therefore, mechanisms other than Ca2+/Mg2+-dependent ectonucleotidases may be affecting P2Z/P2X7 activation. Even a differential expression of the receptor cannot be discarded because 3 phenotypically distinct subpopulations of DCs were characterized recently in the spleen53 54: CD8α+DEC205+CD11b, CD8α−DEC205−CD11b+, and CD8α+- DEC205+CD11bdull, with all of them presenting the CD11chigh MHC IIhigh phenotype.
Among the various nucleotides tested, only ATP, BzATP, and the nonhydrolyzable ATPγS were able to induce membrane permeabilization in DCs. Such an agonist selectivity matches that described for the P2Z/P2X7 receptor.11,12Accordingly, ATP-mediated permeabilization was completely blocked by long-term treatment with 300 μmol/L oATP, a well-established P2Z/P2X7 inhibitor.40 Moreover, an increase in intracellular calcium was detected after ATP application, which was blocked when calcium-free saline was perfused, demonstrating its extracellular origin. All of these features strongly suggest the presence of P2Z/P2X7 receptors in murine spleen–derived DCs.
Interestingly, recent studies have also suggested the expression of P2Y receptors on DCs.55 56 In our calcium microfluorometric assays, we also tested the effect of UTP on DCs. However, the calcium responses to UTP were not consistent. We obtained calcium responses in 3 experiments and no response in 4 experiments. In this case, we need to consider the interference of ectonucleotidases, receptor desensitization, and even the DC mature phenotype.
In a second vein, we investigated a putative role of the P2Z/P2X7 purinergic receptor in inducing apoptosis in DCs, as described previously for macrophages8,16,17 and recently for D2SC/1 cells, an immortalized DC line.57 Using double staining with acridine orange and propidium iodide, we ascertained that ATP-treated DCs presented morphologic alterations associated with different stages of apoptosis, such as chromatin condensation, fragmented nuclei, apoptotic bodies, and secondary necrosis.58 Additionally, DNA cleavage, an important apoptosis signal, was evidenced and quantified by the TUNEL technique. The flow cytometric analysis of DCs assayed by TUNEL showed that the ATP treatment induced a significant increase of apoptotic cells from the basal level of 34.08% ± 5.8% in control cultures to 64.46% ± 3.8% after 5 mmol/L ATP treatment.
Spontaneous apoptosis of cultured DCs was described by Ludewig et al.59 To see whether such basal apoptosis was also due to ATP spontaneously released in the culture medium, we incubated the cells with the P2Z/P2X7 antagonist oATP during the last phase of DC isolation, which consists of an overnight incubation at 37°C. Nevertheless, under this condition the basal value of cells undergoing apoptosis was not significantly modified (data not shown), suggesting that it is not mediated by the P2Z/P2X7 receptor.
When the data were normalized, we observed that the apoptotic effect induced by ATP reached a maximum of 39.6% of the DC population. The DC phenotype of the ATP-induced apoptosis-resistant population was confirmed by anti-CD11c antibody labeling. Additionally, these cells already presented an activated phenotype, expressing high levels of CD80 and CD86 costimulatory molecules. Such an apparently mature phenotype is likely due to the isolation procedure adopted,60 which was based on differential adherence properties of DCs. Interestingly, the apoptotic DCs presented a diminished expression of these molecules when compared with the nonapoptotic ones. Such a loss of surface molecules has been described and was related to the apoptotic process.61 In contrast, Berchtold et al62 have demonstrated an increased expression of CD80 and CD86 molecules in maturing DCs treated with ATP, suggesting the involvement of P2 receptors in their activation. Thus, further investigation that takes into account both immature and mature DC phenotypes is necessary to clarify the relative importance of the P2Z/P2X7 receptor in determining the DC activation status.
To verify the receptor specificity of such ATP-induced apoptosis, we treated DCs with the P2Z/P2X7 antagonist oATP (500 μmol/L), which significantly inhibited the ATP-induced apoptosis. Such an inhibition was partial because the apoptotic response did not return completely to control levels. Thus, the concomitant participation of other P2 receptor subtypes in apoptosis induction cannot be discarded. However, in our experiments when we treated DCs with UTP (5 mmol/L), a P2Y agonist, we were unable to induce apoptosis in DCs, in contrast to BzATP, which also resulted in apoptosis induction. Hence, the possible co-participation of other P2 receptors may be limited to those of the P2X subtypes.
Specific cytotoxicity induced by the P2Z/P2X7purinoceptor has been widely described. The ATP-sensitive J774 macrophage cell line, expressing a high level of P2Z/P2X7 receptors, presents an increased rate of spontaneous cell death in culture.42 Similarly, embryonic kidney cells (HEK293) transfected with P2X7 cDNA underwent apoptosis when exposed to ATP.43 Interestingly, in macrophages, P2Z/P2X7 activation has been associated with differentiation63 and with an improvement of mycobactericidal activity that is followed by cell death by apoptosis.17 Therefore, it is conceivable that apoptosis induction contributes to the elimination of intracellular parasites and infected cells.
In the case of DCs, an enhancement of their effector functions by P2Z/P2X7 activation also needs to be investigated because fetal skin–derived DCs showed reduced antigen-presenting capacity when treated with oATP, the P2Z/P2X7 antagonist.64 In addition, ATP has acted synergistically with tumor necrosis factor-α, inducing human monocyte–derived DC maturation.62 This possible activation function may have many implications because DCs exert a major role as antigen-presenting cells and have been involved in the initiation of diverse autoreactive responses, such as thyroiditis and experimental allergic encephalomyelitis.65 66 In this context, we cannot discard the possibility that the apoptosis induced by P2Z/P2X7 activation in mature DCs may consist of a mechanism that self-limits and negatively controls their function, avoiding the possible induction of undesired autoimmune responses. We hope that further investigation will clarify this putative dual function of the P2Z/P2X7purinoceptor in DCs, namely to induce cell activation while simultaneously self-limiting the initiated response.
Acknowledgments
We thank Dr Mireille Dardenne (Hospital Necker, Paris, France) for providing the anti-CD11c mAb (N418 clone), Dr Tania C. de Araújo Jorge (Oswaldo Cruz Foundation, Rio de Janeiro, Brazil) for providing the anti-FcγRII/FcγRIII mAb (clone 2.4G2), and Dr Adriana Bonomo (National Cancer Institute of Rio de Janeiro, Brazil) for helping us to isolate dendritic cells in the beginning of this work.
Supported in part by grants from CNPq, PRONEX/CNPq, PADCT/CNPq, and FAPERJ (Brazil).
Reprints:Luiz Anastácio Alves, Laboratório de Pesquisas sobre o Timo, Departamento de Imunologia, Instituto Oswaldo Cruz–Fundação Oswaldo Cruz, Av. Brasil, 4365, Manguinhos, 21045-900, Rio de Janeiro, Brazil.
The publication costs of this article were defrayed in part by page charge payment. Therefore, and solely to indicate this fact, this article is hereby marked “advertisement” in accordance with 18 U.S.C. section 1734.

This feature is available to Subscribers Only
Sign In or Create an Account Close Modal