Abstract
Down-modulation of CD3ζ expression on CD8 T lymphocytes occurs, independently of other T-cell receptor (TCR)-CD3 components, in tumor-infiltrating lymphocytes, human immunodeficiency virus infection, and autoimmune disease. These associations suggest that it might be related to chronic antigenic stimulation. CD3ζ down-modulation was found, however, in CD8 T cells that proliferate in response to acute viral infections. In 3 otherwise healthy donors with acute gastroenteritis, infectious mononucleosis, and Epstein–Barr virus/cytomegalovirus/mononucleosis, 30% to 60% of circulating CD8 T cells had down-modulated CD3ζ to below the level of detection. The CD3ζ-T cells were also CD28− but expressed the activation markers HLA-DR and CD57. CD3ζ–CD28– T cells are effector CTL because they express perforin and produce IFN-γ, but not IL-2, on activation and contain the viral-specific cytotoxic T lymphocyte (CTL). However, CD3ζ–CD28–T cells generally do not express CD25 after anti-CD3 and anti-CD28 stimulation and are not cytotoxic until they are cultured with IL-2 overnight. Cytotoxicity coincides with the re-expression of CD3ζ but not CD28. Down-modulation of CD3ζ and CD28 on effector CTL may control CTL triggering and proliferation to prevent immunopathogenesis.
Down-modulation of CD3ζ on CD8 T lymphocytes, without concomitant down-modulation of other T-cell receptor (TCR-CD3) components from the cell surface, was initially described in tumor-bearing mice and later in various human tumors.1-3 A large proportion of CD8 T lymphocytes in human immunodeficiency virus (HIV)-infected donor peripheral blood mononuclear cells (PBMC), in the joints of patients with rheumatoid arthritis, and in the circulation of patients with systemic lupus erythematosis also has down-modulated CD3ζ expression.4-7 Not surprisingly, down-modulation of CD3ζ is associated with T-cell signaling abnormalities.1,4,7 Therefore, it has been suggested that in cancer and HIV infection, the down-modulation of CD3ζ contributes to the lack of effective immune surveillance by CD8 effector cytotoxic T lymphocyte (CTL). The down-modulation of CD3ζ on CD8 T cells in cancer and in HIV infection can be reversed by brief exposure to IL-2, suggesting that anergy or tolerance in the CD4 T cell antigen-specific response to tumors or the elimination of HIV-specific CD4 T cells by HIV infection may be the source of the CD8 T-cell functional deficit in these diseases.5 8-10
Because cancer, HIV infection, and autoimmune disease are chronic diseases, it was also reasonable to suspect that CD3ζ down-modulation might be caused by immune dysregulation induced by persistent antigen. Manjunath and colleagues11 recently developed a transgenic mouse model in which green fluorescent protein (GFP) expression is driven from the CD4 promoter and proximal enhancer. In this model, GFP is expressed in both naive and recently activated CD4 and CD8 T cells. However, at the time of CD8 T-cell differentiation to effector CTL beginning 4 days after exposure to a neoantigen, GFP expression is turned off in the antigen-specific cells. Sorted GFP–cells contain all the CD8 T cells capable of antigen-specific IFN-γ production and specific cytotoxicity and have reduced expression of CD3ζ mRNA by reverse transcription–polymerase chain reaction assay. The fact that CD3ζ mRNA is reduced within the first week of encounter with an antigen suggests that modulation of CD3ζ might be a feature of the immediate CD8 T-cell response to acute infection or other antigenic encounter. These results in mice prompted us to look at CD3ζ expression in CD8 T cells responding to acute human infections.
In this article we will show that CD3ζ down-modulation is a common feature of the early CD8 response to infection. CD3ζ down-modulation during acute and chronic infection is accompanied by the loss of expression of the principal costimulatory receptor CD28. On activation, the CD3ζ–CD28– CD8 T cells do not produce IL-2 or express CD25, the high-affinity IL-2 receptor α chain. Moreover, their cytotoxic function requires exposure to IL-2. These changes in critical T-cell activation properties are likely to be part of the natural regulation of CD8 T-cell function and survival to prevent immunopathogenesis. These modifications in the IL-2 pathway on CD8 T cells are likely to make previously activated CD8 T cells more dependent on antigen-specific CD4 T cell help than are their naive predecessors.
Patients, materials, and methods
Subjects
Subjects were otherwise healthy volunteers with acute viral infections. Informed consent was obtained, and the study was approved by the Institutional Review Board. Subject AI-1 had malaise on day 1 and then had sore throat, fever, fatigue, and lymphadenopathy. Monospot test results were positive, and EBV seroconversion findings were consistent with acute infectious mononucleosis (AIM). Subject AI-2 had fatigue, low-grade fever, and noticeable lymphadenopathy that began a few days earlier; chronic fatigue and malaise persisted for several months. Serologic study results showed evidence of prior EBV and CMV infections. Subject AI-3 had malaise on day 1 and the next day had fever, nausea, vomiting, and diarrhea that lasted for 2 days. Samples were either fresh or cryopreserved using a programmed cell freezer (model 9000; Gordinier, Roseville, MI). Results from thawed cells were comparable to those from freshly isolated cells in 2 samples. Lymphocyte counts were obtained on a Coulter Max M counter (Coulter, Hialeah, FL).
Flow cytometry
For external staining, freshly isolated PBMC (2-10 × 105/tube) in 50 μL FACS buffer (phosphate-buffered saline with 2% fetal calf serum and 0.02% NaN3) were stained with 2 μL each of CD4-Cy-Chrome (monoclonal antibody [mAb] RPA-T4; Pharmingen, San Diego, CA) and CD8-PE (mAb B9.11; Immunotech, Westbrook, ME), CD20-PE (mAb B9E9; Immunotech) and CD3-Cy5 (mAb; UCHT1, Immunotech), or CD8-Cy5 (mAb B9.11; Immunotech) with CD28-PE (mAb CD28.2; Immunotech), HLA-DR-PE (mAb 357; Immunotech), CD38-PE (mAb T16; Immunotech), CD57-PE (mAb NC1; Immunotech), or IgG-fluorescein isothiocyanate (FITC), IgG-PE, and IgG-Cy5 isotype-matched controls (Immunotech). After incubation for 15 minutes at 4°C, washed cells were permeabilized using the Caltag Laboratories (Burlingame, CA) Fix and Perm Kit according to the manufacturer's protocol and stained for 15 minutes at room temperature with 1 μL CD3ζ-FITC (mAb 6B10.2; Santa Cruz Biotechnology, Santa Cruz, CA) or perforin-PE (mAb δG9; Pharmingen). Washed cells in FACS buffer plus 2% formaldehyde were analyzed on a tightly gated lymphocyte population using FACScalibur (Becton Dickinson). Gates for external markers were defined by requiring that fewer than 1% of the control antibody-stained cells were positive. Gates for internal markers were determined using CD20-staining cells as an internal negative control. This is particularly important for obtaining reproducible results because CD3ζ staining is continuous. With the internal negative control, CD3ζ staining results varied by only ±3% in independent staining experiments; results were also reproducible between fresh and thawed samples.12 For some experiments, analysis was performed on gated CD8 T cells; the gates were set on CD8bright cells to exclude most natural killer (NK) cells, which stain for CD8 with approximately a log lower intensity than CD8 T cells.
T-cell activation
PBMC were stimulated with 1 ng/mL anti-CD3 mAb12F6 and 0.5 μg/mL anti-CD28 mAb L293 (Becton Dickinson) or with 10 ng/mL anti-CD3 and 1 ng/mL phorbol 12-myristate 13-acetate (PMA) (Sigma, St. Louis, MO) and cultured overnight at 2 × 10⁶/mL in T-cell medium13 before staining for CD8-Cy5 and CD3ζ-FITC with CD69-PE (mAb L78; Becton Dickinson) or CD25-PE (mAb 2A3; Becton Dickinson).
Cytokine production
Freshly isolated or cryopreserved PBMC (3 × 10⁶) were activated as above in T-cell medium with 10 μmol/L Brefeldin A (Sigma).14 15 After 6-hour or overnight incubation, harvested cells were stained for Cy-5-CD8 and FITC-CD28, FITC-CD57, or FITC-DR. Samples were fixed and permeabilized as above, split in 2, and stained with FITC-conjugated anti-CD3ζ and 5 μL PE-IFN-γ mAb 25723.11 or PE-IL-2 mAb (5334.2) (R&D Systems, Minneapolis, MN). Control samples were stained with PE-MsIgG1 (R&D Systems).
Cytotoxicity assay
PBMC were either freshly isolated or cultured overnight in T-cell medium with and without 600 IU/mL rIL-2 (Chiron Oncology) and tested in a 4-hour chromium 51Cr release assay against EBV-transformed B cells as described.13 For some experiments, PBMC were positively selected just before cytotoxicity assay for CD38 or CD28 expression using Miltenyi beads according to the manufacturer's protocol.
Annexin V staining
Cryopreserved PBMC were incubated overnight with 0, 200, or 1200 IU/mL rIL-2 in T-cell medium. To test for cell apoptosis, 105 PBMC in 50 μL FACS buffer were stained with CD8-Cy5 and CD28-PE as above, washed, and resuspended in 100 μL phosphate-buffered saline with 2.5 mmol/L CaCl2 and 5 μL Annexin V–FITC (Pharmingen). After staining for 15 minutes at room temperature, cells were analyzed immediately using gates set with annexin V-unstained control samples.
Results
CD3ζ is down-modulated on CD8 T cells during acute viral infection
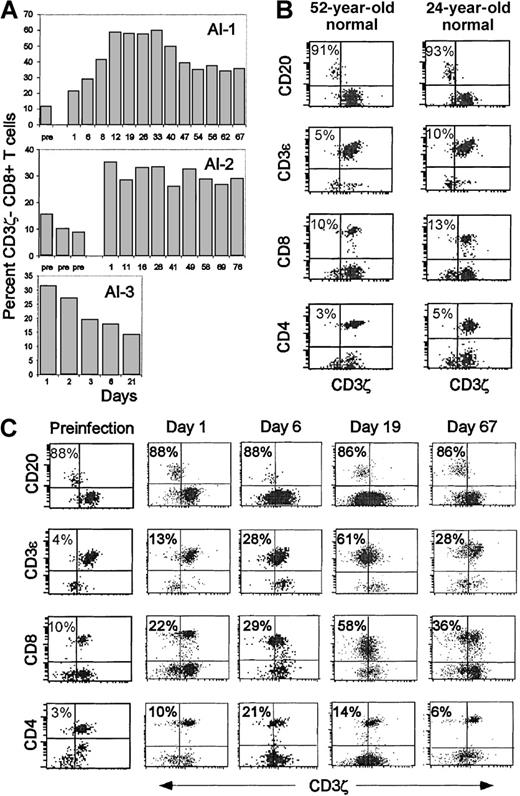
Although a substantial fraction of circulating CD8 T cells in patients with lymphoma, HIV infection, or systemic lupus have down-modulated CD3ζ,3,5,7 16 in 7 healthy donors only 9% ± 4% of CD8 T cells did not stain above background for CD3ζ. Two apparently healthy subjects (AI-1 and AI-3) had an unexpectedly large proportion (22% and 31%) of CD3ζ− CD8 T cells (Figure1). Later in the day, malaise and fever developed in each. AI-1 had acute infectious mononucleosis, and AI-3 had presumed viral gastroenteritis. Serial samples obtained during the disease and post-convalescence were analyzed for CD3ζ expression. In patient AI-3, who had completely recovered by day 5, the proportion of CD3ζ− cells was highest on the first day, declined steadily to 17% by day 6, and was 14% 3 weeks later. For patient AI-1 and another patient (AI-2) with acute mononucleosis syndrome probably secondary to acute HSV infection, an expansion of CD3ζ− cells persisted for more than 2 months. In fact, almost half the circulating CD8 T cells in patient AI-1 remained CD3ζ–CD28– until the last time point 7 months after the acute infection. The percentage of CD3ζ− cells dramatically increased for subject AI-2 from a baseline value of 8-15% in 3 samples obtained before the onset of symptoms to 35% a few days after he first had symptoms. However, the onset of symptoms for this subject was insidious; he did not have a well-documented acute prodrome as subject AI-1 did, so it was difficult to pinpoint the time of infection. Therefore, it is likely that we missed the upswing of activated cells that we captured for subject AI-1. CD3ζ down-modulation was observed on only a small proportion of CD4 T cells in subject AI1(Figure 1C) and subject AI-2 (not shown); however, a CD4 lymphocytosis did not occur. (Figure 2A)
Increased percentage of circulating CD3ζ− CD8 T cells in otherwise healthy subjects during acute viral infection.
(A) Three healthy donors were analyzed for CD8 T cell CD3ζ chain expression before, during, and after recovery from 3 different acute viral infections. Subject AI-1 had acute EBV infection, AI-2 had EBV–CMV– infectious mononucleosis syndrome, and AI-3 had presumed viral gastroenteritis. The percentage of CD3ζ− CD8 T cells in freshly isolated PBMC was determined by flow cytometry on gated lymphocytes using CD20+ B cells as an internal CD3ζ− population to set the CD3ζ gate. Day 1 corresponds to the onset of symptoms; day 1 samples were obtained from subjects 1 and 3 before they knew they were becoming ill. At time points before day 1, the subjects had been studied as normal controls. (B) Representative flow cytometry dot plots on gated lymphocytes, dually stained with PE-conjugated antibodies to CD20, CD3ε, CD4 or CD8, and CD3ζ− FITC, are shown for 2 normal donors. (C) Similar analysis for subject AI-1 on samples obtained either several months before the onset of symptoms or on days 1, 6, 19, and 67 after the onset of symptoms. Three-color staining with antibodies to CD3ε, CD3ζ, and CD8 in some samples (not shown) corroborated that the CD8+CD3ζ− cells are CD3ε+ T cells.
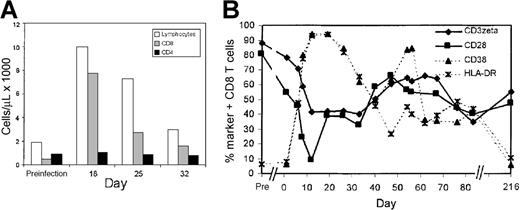
Expanded CD8 T cells during acute infectious mononucleosis down-modulate CD3ζ and CD28 and up-regulate cell surface expression of T-cell activation markers.
(A) Lymphocyte expansion in subject AI-1 is primarily in the CD8 T-cell subset. (B) Expansion of CD3ζ− and CD28− CD8 T cells occurs in parallel in acute infectious mononucleosis. Initially, a larger proportion of expanded cells expressed CD38 and HLA-DR than down-modulated CD3ζ and CD28. In a post-convalescence sample 7 months later, the proportion of CD3ζ− and CD28− CD8 T cells remained elevated and encompassed approximately half of all CD8 T cells, whereas CD38 and HLA-DR expression returned to baseline values. Flow cytometry was performed on gated CD8−Cy5 bright lymphocytes.
Because CD8 is also expressed, albeit at lower levels, on some NK cells, it was important to be certain that the CD3ζ− CD8+ cells were not NK cells. Most of the CD3ζ− lymphocytes in the blood were also CD3ε+, as expected for T lymphocytes but not for NK cells (Figure 1C). The continued cell surface expression of the other components of the TCR is a common property of the CD3ζ− down-modulated T cells in cancer and HIV infection. Moreover, the samples from subjects AI-1 and AI-2 never contained more than 7% CD16+ lymphocytes (data not shown), which places an upper limit on the numbers of NK cells in the samples. In subsequent analysis, the properties of CD8 T cells were analyzed by gating only on CD8bright cells to exclude the small numbers of NK cells.
CD3ζ− CD8 T cells are also CD28− and express activation markers and perforin
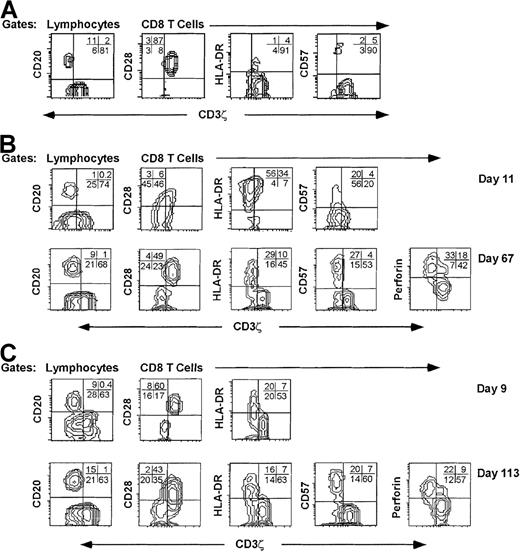
Eighteen days after symptoms began, the CD8 T-cell count of patient AI-1 with infectious mononucleosis had increased 15-fold. (Figure 2A) In a preinfection sample obtained months before the onset of symptoms, 90% of CD8 T cells were CD3ζ+, 82% were CD28+, and fewer than 10% expressed either HLA-DR or CD38. This is similar to the pattern of expression of these markers in healthy normal donors.17After 2 weeks, more than 90% of the CD8 T cells expressed the activation markers CD38 and HLA-DR and had down-modulated CD28 (Figure2B). After 3 weeks, the proportion of CD8 T cells that were CD38+, HLA-DR+, or CD28− began to fall but still represented a sizable minority of all CD8 T cells (30% to 50%) after 2 months. Approximately 60% of the CD8 T cells in samples 10 to 30 days after the onset of symptoms had down-modulated CD3ζ below background. This percentage declined to approximately 40% 2 months later. In a postconvalescent sample 7 months after acute infection, 55% of CD8 T cells still did not express CD3ζ above background and 47% were CD28−. By this time, CD38 and HLA-DR expression had reverted to preinfection levels. Throughout the disease, CD28 and CD3ζ down-modulation occurred in parallel. To determine the features of CD3ζ− cells, PBMC were costained for CD3ζ and other markers in samples obtained during acute infection and convalescence (Figure3). The CD3ζ+ CD8+ T cells obtained at all times generally had the phenotype of unactivated T cells. They were CD28+, HLA-DR−, CD57−, and mostly did not contain perforin. The CD3ζ− T cells generally had down-modulated CD28. In the day 11 sample from subject AI-1, however, a proportion of the CD28− CD8 T cells expressed CD3ζ, suggesting that the down-modulation of CD28 may precede the down-modulation of CD3ζ. Similarly, in the day 113 sample from donor AI-2, some of the CD28– cells were CD3ζ+, suggesting that CD3ζ may begin to reappear on previously CD3ζ− CD28− cells. Most CD3ζ− CD8 T cells in acute and convalescent samples expressed HLA-DR. CD57 expression was a characteristic feature of most CD3ζ− CD8 T cells in the convalescent samples, but not in the acute sample assayed. This suggests that up-regulation of CD57 may be a delayed phenomenon. In convalescent samples, more than 90% of the CD3ζ− CD8 T cells stained for perforin, the critical effector molecule for CTL granule-mediated lysis.18 Perforin staining, which is not completely reproducible on thawed cells, was not performed on the samples obtained during the primary infection.
CD8 T cells with down-modulated CD3ζ have an activated/effector cell phenotype.
PBMC from representative samples from a normal donor (A) and from subjects AI-1 (B) and AI-2 (C) obtained during the acute infection (days 11 and 9, respectively) and convalescence (days 67 and 113, respectively) were stained for CD3ζ and CD20 and for CD3ζ, CD8 and CD28, HLA-DR, CD57, or perforin. The CD8 contour plots were obtained by gating on CD8−Cy5 bright cells. For the normal donor, most CD8 T cells are CD3ζ+ CD28+ HLA-DR- CD57−. In acute infection samples, the CD3ζ− CD8 T cells are mostly CD28− and HLA-DR+. In convalescence samples CD3ζ down-modulated CD8 T cells are mostly CD28–, HLA-DR+, CD57+, and perforin+. Quadrants were set using CD20+ B cells (y axis) as internal negative controls for background CD3ζ staining (x axis). Similar phenotypic profiles of CD3ζ− CD8 T cells were seen in samples obtained serially throughout the illnesses (not shown).
CD3ζ− down-modulated CD8 T cells are relatively resistant to activation and do not express CD25 when activated
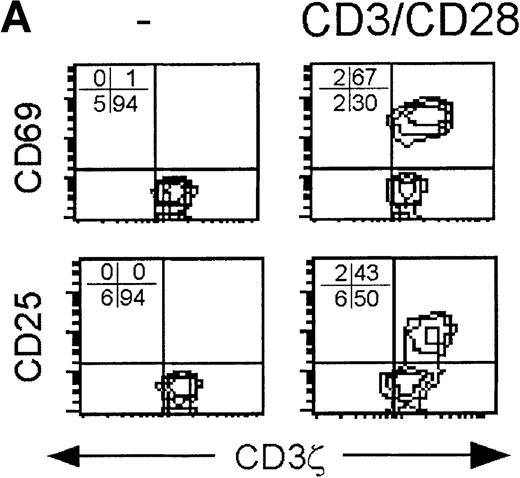
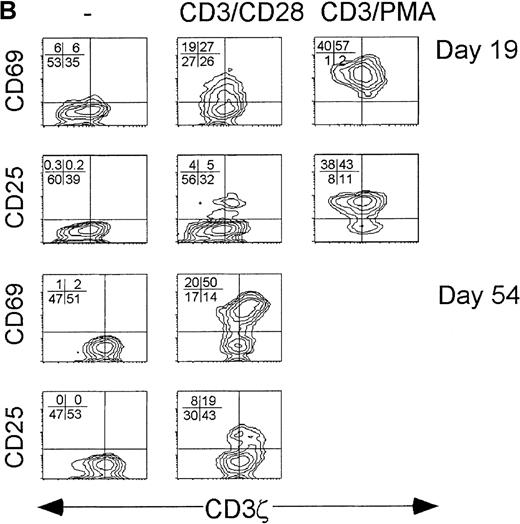
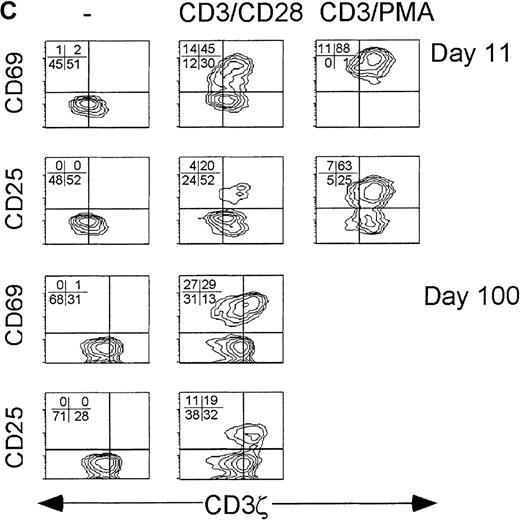
Because the CD3ζ− CD8 T cells had down-modulated both the key proximal signaling chain of the TCR and the principal costimulatory receptor, activation by suboptimal concentrations of anti-CD3 and anti-CD28 cross-linking antibodies was compared to supraphysiological stimulation with 10-fold more anti-CD3 and PMA in samples obtained during acute infection. With supraphysiological stimulation, all CD8+ T cells, whether CD3ζ− or not, were activated to express CD69 24 hours later. Although CD25 was not detected on all activated cells the next day, the CD3ζ− and CD3ζ+ CD8 T cells were comparable in their expression of CD25. However, after stimulation with 10-fold less anti-CD3 and with anti-CD28 in place of PMA, only the CD3ζ+ CD8 T cells expressed CD25 after activation. In convalescence samples after suboptimal stimulation, CD25 was also only expressed by the CD3ζ+ subpopulation. The CD3ζ− CD8 T cells in the convalescence samples also expressed less CD69 than the CD3ζ+ CD8 T cells after suboptimal stimulation. (Figure 4) Therefore, the pathways required to induce expression of the high-affinity IL-2 receptor were not activated in the CD3ζ− subpopulation unless PMA stimulation was provided.
CD3ζ− CD8 T cells are not activated by CD3ε/CD28 cross-linking to express the high-affinity IL-2 receptor.
Cell surface expression of the early activation markers CD69 and CD25 was measured on gated CD8 T cells after overnight culture without activation (left) or with activation by either low concentration anti-CD3ε and anti-CD28 (middle) or with high concentration anti-CD3ε and PMA (right). Samples shown were obtained from (A) a normal donor, (B) subject AI-1 on day 19 and day 54, and (C) subject AI-2 on day 11 and day 100. The level of cell surface expression of CD69 in the induced patient samples was also somewhat reduced in the CD3ζ− down-modulated population.
Freshly isolated CD8 T cells from a patient with acute infectious mononucleosis are not cytotoxic against EBV-transformed targets but acquire specific cytotoxicity after overnight exposure to IL-2
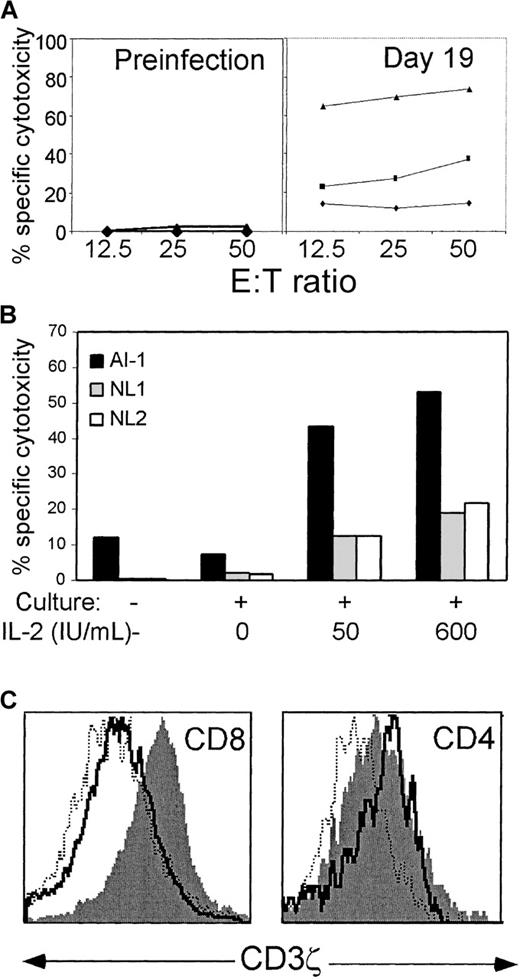
In HIV infection, we found that freshly isolated CD8 T cells are generally not cytotoxic against HIV-expressing target cells but become cytotoxic when exposed to IL-2 in overnight culture. This functional gain coincides with re-expression of CD3ζ.5 To determine the functional properties of CD3ζ down-modulated cells during and after acute infection, we examined the EBV-specific cytotoxicity of PBMC from subject AI-1 with and without culture. No specific cytotoxicity against autologous EBV-transformed B cells was detected at E:T ratios of 12.5-50:1 in a thawed sample obtained before the onset of symptoms of acute infectious mononucleosis, whether assayed fresh or after culture in high concentrations of IL-2 (Figure5A). When day 19 PBMC were assayed before culture, specific cytotoxicity did not rise above the background level of 5%. Specific cytotoxicity increased somewhat to 20% to 30% after overnight culture without exogenous IL-2 but increased dramatically to approximately 70% in the presence of added IL-2. This increase is mostly attributable to antigen-specific lysis and not LAK-like activity because a comparable increase did not occur in the sample obtained before EBV infection and because allogeneic B-LCL targets were not nearly as good targets (Figure 5B). Fresh and cultured cells were also stained for CD3ζ expression in parallel (Figure 5C). As observed during chronic HIV infection, CD3ζ was up-regulated on CD8 T cells in the presence of IL-2. CD28 expression, however, did not change after short-term IL-2 exposure in vitro (data not shown). No similar change in CD3ζ expression occurred in CD4 T cells, but these had normal expression before culture.
Antigen-specific cytotoxicity is dramatically increased after overnight culture in IL-2, which also restores CD3ζ expression.
(A) PBMC from subject AI-1, obtained 19 days after the onset of symptoms, were tested for specific cytotoxicity in a 4-hour51Cr release assay against autologous EBV-transformed B-LCL. PBMC were either uncultured (♦) or cultured with (▴) or without (▪) added IL-2 (600 IU/mL). Overnight culture in IL-2 did not induce lysis by preinfection samples. (B) The enhanced cytotoxicity detected after overnight culture in IL-2 is predominantly antigen-specific. Cytotoxicity of fresh or cultured day 19 PBMC was assayed at an E:T ratio of 20:1 against autologous AI-1 B-LCL and against B-LCL from 2 normal donors, who did not share HLA class I alleles with subject AI-1. (C) Histograms of CD3ζ expression on gated CD4+ and bright CD8+ cells. The solid line depicts uncultured cells, the dotted line represents the cells cultured in the absence of IL-2, and the filled histogram denotes cells cultured in IL-2. Before culture, CD3ζ expression on virtually all CD4 T cells is above background B-cell staining. After culture in IL-2, the mean fluorescence intensity of CD8 T cells becomes comparable to that of CD4 T cells.
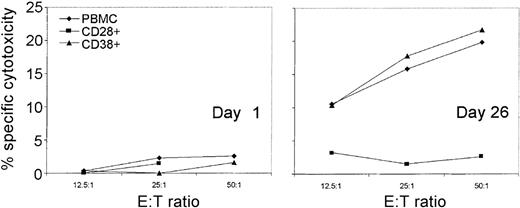
In chronic HIV infection we found, using tetramer staining, that HIV-specific CD8 T cells had down-modulated CD3ζ.43 To determine whether EBV-specific CTL in AIM also have down-modulated CD3ζ, we were unable to use tetramer staining because donor AI-1 did not express any of the HLA class I molecules for which immunodominant EBV alleles have been identified. Moreover, because available CD3ζ antibodies only recognized intracellular determinants, it was not possible to isolate T cells on the basis of CD3ζ expression. However, we took advantage of the parallel down-modulation of CD3ζ and CD28 to examine EBV-specific cytotoxicity in cultures positively selected for CD28 expression (CD28 engagement is not required for cytotoxicity, and antibodies to CD28 do not block CD8 T-cell–mediated cytotoxicity19). Unselected CD38+ or CD28+ PBMC obtained from AI-1 before the onset of symptoms or on day 26 were cultured overnight in 600 IU/mL IL-2 and tested for specific cytotoxicity against autologous EBV-transformed lymphoblastoid cells (Figure6). None of the preinfection cultures displayed significant EBV-specific cytotoxicity. The cultured day 26 PBMC and CD38+ PBMC specifically lysed EBV-transformed targets to a comparable extent; however, the CD28+ population did not contain any EBV-specific CTL. Therefore, most EBV-specific CTL in AIM are CD28− and, by inference, CD3ζ−. However, these cells are generally not functionally cytolytic unless cultured ex vivo in the presence of IL-2.
Antigen-specific CTL are CD28− and CD38+.
For AIM subject AI-1, EBV-specific cytotoxicity by PBMC and selected CD28+ and CD38+ T cells, cultured overnight in 600 IU/mL IL-2, was measured against autologous B-LCL. No specific cytotoxicity above background was detected with freshly isolated PBMC effector cells (data not shown and Figure 5). No EBV-specific cytotoxicity was present in a preinfection sample (left) but was detectable in a 4-hour51Cr release assay 26 days after symptoms began in total PBMC (♦) and CD38+ PBMC (▴), but not in CD28+ PBMC (▪).
CD3ζ− CD8 T cells produce IFN-γ, but not IL-2, when activated
Production of IL-2 and IFN-γ were analyzed by flow cytometry of permeabilized cells. Representative samples from subjects AI-1 and AI-2 were studied at early and late time-points in the infections (AI-1, days 19 and 54; AI-2, days 11 and 100) and were compared with those from normal donors. Results from the early time-point from subject AI-1 were difficult to interpret because of the high degree of apoptosis in this sample after overnight culture either with or without activation in the presence of Brefeldin A. The other 3 samples had fewer than 15% apoptotic cells after culture by annexin V staining (data not shown). Moreover, the percentage of cells expressing CD3ζ, CD28, or CD57 in the 3 other cultures did not change after overnight culture irrespective of stimulation, suggesting that expression of these markers was not affected by overnight activation without exogenous IL-2.
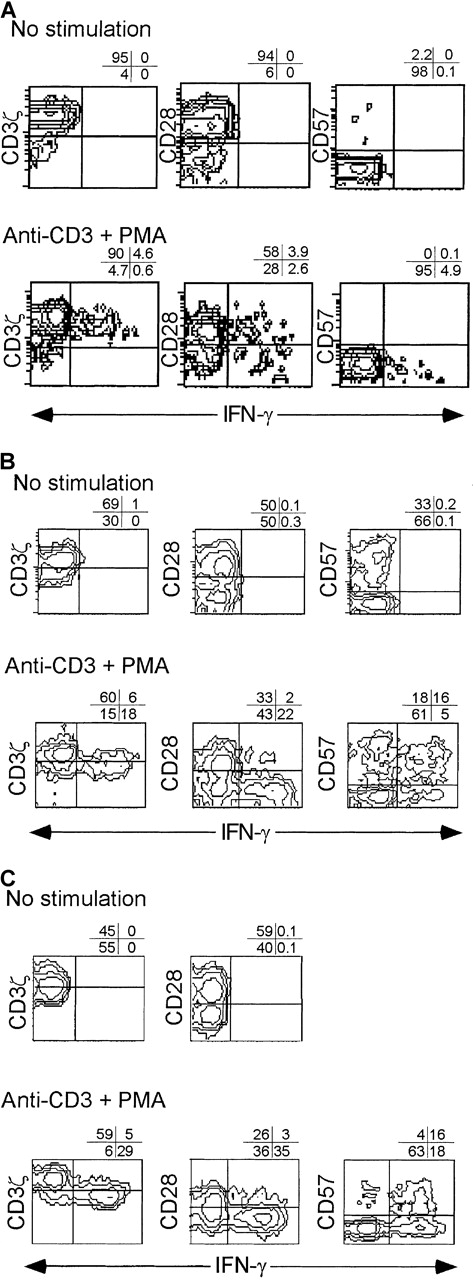
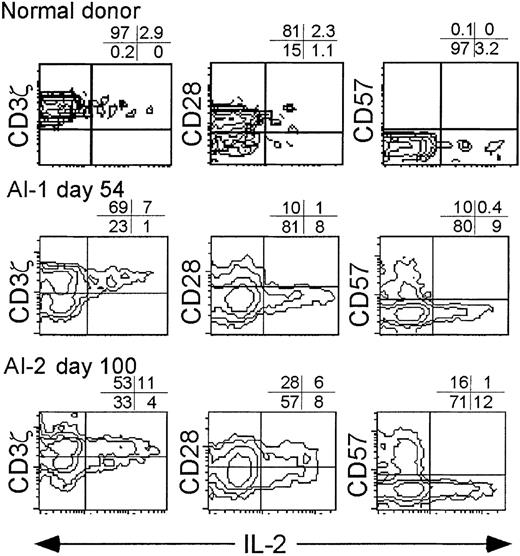
Without in vitro stimulation, there was no detectable cytokine production in any sample (Figure 7 and data not shown). In normal donors after stimulation with anti-CD3 and PMA in the presence of Brefeldin A, IL-2 and IFN-γ were produced exclusively by CD3ζ+ cells that were mostly CD28+. However, some CD28− cells also produced both cytokines.
IFN-γ is produced primarily by CD3ζ− CD28− CD8 T cells in subjects with recent viral infection.
PBMC from a normal donor (A) and from early (day 11) (B) and convalescent (day 100) (C) samples from subject AI-2 were activated with CD3/PMA or nothing, cultured in the presence of Brefeldin A overnight, and stained for CD8, phenotypic markers, and permeabilized and stained for IFN-γ. Unstimulated cells did not produce IFN-γ. Similar results were found with samples from subject AI-1 (data not shown). Contour plots were obtained from analysis of gated CD8-Cy5 bright lymphocytes.
Samples from early in the course of infection (AI-1, day 19 [data not shown]; AI-2, day 11) were cultured in the presence of Brefeldin A for 6 hours after CD3/CD28 or CD3/PMA stimulation. There was no production of IL-2 by CD8 T cells in either sample from the first few weeks of infection (data not shown). IFN-γ was produced almost exclusively by CD3ζ− CD28− CD8 T cells (Figure 7). IFN-γ producing cells were also more likely to be CD57+. There were fewer IFN-γ–producing cells after CD3/CD28 stimulation than after CD3/PMA stimulation. For example, in the day 11 sample from AI-2, 15% of CD8 T cells produced IFN-γ after CD3/CD28 and 22% produced it after CD3/PMA, an increase of 47%. However, the distribution of IFN-γ–producing cells in the phenotypic subsets of CD8 T cells, defined on the basis of CD3ζ, CD28, and CD57 expression, was unchanged (data not shown). In particular in the same sample, 30% of CD3ζ− T cells produced IFN-γ after CD3/CD28 stimulation and 46% produced it after CD3/PMA, an increase of 53%. Therefore, a low concentration of anti-CD3 and anti-CD28 induces IFN-γ production in CD3ζ–down-modulated CD8 T cells. This contrasts with activated expression of the high-affinity IL-2 receptor, which is impaired in CD3ζ− CD28− CD8 T cells.
Convalescence samples were analyzed after overnight stimulation with anti-CD3 and PMA (Figures 7, 8). Again, no cytokines were produced without specific stimulation (not shown). The IFN-γ producing cells were uniformly CD28− (more than 90%), generally CD3ζ− (71%-85%), and heterogeneous with respect to CD57 expression. The IL-2–producing CD8 T cells in convalescence samples were almost exclusively CD3ζ+ and CD57− and variable in CD28 expression. (Figure 8)
IL-2 is produced by CD3ζ+ CD57− CD8+ T cells.
Normal donor PBMC and convalescent samples from donors AI-1 (day 54) and AI-2 (day 100) were activated overnight with anti-CD3 and PMA in the presence of Brefeldin A before staining for intracellular IL-2. Each sample was analyzed for cytokine production by gated CD8+ lymphocytes. Cytokine production without T-cell activation was less than 1% in all samples (data not shown).
Discussion
CD8 T cells responding to acute infections down-modulated the cell surface expression of 2 key signaling molecules, CD3ζ and CD28, important in transducing signals for TCR engagement and costimulation.20-22 The CD3ζ− CD28− CD8 T cells are likely effector CTL because they stain for perforin and produce IFN-γ and because selection for CD28 expression abrogates EBV-specific cytotoxicity. In subject AI-1, the proportion and phenotype of CD3ζ− CD28− CD8 T cells coincides with that for tetramer-staining, EBV-specific CD8 T cells in infectious mononucleosis.23 This, together with their functional properties, suggests that the CD3ζ− CD28− CD8 T cells are the viral antigen-specific effector CTL. The properties of the CD3ζ down-modulated CD8 T cells, which we found expanded during acute viral infection in this study, are similar to what we have found in early stage chronic HIV infection.43 In chronically infected patients with HIV, HIV-specific CD8 T cells identified by tetramer staining are CD3ζ− and CD28−. The CD3ζ− T cells as a whole are also CD28− and express activated or memory cell markers. Similarly, after T-cell receptor engagement in HIV-seropositive donor samples, CD3ζ–down-modulated CD8 T cells express CD69, but not the high-affinity IL-2 receptor α chain, and produce IFN-γ, but not IL-2.
The identification of CD3ζ− CD28− T cells with antigen-specific CTL is consistent with previous studies that show CD28 is not required for antigen-specific cytotoxicity and, in fact, is not expressed on antigen-specific CD8 CTL.24-26 The persistence and frequency of antigen-specific CD8 T cells, recently appreciated in mouse and human infection models, is consistent with the prolonged persistence of CD3ζ− T cells in this study.27-29 In one mouse study,30 the frequency of viral-specific CD8 T cells to LCMV, vaccinia, or Pichinde virus declined by only 2- to 4-fold from their peak frequencies during the acute infection and remained at that level for 1 to 2 years, unless the mice became infected with heterologous viruses. In subjects AI-1 and AI-2, the elevated numbers of CD3ζ− CD8 T cells above preinfection baseline levels, which lasted months after the acute infection, suggests the probable persistence of a high frequency of antigen-specific CD8 T cells in humans as well.
These findings, together with similar results in cancer, chronic viral infection, and autoimmunity, suggest that down-modulation of these key signaling molecules may be part of the normal regulation of antigen-activated CD8 T cells and not an anomaly associated with chronic antigenic exposure or immune dysregulation. We also have obtained consistent results in a mouse model in which effector CD8 T cells, capable of antigen-specific cytotoxicity and IFN-γ secretion, generated after vaccinia infection or tumor injection down-modulate CD3ζ mRNA expression within the first week.11 However, our findings in this human study rest on analysis of only a few subjects and must be confirmed in a larger cohort.
What is the functional meaning of down-modulation of key signal-transducing molecules on effector CTL? The CD3ζ− CD28− CD8 T cells stain for perforin and granzyme A (not shown) and, therefore, are armed to kill. We hypothesize that CD3ζ down-modulation and CD28 down-modulation regulate antigen-specific CTL by increasing the triggering threshold for cytolysis but not for IFN-γ production. Two questions remain: how readily can CD3ζ− CD28− CTL be activated for cytolysis, and are they activated primarily by TCR engagement or do other surface receptors strengthen a weakened TCR signal? Although CD3ζ expression was undetectable above background staining, there may still be sufficient protein to transduce a signal. Estimates of the numbers of antigen–major histocompatibility complex pairs on target cells required to trigger cytolysis go down to one molecule per cell, well below the threshold for flow cytometry detection.31 After suboptimal T-cell activation with anti-CD3 and anti-CD28, the CD3ζlow or CD3ζ− CD8 T cells expressed less CD69 and did not express CD25. Raising the triggering threshold by down-modulating CD3ζ and CD28 may prevent lysis of uninfected cells that express weak affinity self-peptides, such as those recognized during positive selection. Because CD28 ligands are not expressed on most virally infected cells, CD28 ligation would not seem to be a desirable requirement to trigger cytolysis by CD8 T cells after their initial activation. The threshold for IFN-γ production, however, does not appear to be increased by CD3ζ and CD28 down-modulation because the proportion of IFN-γ–producing cells that are CD3ζ− is comparable after CD3/CD28 and CD3/PMA stimulation.
In HIV infection, we found that freshly isolated PBMC are generally not cytotoxic against HIV-presenting targets until after overnight culture.5 The in vitro emergence of specific cytotoxicity is IL-2–dependent because it is blocked by IL-2 antibodies and requires exogenous IL-2 in samples from more immunocompromised subjects. Moreover, it coincides with CD3ζ, but not CD28, re-expression. In the sample from the patient with AIM, we also found that freshly isolated cells are not cytotoxic against EBV-transformed targets. It is possible that some cytotoxicity is restored by culture in the absence of exogenous IL-2, probably secondary to endogenous IL-2 production, but substantially more emerges when IL-2 is added. CD3ζ re-expression in these acute infection samples is also dependent on exogenous IL-2. These results suggest a possible requirement for CD4 T-cell help to sustain CD8 cytolytic function. Our phenotypic studies suggest that IL-2 is produced principally by naive or unactivated CD3ζ+ CD8 T cells. IL-2 and IFN-γ are produced by reciprocal populations of CD8 T cells. Therefore, autocrine production of IL-2 is unlikely to provide the necessary stimulus to sustain cytotoxic activity.
The lack of stimulated production of IL-2 and the high-affinity IL-2 receptor by the CD8 T cells with down-modulated CD3ζ and CD28 may be the result of an absence of a costimulatory signal and suggest that the proliferative capacity of this subset is reduced.32,33 In the mouse acute infection model, in fact, recently activated CD8 T cells do not proliferate and undergo apoptosis unless IL-2 is added.11 Therefore, these activated CTL are exquisitely dependent on T-cell help for survival.
The down-modulation of CD3ζ on a large fraction of circulating CD8 T cells was detected in 2 of the 3 donors even before they realized they were sick. The duration and extent of expansion of CD3ζ− subsets also appeared in this small sample to correlate with the duration of symptoms. It was greatest and lasted longest in the patients with prolonged mononucleosis syndromes. The CD8 T cells with down-modulated CD3ζ also largely had down-modulated CD28, and most expressed the human activation marker HLA-DR, as well as perforin, CD38, and CD57. The sustained expansion of CD62L−CD38+HLA-DR+ CD8 T cells in acute infectious mononucleosis has been reported recently.34 In the patient with acute EBV infection studied in most detail, down-modulation of CD3ζ and CD28 developed in tandem, and at the peak of symptoms it comprised approximately 60% of the CD8 T cells. However, expression of these 2 markers is not completely linked because CD3ζ, but not CD28, is re-expressed on HIV-seropositive donor T cells after overnight exposure to IL-2.43 A higher proportion of CD8 T cells (approximately 95%) expressed HLA-DR and CD38 than had down-modulated CD3ζ. Either HLA-DR and CD38 may be up-regulated as well on bystander cells or CD28 and CD3ζ down-modulation may take longer to develop. It is perhaps surprising that more than 30% of the circulating CD8 T cells in subject AI-3 with a regional infection would be affected, but this finding may reflect the subject's constitutional symptoms.
The CD3ζ− CD28− CD8 T cells in these subjects with recent viral infections are partially anergic. On activation, they produce IFN-γ but do not up-regulate expression of the high-affinity IL-2 receptor and are not cytotoxic unless incubated with IL-2. We found similar properties for CD3ζ− CD28− CD 8 T cells in asymptomatic HIV-infected donors.5 However, in patients with more advanced HIV infection, most HIV-specific CD8 T cells do not produce IFN-γ after activation. Moreover, CD3ζ is not up-regulated after short-term culture in IL-2.43 This suggests a more profound anergy, similar to what has recently been reported in 2 patients with metastatic melanoma using tetramer staining of CD8 T cells that recognize a tumor-associated antigen.35 The molecular basis for either the partial anergy of CD8 T cells responding to recent or well-controlled infections or the more profound CD8 T-cell anergy associated with states of uncontrolled antigenemia, as would be found in patients with advanced AIDS or patients with metastatic cancer, must be better understood.
If CD3ζ and CD28 are down-modulated during primary CD8 T-cell stimulation, is their cell surface expression reduced in long-term memory T cells? Because EBV is a chronic infection, it is unclear whether the large proportion of CD3ζ− CD28− CD8 T cells present 7 months later in the peripheral blood of donor AI-1 are memory cells or cells reactivated by persistent EBV infection. Little is known of the phenotypic properties of memory CD8 T cells, though they have an accelerated response to produce cytokines and proliferate to antigen.25,36-39 Recent studies have suggested that previously activated “memory” CD8 T cells can be divided into 2 effector populations that traffic to the tissues (terminally differentiated perforin+ effector CTL, which are CD45RA+CD62L−CCR7− or CD45RA−CD62L−CCR7−) and a resting memory population that preferentially traffics to the secondary lymphoid compartment (CD45RA−, CD62L−, CCR7+, perforin−).25,40 We hypothesize that the perforin+ CD3ζ− CD28− CD8 T cells that we have characterized belong to the effector memory populations, but how they distribute between the 2 effector subsets and what the functional properties of the 2 subsets are is unknown. Both CCR7– effector CD8 subsets, like the CD3ζ− CD28− CD8 T cells in this study, are said to be perforin+ and produce IFN-γ but not IL-2.40 An intriguing possibility, which requires further study, is that the CD45RA+ cells are functional CTL, whereas the CD45RA− cells are partially anergized cells. It is likely that CD3ζ is re-expressed in resting central memory CD8 T cells. One small piece of supporting evidence presented here is that in normal donors, the IFN-γ secreting cells, which should include effector and central memory CD8 T cells, are uniformly CD3ζ+ (Figure 7A). However, the properties of the rare central memory cells are difficult to discern in humans. Tetramer staining41 or recently developed mouse models for tracking memory cells11 42 may help answer this question.
Acknowledgments
We thank Fred Wang for EBV and CMV serologies, Mark Patterson for expert technical help, and Premlata Shankar and N. Manjunath for helpful discussions.
Supported by National Institutes of Health grants 42519 and 45406 from the National Institute of Allergy and Infectious Diseases (J. L.).
Reprints:Judy Lieberman, The Center for Blood Research, 800 Huntington Avenue, Boston MA 02115; e-mail:lieberman@cbr.med.harvard.edu.
The publication costs of this article were defrayed in part by page charge payment. Therefore, and solely to indicate this fact, this article is hereby marked “advertisement” in accordance with 18 U.S.C. section 1734.

This feature is available to Subscribers Only
Sign In or Create an Account Close Modal