Abstract
Epithelial tissues of various organs contain immature Langerhans cell (LC)-type dendritic cells, which play key roles in immunity. LCs reside for long time periods at an immature stage in epithelia before migrating to T-cell–rich areas of regional lymph nodes to become mature interdigitating dendritic cells (DCs). LCs express the epithelial adhesion molecule E-cadherin and undergo homophilic E-cadherin adhesion with surrounding epithelial cells. Using a defined serum-free differentiation model of human CD34+hematopoietic progenitor cells, it was demonstrated that LCs generated in vitro in the presence of transforming growth factor β1 (TGF-β1) express high levels of E-cadherin and form large homotypic cell clusters. Homotypic LC clustering can be inhibited by the addition of anti–E- cadherin monoclonal antibodies (mAbs). Loss of E-cadherin adhesion of LCs by mechanical cluster disaggregation correlates with the rapid up-regulation of CD86, neo-expression of CD83, and diminished CD1a cell surface expression by LCs—specific phenotypic features of mature DCs. Antibody ligation of E-cadherin on the surfaces of immature LCs after mechanical cluster disruption strongly reduces the percentages of mature DCs. The addition of mAbs to the adhesion molecules LFA-1 or CD31 to parallel cultures similarly inhibits homotypic LC cluster formation, but, in contrast to anti–E-cadherin, these mAbs fail to inhibit DC maturation. Thus, E-cadherin engagement on immature LCs specifically inhibits the acquisition of mature DC features. E-cadherin–mediated LC maturation suppression may represent a constitutive active epithelial mechanism that prevents the uncontrolled maturation of immature LCs.
Introduction
Dendritic cells (DCs) represent a developmentally heterogeneous class of leukocytes that are highly specialized in antigen uptake, processing, and presentation. DCs differ in migration pathways, tissue location, and functional abilities. Mature DCs in T-cell areas of lymph nodes are known as interdigitating DCs and are in part derived from a peripheral DC migration pathway that involves immature DCs in peripheral organs such as epithelial Langerhans cells (LCs).1-3 After homing to T-cell areas of secondary lymphoid organs, DCs rapidly undergo apoptosis unless they receive a survival signal from antigen-specific T cells.4
Immature epidermal LCs fulfill a sentinel role by filtering the surrounding tissue for foreign antigens and pathogens. They form a 3-dimensional network in suprabasal epidermal layers and spend long time periods at an immature or a nonactivated differentiation stage in the epidermis before they migrate to the lymph nodes.5 LCs express high levels of the homophilic adhesion molecule E-cadherin and undergo E-cadherin–dependent adhesion with epidermal keratinocytes.6 E-cadherin expression is markedly down-regulated upon the migration and maturation of epidermal LCs, and lower expression levels of E-cadherin on the surfaces of cultured LCs correlate with decreased cell adhesiveness.6-8 LC migration can be induced in vivo by the topical application of allergens or the intradermal or systemic injection of tumor necrosis factor-α (TNFα), interleukin-1, or lipopolysaccharide (LPS) (reviewed in Austyn9). Migration of LCs involves the adhesion of LCs to the epidermal basement membrane by α6 integrin,10 and it can be inhibited by monoclonal antibodies (mAbs) to CD44-variant isoforms.11 Passage of migrated DCs from lymphatic vessels into T-cell areas of draining lymph nodes at least partially requires chemokine SLC interaction with the mature DC-associated receptor CCR7.12 13
LC migration from the epidermis to the draining lymph nodes is preceded by the activation and maturation of immature LCs locally in the epidermis. Because immature epidermal LCs spontaneously undergo maturation on in vitro culture,14 inhibitory signals that are provided by the epidermal microenvironment might likely counteract the maturation of LCs in vivo.
We recently established defined serum-free culture conditions for the in vitro generation of immature LCs from human CD34+ cord blood progenitor cells. We demonstrated that LC differentiation from CD34+ cells is dependent on the addition of transforming growth factor β1 (TGF-β1) to defined serum-free cultures supplemented with granulocyte macrophage–colony-stimulating factor (GM-CSF) plus TNFα and stem cell factor (SCF).15TGF-β1 induces LC growth from shared clonogenic precursor cells with myelomonocytic cells, and this effect on LC growth is strongly enhanced by a synergistic activity of SCF plus flt3 ligand (FL).16LCs selectively accumulate in this differentiation model at an immature stage resembling epidermal LCs in vivo (CD86dim/−, CD83−, Birbeck granule++, Lag++, CD1a++, E-cadherin++).
The availability of a differentiation model that allows the maintenance of LCs in vitro in defined serum-free cultures at an immature stage provided the opportunity to study signaling mechanisms leading to the maturation of immature LCs. Our data suggest that functional activation of the TGF-β1–induced cell surface molecule E-cadherin actively suppresses the maturation of LCs in this differentiation model.
Materials and methods
Antibodies
Murine monoclonal antibodies of the following specificities were used in flow cytometry analyses. CD34 (clone HPCA2) and CD11c (clone S-HCL-3) were obtained from Becton Dickinson Immunocytometry Systems (San Jose, CA). CD83 (clone HB15a) was obtained from Immunotech (Marseilles, France). CD86 (clone IT2.2) was obtained from PharMingen (San Diego, CA). Lag antibody (clone Lag), specific for a 40-kd glycoprotein associated with Birbeck granules,17was kindly provided by Drs Imamura and Yoneda (Kyoto, Japan). CD1a (clone VIT6b) and a control mAb (clone VIAP, IgG1) were produced in our laboratory. Antibodies used in functional analyses are listed in Table2. Monoclonal antibody preparations showing functional effects were controlled for endotoxin (LPS) and were found to contain less than 0.1 ng/mL endotoxin, with the exception of the commercially obtained mAb HEC/75 (CD31), which contained low amounts (3.5 ng/mL) LPS. It is, however, highly unlikely that the observed functional effects of CD31 mAb resulted from LPS contamination because we performed all the experiments in serum-free medium that did not contain significant amounts of LPS-binding protein and soluble CD14. Furthermore, we detected similar amounts of LPS in 2 additional mAb preparations that did not show functional effects on DC maturation when added to parallel cultures (clones 4B4, CD29 and HP2.1, CD49d).
Immunofluorescence staining procedures
For membrane staining, 50 μL cells (107/mL) were incubated for 15 minutes at 0°C to 4°C with 20 μL conjugated mAb. Cells were washed and analyzed by flow cytometry or submitted for intracellular staining.
For suspension staining of intracellular antigens, we used the commercially available reagent combination Fix&Perm (An der Grub, Kaumberg, Austria) according to the manufacturer's procedure. Briefly, cells were first fixed for 15 minutes at room temperature (50 μL cells plus 100 μL formaldehyde-based fixation medium). After one washing with phosphate-buffered saline, pH 7.2, cells were resuspended in 50 μL phosphate-buffered saline and mixed with 100 μL permeabilization medium plus 20 μL fluorochrome-labeled antibody. After further incubation for 15 minutes at room temperature, cells were washed again and analyzed by flow cytometry. Indirect suspension staining for the intracellular Birbeck granule marker molecule Lag was performed as described previously.15
Flow cytometry and cell sorting
Flow cytometric analyses were performed using a FACScan flow cytometer (Becton Dickinson Immunocytometry Systems) equipped with a single laser emitting at 488 nm. Cell sorting was performed using a FACS Vantage flow cytometer (Becton Dickinson). The purity of the CD1a+ cell fractions obtained by sorting was determined by re-analysis and was found to exceed 95%.
Cord blood cells
Cord blood (CB) samples were collected during healthy full-term deliveries. Mononuclear cells were isolated within 10 hours of collection by discontinuous Ficoll/Hypaque (Pharmacia, Uppsala, Sweden) density gradient centrifugation. CD34+ cells were isolated from CB mononuclear cells using the MACS CD34 Progenitor Cell Isolation Kit (Miltenyi Biotec, Bergisch Gladbach, Germany) as described previously,15 according to the instructions of the manufacturer. The purity of the CD34+ population exceeded 90%.
Primary cultures of CD34+ CB cells
Primary (1°) cultures of purified CD34+ CB cells were grown in 24-well plates (Costar, Cambridge, MA) (5 × 10³ cells in 1 mL/well) at 37°C in a humidified atmosphere and in the presence of 5% CO2, as previously described by us.16 The serum-free medium X-VIVO 15 (BioWhittaker, Walkersville, MD) contained L-glutamine (2.5 mmol/L), penicillin (125 U/mL), and streptomycin (125 μg/mL). Cultures were supplemented with optimized concentrations of the following human cytokines: FL (100 ng/mL; kindly provided by Immunex, Seattle, WA), TGF-β1 (0.5 ng/mL; purified from platelets; British Biotechnology, Abington, UK), rhTNFα (50 U/mL; Bender, Vienna, Austria), rhGM-CSF (100 ng/mL; Novartis, Basel, Switzerland), and rhSCF (20 ng/mL; Amgen, Thousand Oaks, CA). A 50% medium exchange was regularly performed at culture day 7.
Secondary cultures of in vitro–generated immature LC
Secondary (2°) culture experiments were set up using cells generated in 1° LC generation cultures as described above. Cells from 1° cultures were harvested at days 10 to 14. Single-cell suspensions were prepared by pipetting, and resuspended cells were plated in the above-described growth medium X-VIVO 15 in 24-well plates at a cell density of 1 × 10⁵ cells per well (1 mL). Cultures were supplemented with GM-CSF, TNFα, or TGF-β1, or any combination of them, at concentrations described above. CD40 ligand trimer (CD40L; 200 ng/mL; kindly provided by Immunex) was added when indicated.
Aggregation cultures of LC in the presence of antibodies
Cells from 1° cultures (see above) were harvested, carefully resuspended by pipetting, and submitted to 2° cultures (ie, aggregation cultures) of 5 × 10⁴ cells/well in flat-bottomed 96-well plates (Costar) under exactly the same growth conditions as for 1° cultures. These reaggregation cultures were supplemented with 20 μg/mL mAb when indicated, preincubated with mAb for 20 minutes at 4°C, and transferred to 37°C. After additional culture for 24 hours, cell cluster formation was analyzed by phase-contrast microscopy using a scoring system previously established in our laboratory18 with slight modifications. Scores ranged from 0 to 4, as follows: 0, less than 10% of the cells were in aggregates; 1, 10% to 50% of the cells were in aggregates; 2, approximately 50% to 75% of the cells were in aggregates; 3, 75% to 90% of the cells were in aggregates; 4, 90% to 100% of the cells were in aggregates. In the first series of experiments, these cultures were initiated with total cells generated in primary cultures at day 8. To further study direct homotypic LC-to-LC interaction, we initiated identical cultures (see above) with flow sorted CD1a+ cells generated after 10 to 12 days in 1° cultures. To assess the differentiation stage of LC, cells from these reaggregation cultures were stained for CD1a or were double-stained for CD1a versus CD86 or CD83 expression and analyzed by flow cytometry as indicated in “Results.”
Mixed leukocyte reaction
Graded numbers of irradiated (30 Gy; cesium Cs 137 source) stimulator cells (generated LC) were added to constant numbers (5 × 10⁴/well) of purified (greater than 98%) allogeneic T cells in round-bottom 96-well tissue culture plates (Costar). Triplicate analyses were performed. Stimulation of responding T cells was monitored by measuring 3H-thymidine (Amersham Life Science, Buckingham, UK) incorporation on day 5 of culture. Incorporated radioactivity was measured using a Top-Count microscintillation counter (Packard Instrument, Meriden, CT). Allogeneic T cells used in these experiments were purified from peripheral blood mononuclear cells by negative immunomagnetic depletion (MACS beads; Miltenyi Biotec) using mAbs specific for CD14 (clone VIM13; generated in our laboratory), CD16 (clone 3G8; Caltag), CD19 (clone HD37; kindly provided by Dr G. Moldenhauer, Heidelberg, Germany), HLA-DR (clone L243; ATCC, Rockville, MD), and CD33 (4D3; generated in our laboratory) as previously described by us.16
Results
TGF-β1–induced LC generation is associated with maturation arrest of generated LC at an immature, epidermal LC-like differentiation stage
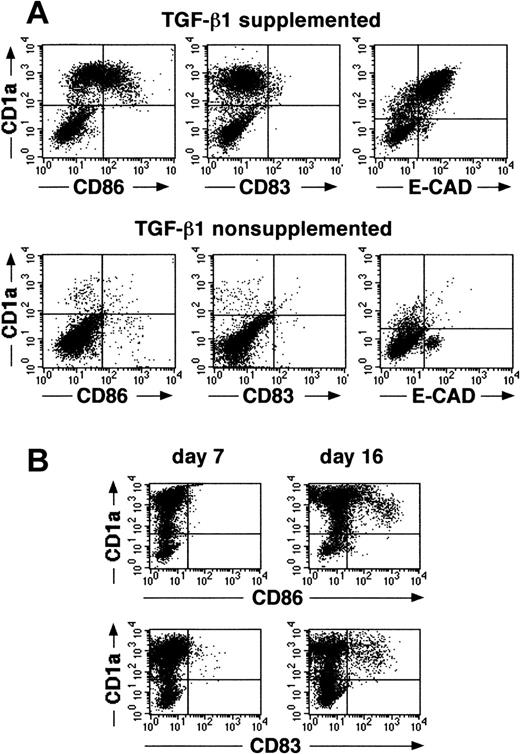
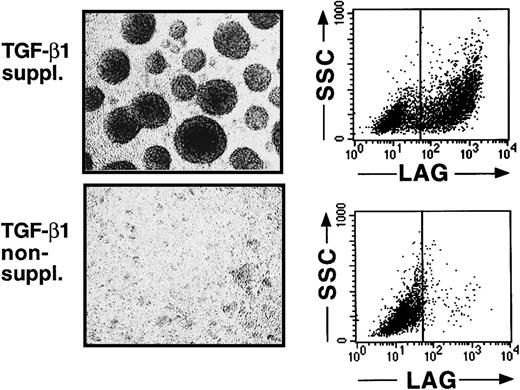
We recently described that the addition of TGF-β1 to serum-free cultures of CD34+ cells, supplemented with the cytokines GM-CSF plus TNFα, SCF, and FL, results in the generation, after a culture period of 7 to 10 days, of a large cell fraction that strongly expresses CD1a (approximately 60%).16 Indistinguishable from epidermal LC in vivo, most CD1a+ cells generated in these cultures are predominantly CD86 (B7.2)dim/− and lack expression of the mature DC marker molecule CD83.16 This immature DC phenotype of most of the generated cells remains preserved on extension of the culture period to 14 to 16 days (Figure1A,B). Furthermore, most CD1a+ cells generated in these TGF-β1–supplemented cultures express high levels of the homophilic epithelial adhesion molecule E-cadherin (Figure 1A, upper right diagram), and a large proportion of cells expresses the Birbeck granule–associated molecule Lag (Figure 2, upper panel; mean, 52% at day 14 to 16; n = 7). Cells generated in identical culture medium in the absence of TGF-β1 lack expression of Lag (Figure 2, lower panel), and most of these cells remains CD1a−/E-cadherin− (Figure 1A).
Cells generated in the presence of TGF-β1 show specific features of immature epidermal LCs.
(A) Purified CD34+ cells were cultured for 14 days in defined serum-free medium supplemented with the cytokines GM-CSF plus TNFα, SCF, and FL in the presence or absence of TGF-β1. Day 14–generated cells were harvested and analyzed for the expression of informative molecules. Diagrams show the correlated expression of CD1a versus CD86, CD83, or E-cadherin, respectively, by generated cells in the presence or absence of TGF-β1. (B) Time kinetics analysis of cells generated in cultures of CD34+ cells supplemented with the cytokines TGF-β1 plus GM-CSF, TNFα, SCF, and FL. Diagrams show combined staining of parallel cultures harvested at day 7 or 16 for CD1a versus CD86 or CD83 expression, respectively. Markers were set according to negative control staining.
Cells generated in the presence of TGF-β1 form large cell clusters and express the Birbeck granule antigen Lag.
Purified CD34+ cells were cultured for 12 to 14 days in serum-free medium supplemented with the cytokines GM-CSF plus TNFα, SCF, and FL in the presence or absence of TGF-β1. Day 12–generated cells were harvested and analyzed by phase-contrast microscopy (original magnification, ×20) and flow cytometry. Diagrams show expression of the intracellular Birbeck granule–associated molecule Lag versus orthogonal light scatter (SSC) of cells generated in the presence or absence of TGF-β1, as indicated. Markers were set according to negative control staining.
The most striking morphologic feature of TGF-β1–supplemented cultures is the occurrence of large cell clusters from culture day 7 on (Figure 2, upper panel). In comparison, little or no cell clustering occurs in TGF-β1–nonsupplemented cultures (Figure 2, lower panel). TGF-β1–dependent LC generation and cell cluster formation are accompanied by dramatic cell multiplication. At day 0, 5 × 10³ CD34+ cells/mL plated in 24-well plates give rise to 2.1 × 10⁵ to 5.4 × 10⁵ (mean, 3.5 × 10⁵; n = 7) cells after day 12. Thus, cells generated in these cultures in response to TGF-β1 stimulation resemble immature LCs. They fail to undergo further DC maturation despite the presence of TNFα in culture, which has been previously demonstrated to induce maturation (CD86bright, CD83+) of in vitro–generated immature DCs in cultures of CD34+ hematopoietic progenitor cells.19-25 We investigated whether this LC maturation arrest was caused by a lack of stimulatory factors not present in our defined serum-free cultures or by an inhibitory effect of TGF-β1.
LCs acquire mature DC features when resuspended and plated in defined serum-free secondary (2°) cultures
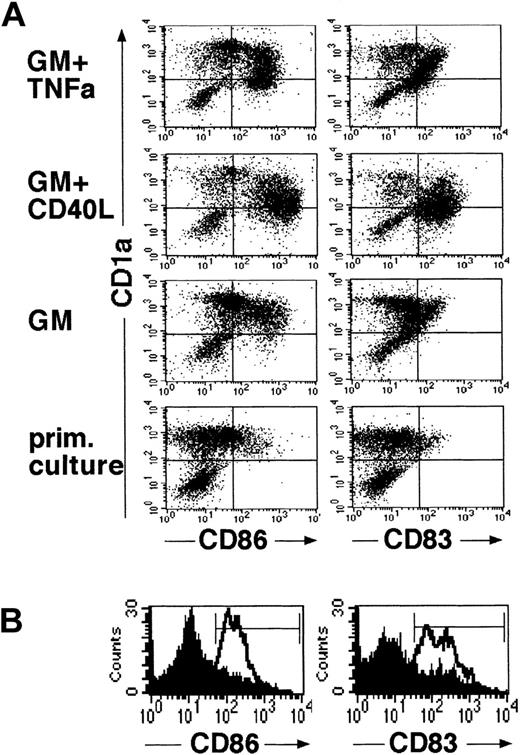
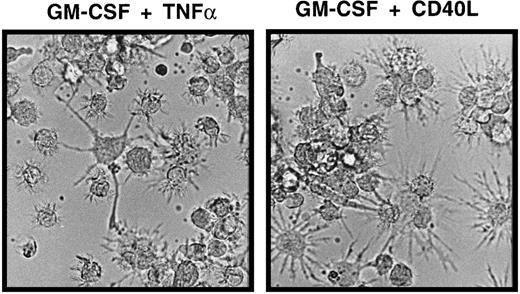
LCs generated in the above-described primary cultures of CD34+ cells for 10 to 14 days were harvested, resuspended to obtain single-cell suspensions, and plated in 2° serum-free cultures. Stimulation of LC in these 2° cultures in the presence of GM-CSF plus TNFα for 48 hours resulted in the acquisition of mature DC features by most generated CD1a+ cells. As shown in Figure 3, panel A (top diagrams), most immature CD1abright cells from primary (1°) cultures acquired increased expression of CD86 and were found to express the mature DC marker molecule CD83 on stimulation with GM-CSF plus TNFα. These phenotypic changes were correlated with a marked reduction of mean CD1a expression density of cultured cells (Figure 3A). Morphologic examination of GM-CSF plus TNFα-supplemented 2° cultures revealed numerous loosely plastic adherent and floating single cells with highly dendritic processes (Figure 4). GM-CSF plus CD40L-supplemented parallel cultures showed a similar maturation pattern, though these cells were found to be consistently brighter CD86+ and CD83+ than those cultured in GM-CSF plus TNFα, and they showed a more mature DC morphology (Figures 3A,4). Interestingly, even in the presence of GM-CSF alone (Figure 3A, third panel), 2° cultures contained higher percentages of CD86+ cells than 1° control cultures in which cell clusters remained undisturbed (Figure 3A, bottom). Parallel staining of cultured cells for additional marker molecules revealed a marked up-regulation of cell surface expression of HLA-DR, CD80, and CD54 molecules in parallel with the above-described DC maturation-linked phenotypic changes (CD83 induction, CD86 up-regulation, and decreased CD1a expression). Conversely, most CD1a+ cells expressed CD11c, and CD11c expression levels did not clearly change in 2° cultures (data not shown).
Generated LCs acquire mature DC features in defined serum-free 2° cultures.
Cells were generated in serum-free medium in the presence of TGF-β1, as shown in Figure 1. They were resuspended and plated in serum-free 2° cultures and further stimulated in the presence of cytokines (see “Materials and methods”). As shown in (A), 2° cultures were supplemented with either GM-CSF (GM) plus TNFα, GM-CSF plus CD40L, or GM-CSF alone. Control cultures represent primary cultures in which cell clusters were left undisturbed and which were maintained over the 48-hour secondary culture period. Diagrams show representative flow cytometric analyses of cells from these 2° cultures or from primary control cultures for the expression of CD86 or CD83 versus CD1a (see “Materials and methods”). (B) Representative CD86 or CD83 expression profiles of cells after resuspension and further stimulation in 2° cultures supplemented with fresh medium containing the cytokines TGF-β1 plus GM-CSF, TNFα, SCF, and FL (lines). Overlay diagrams (filled) show parallel cultures set up in identical fresh cytokine-supplemented growth medium without resuspension (ie, representing undisturbed cell clusters). Markers were set according to negative control cultures.
Morphologic features of mature DCs in serum-free 2° cultures.
Cells were generated in serum-free medium in the presence of TGF-β1, as shown in Figure 1. They were resuspended and plated in serum-free 2° cultures (see “Materials and methods”) supplemented with GM-CSF plus TNFα or GM-CSF plus CD40L and cultured for 48 hours. The typical microscopic appearance of cells from these 2° cultures in the presence of GM-CSF plus TNFα or GM-CSF plus CD40L is shown (original magnification, ×40).
Figure 3, panel B shows a phenotypic analysis of cells stimulated in the presence of fresh medium supplemented with the initial cytokine combination (TGF-β1 plus GM-CSF, TNFα, SCF, and FL). As can be seen, cells that were resuspended acquired mature DC characteristics (Figure 3B, open histograms), whereas cells that remained as cell clusters (Figure 3B, filled histograms) stayed predominantly CD86dim/− and CD83dim/−.
These experiments demonstrate that cytokines present in 1° cultures (ie, GM-CSF plus TNFα) sufficiently promote the maturation of LCs. Thus, the maturation arrest of immature LC in 1° cultures cannot be explained by a lack of DC maturation stimuli.
TGF-β1 supplementation does not inhibit LC maturation in 2° cultures
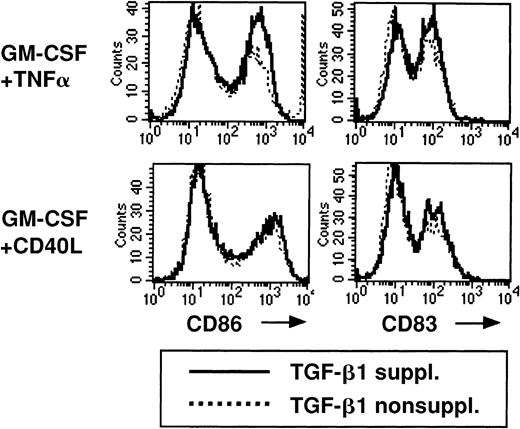
LCs generated in primary TGF-β1–supplemented cultures remain immature (Figure 3A, bottom). Because TGF-β1 is mainly described as a suppressive cytokine that inhibits immune responses, we next asked whether TGF-β1 might suppress the maturation of LC. To study this possibility, we added TGF-β1 to the 2° cultures supplemented with either GM-CSF plus TNFα or GM-CSF plus CD40L and phenotypically characterized cultured cells. We observed similar CD86 and CD83 expression patterns by cultured cells in the presence or absence of TGF-β1 (Figure 5), demonstrating that TGF-β1 does not inhibit LC maturation in 2° cultures.
Addition of TGF-β1 to serum-free 2° cultures does not inhibit the up-regulation of CD86 or CD83 expression.
Cells were generated and replated in 2° cultures as described in Figure 2, and 2° cultures were supplemented with GM-CSF plus TNFα or GM-CSF plus CD40L. The effect of the addition of TGF-β1 to these 2° cultures on the expression of CD86 or CD83 by cultured cells is shown. Representative histograms show CD86 or CD83 expression of cells stimulated in 2° cultures in the presence or absence of TGF-β1, as indicated.
Replating immature LC in 2° cultures at a high cell density induces rapid LC re-aggregation
The experiments described above revealed that the observed LC maturation arrest in 1° cultures cannot be explained by a lack of maturation-inducing cytokines or by a direct maturation suppressive effect of TGF-β1. Therefore, we investigated an alternative possibility and analyzed whether LC clustering may provide a suppressive signal that prevents the maturation of LC in this differentiation model.
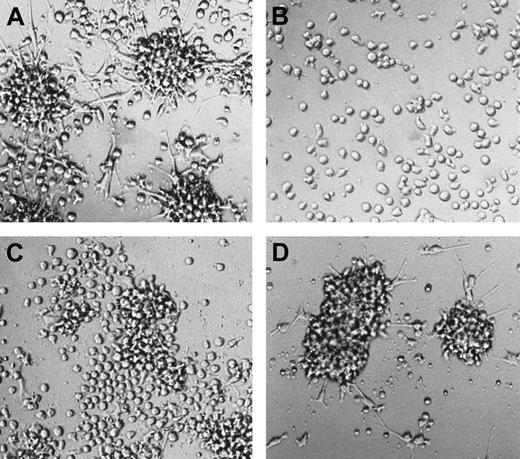
We observed that the mechanical disruption of LC clusters and replating of generated cells to short-term, serum-free 2° cultures at a high cell density (5 × 10⁴ cells in flat-bottom, 96-well plates; see “Materials and methods”), supplemented with identical cytokines as described for 1° cultures (see above), resulted in secondary cell cluster formation. This permitted us to analyze LC clustering in more detail. As can be seen from Figure6, single-cell suspension of LCs (Figure6B) prepared by the enforced pipetting of clustered cells from 1° cultures gave rise within 24 hours of additional culture in identical growth medium (cytokines GM-CSF plus TNFα, SCF, FL, and TGF-β1) to secondary cell cluster formation (Figure 6A). These cell clusters are smaller than those observed in 1° LC generation cultures (compare Figure 6A with Figure 2, upper panel). We applied a scoring system (1 = lowest, 4 = highest, degree of aggregation; see “Materials and methods”) to quantify secondary cell cluster formation in these 2° cultures. Spontaneous LC re-aggregation, shown in Figure 6, panel A, scored 3 (75%-90% of cells are present in aggregates; see “Materials and methods”). This rapid secondary LC clustering phenomenon was found to be calcium and temperature dependent because it could be completely prevented by the addition of EDTA or by incubating cells at 4°C (score 0; data not shown).
Representative cell morphology in the presence of mAbs to adhesion molecules.
Generated cells from primary LC generation cultures were harvested and replated at a high cell density in 2° cultures supplemented with the cytokines GM-CSF plus TNFα, SCF, FL, and TGF-β1 in the presence or absence of mAbs specific for adhesion molecules. Photomicrographs show representative cell morphology (original magnification, ×20) of these 2° cultures before (B) or after (A, C, D) culture for 24 hours. Monoclonal antibodies of the following specificities were added: A, control; C, E-cadherin; D, CD43 (see also “Materials and methods”).
Involvement of cytoadhesion molecules in LC cluster formation in 2° cultures
Double staining revealed that most generated CD1a+cells in primary cultures express the homophilic adhesion molecule E-cadherin (Figure 1). We analyzed cells generated under the various culture conditions for E-cadherin expression. As can be seen in Table1, expression of E-cadherin slightly decreases on subculturing of day 10 generated cells in 2° cultures supplemented with GM-CSF, GM-CSF plus TNFα, or GM-CSF plus CD40L. Conversely, expression intensity of E-cadherin even increases in parallel 2° cultures containing the initial TGF-β1–supplemented cytokine combination.
E-cadherin surface expression by cultured cells
| E-cad+ (MFI)* . | Experiment 1 . | Experiment 2 . |
|---|---|---|
| 1° culture day 10† | ||
| GM/SCF/FL/TNFα/TGF-β1 | 40.4 (31.3) | 41.5 (28.3) |
| 1° culture day 12† | ||
| GM/SCF/FL/TNFα/TGF-β1 | 41.0 (21.6) | 46.1 (20.7) |
| 2° culture‡ | ||
| GM-CSF | 32.9 (20.3) | 35.5 (23.8) |
| 2° culture | ||
| GM + TNFα | 31.3 (18.7) | 41.6 (21.8) |
| 2° culture | ||
| GM + CD40L | 33.1 (19.3) | 32.5 (21.2) |
| 2° culture | ||
| GM/SCF/FL/TNFα/TGF-β1 | 50.3 (24.7) | 49.3 (21.0) |
E-cad indicates E-cadherin; MFI, mean fluorescence intensity; GM, granulocyte macrophage; SCF, stem cell factor; FL, flt3 ligand; TNFα, tumor necrosis factor-α; TGF-β1, transforming growth factor β1; CSF, colony-stimulating factor.
Mean fluorescence intensity of gated E-cadherin+ cells evaluated by fluorescence-activated cell sorter (FACS).
LCs generated in primary (1°) cultures of CD34+ cells in the presence of the indicated cytokines.
LCs harvested on day 10 and subcultured for 48 hours in secondary (2°) cultures in the presence of cytokines, as indicated.
We further analyzed cells generated in 1° cultures for the expression of additional cytoadhesion molecules. As can be seen in Table2, substantial proportions of generated CD1a+ LC express the β1 integrin molecules VLA-4 (CD49d/CD29) and VLA-5 (CD49e/CD29), the β2 integrin LFA-1 (CD11a/CD18), and sialophorin (CD43). Additionally, a subset of generated cells expresses PECAM-1 (CD31) (Table 2).
Expression of cytoadhesion molecules by CD1a+LCs
| Clone . | Target . | % Reactivity* . | Source . |
|---|---|---|---|
| HECD-1 | E-cadherin | ++++ | Zymed (San Francisco, CA) |
| 5E6 | CD11a | +++ | Our laboratory |
| 2LPM19C | CD11b | + | DAKO A/S (Glostrup, Denmark) |
| TS1/18 | CD18 | +++ | ATCC (Rockville, MD) |
| 4B4 | CD29 | +++ | Coulter (Hialeah, FL) |
| HP2.1 | CD49d | ++++ | Immunotech (Marseille, France) |
| SAM1 | CD49e | +++ | Immunotech |
| HEC/75 | CD31 | ++ | CLB (Amsterdam, Netherlands) |
| 6F5 | CD43 | +++ | Our laboratory |
Percentage of gated CD1a+ cells coexpressing the indicated adhesion molecules. + indicates ≤ 25%; ++, 25% to 50%; +++, 50% to 75%; ++++, 75% to 100%.
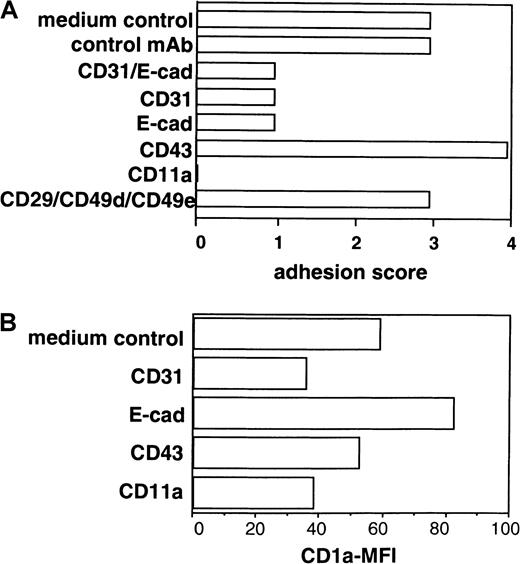
The short-term re-aggregation characteristics of generated LC at a high-cell density allowed us to study whether the addition of blocking mAbs to candidate cytoadhesion molecules might influence secondary LC cluster formation. For quantification of secondary LC cluster formation in these 2° cultures, we applied the scoring system (see “Materials and methods”). Additionally, we analyzed cells after stimulation in these 2° cultures for expression of CD1a (immature LC, CD1abright; mature LC, marked loss of CD1a expression density; see Figure 3). As can be seen from Figure 6, panel C and Figure 7, panel A, the addition of an mAb to E-cadherin in these 2° cultures led to the inhibition of cell cluster formation (score 1), and this effect was associated with increased CD1a expression by stimulated cells compared to control cultures (Figure 7B). Monoclonal antibodies to CD11a or CD31 also strongly inhibited secondary cell cluster formation (score 0 or 1, respectively; Figure 7A), but this effect was associated with a decrease of mean CD1a expression levels (Figure 7B) of cultured cells in 2° cultures. Conversely, mAb ligation of CD43 led to the enhancement of cell clustering (Figures 6D, 7A; score 4 versus 3), and mean CD1a expression by cultured cells decreased only slightly (Figure7B).
Secondary LC cluster formation and CD1a expression by cells cultured in 2° cultures in the presence of a panel of mAbs to adhesion molecules.
Purified CD34+ cells were cultured in the presence of GM-CSF plus TNFα, SCF, FL, and TGF-β1 in serum-free medium (see “Materials and methods”). Day 8–generated cells were replated in 2° cultures at a high cell density (see “Materials and methods”). After a 2° culture period of 24 hours, cells were harvested and analyzed by phase-contrast microscopy and FACS. The effect of mAb addition on cell cluster formation and CD1a expression density of cultured cells is analyzed (see “Materials and methods”). (A) Bars represent cell cluster formation in one representative experiment (n = 5) quantified using the following scoring system (percentage of cells in aggregates): 0, less than 10%; 1, 10% to 50%; 2, 50% to 75%; 3, 75% to 90%; 4, more than 90%. (B) CD1a mean fluorescence intensity (MFI) of cells after culture in the presence or absence of mAbs.
Ligation of E-cadherin on immature LC inhibits acquisition of mature DC phenotype
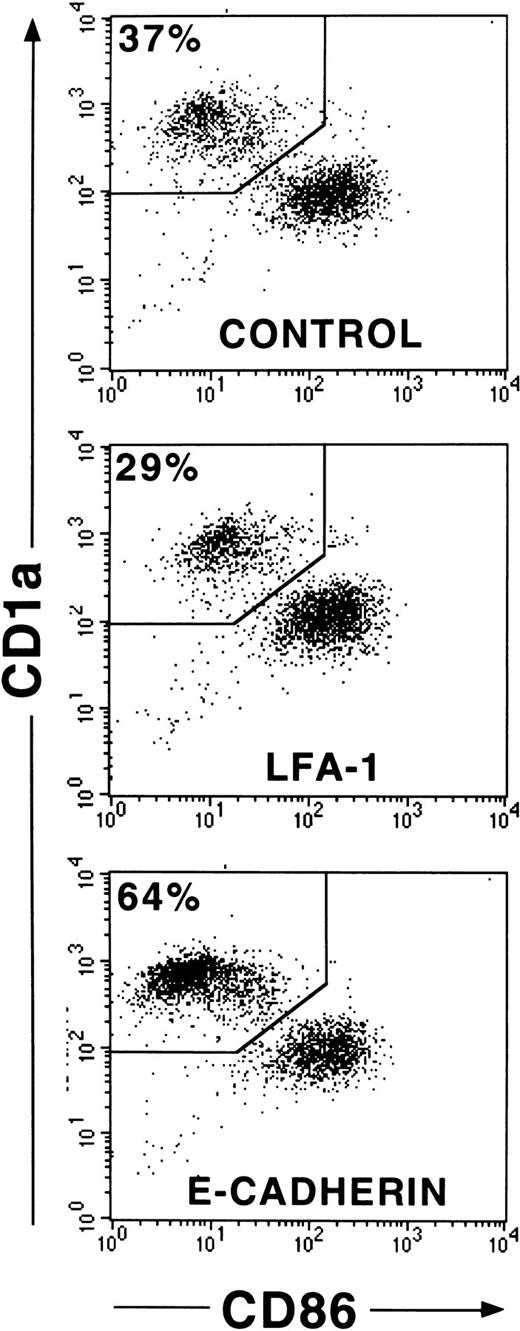
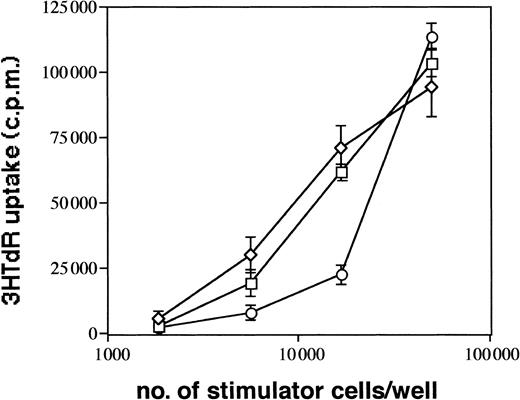
CD1a+ LC generated in 1° cultures make up approximately 60% of all cultured cells. To eliminate a possible influence of contaminating CD1a− cells on cell clustering and maturation induction of LC, we performed cell sorting experiments of generated immature CD1a+ LC from 1° cultures (see “Materials and methods”). In these experiments (Figure8), we purified CD1a+ LC from day 10 to 12 cultures by flow sorting and replated them in secondary cultures in the presence of mAbs as described above. As can be seen from Figure 8, most purified immature CD1a+ LC acquire, after further stimulation in control cultures, high expression levels of CD86 and decreased CD1a expression densities indicative of DC maturation. This maturation pattern of LC is associated with secondary cell cluster formation (cluster score 3; data not shown). Parallel cultures supplemented with mAb HECD-1 specific for E-cadherin contained substantially higher percentages of immature CD86− to dim/CD1abright LCs compared with control cultures (64% vs 37% in the representative experiment shown in Figure 8) and showed only minimal cell clustering (score 1). These observations were confirmed in 3 additional experiments using flow sorted CD1a+ LCs (mean ± SE, 66% ± 5% vs 38% ± 2%,P = .008; n = 4). In comparison, control cultures supplemented with a mAb to LFA-1 (CD11a) contained reduced percentages of immature LC (29% vs 37%, Figure 8) and, in turn, higher percentages of phenotypically mature CD1adim/CD86bright DCs. As observed for anti–E-cadherin mAb, mAb to LFA-1 inhibited secondary cluster formation of purified LCs (score 1). Parallel analyses for CD1a versus CD83 expression in 2 experiments revealed virtually identical results (CD83dim/−/CD1abright LCs, 60% vs 32% and 53% vs 36%, respectively; CD86dim/−/CD1abright LCs, 61% vs 32% and 53% vs 36%, respectively). We further analyzed the capacity of generated LC to induce allogeneic T-cell proliferation and found that anti–E-cadherin mAb-pretreated cells appear to be less potent inducers of allogeneic T-cell proliferation at low stimulator cell numbers than cells from control cultures supplemented with a nonbinding control mAb or cells from cultures without antibody supplementation (Figure9).
Effects of mAb addition on maturation of purified CD1a+ LCs.
CD34+ cells were cultured in the presence of GM-CSF plus TNFα, SCF, FL, and TGF-β1 in serum-free medium (see “Materials and methods”). CD1a+ cells from these 1° cultures generated after 10 to 12 days were purified by flow sorting and replated in 2° cultures at a high cell density and in the presence or absence of mAbs to adhesion molecules as indicated (see “Materials and methods”). Diagrams show CD86 versus CD1a molecule expression of cells from representative 2° cultures (after 24 hours of culture) supplemented with mAbs, as indicated. Markers were set according to isotype-matched negative control staining (n = 4).
Immunostimulatory capacity of generated LCs.
CD1a+ LCs were generated in primary cultures and further stimulated in cytokine-supplemented medium (TGF-β1 plus GM-CSF, TNFα, SCF, and FL, ■) or identical medium containing anti–E-cadherin mAb (E-cad, ○) or control mAb (clone VIAP, ⋄), as described in “Materials and methods” (and as also shown in Figure8). Graded numbers of cells obtained from these cultures after 24 hours were used to stimulate 5 × 10⁴ purified allogeneic T cells (see “Materials and methods”). Error bars represent standard deviation of triplicate values. Data are representative of 3 experiments.
Discussion
Our data suggest an active involvement of E-cadherin in the regulation of LC maturation. We demonstrate here that immature LCs generated in cultures of CD34+ cells undergo profound E-cadherin–dependent homotypic cell clustering similar to what has been described recently for in vitro–generated murine LC.26 We also observed that mechanical disruption of these E-cadherin–dependent LC clusters rapidly induces the acquisition of mature DC features (CD86bright, CD83+) by immature LCs. Furthermore, mAb ligation of E-cadherin on the surface of immature LCs after mechanical cluster disaggregation inhibits the maturation of LC. This effect was found to be specific for E-cadherin engagement because mAbs to other adhesion molecule systems that were found to be similarly involved in LC clustering (CD31, LFA-1) failed to inhibit DC maturation when added to parallel cultures. This suggests that anti–E-cadherin mAb induces functional activation of E-cadherin, resulting in the inhibition of DC maturation in this differentiation model. This effect of anti–E-cadherin mAb mimics E-cadherin–dependent homotypic LC clustering because we observed that LCs stay immature if cell clusters remain undisturbed. Thus anti–E-cadherin mAb binding to E-cadherin seems to functionally mimic E-cadherin binding by its homophilic ligand.
Our observations that anti–E-cadherin mAb inhibits the maturation of LC despite the continuos presence of TNFα in culture suggests an active suppressive effect of E-cadherin on the maturation of LC. Using similar culture conditions, several previous studies have demonstrated that TNFα efficiently promotes the acquisition of mature DC features (CD86bright, CD83+) by immature DCs generated in cultures of CD34+ progenitor cells.19-25 We demonstrate here that E-cadherin expression by cultured cells is dependent on TGF-β1 stimulation. Thus, a failure of induction or maintenance of high expression levels of E-cadherin in the absence of exogenous TGF-β1 in the above-mentioned previous studies may be responsible for the observed rapid acquisition of mature DC features by cultured cells. In support of this assumption, recent studies demonstrated that TGF-β1 induces E-cadherin expression by in vitro–generated murine27 and human DC28 along with immature LC features. Furthermore, TGF-β1 stimulates the generation of immature LC-type DCs, whereas it suppresses the generation of mature DCs in TNFα-containing cultures of murine progenitor cells27,29 or human monocytes.30
According to our differentiation model, the following mechanism may allow maintenance of immature LCs in vivo. TGF-β1 stimulation may lead to sustained expression of high levels of E-cadherin on the surfaces of epidermal LCs over long periods of time. This will allow LCs to undergo continuous homophilic E-cadherin adhesion with surrounding keratinocytes. E-cadherin adhesion in turn may suppress LC maturation and thereby maintain immature LC features in vivo. Such a scenario seems to be supported by in vivo studies. First, LCs are well described to rapidly acquire mature DC features after purification from their epidermal micro-environment.14 Second, keratinocytes constitutively express DC maturation-inducing cytokines including TNFα, which, in the absence of an epidermal-associated counteracting mechanism, may cause the maturation of LCs in vivo.31,32Third, immature epidermal LCs abundantly synthesize TGF-β1,33 and TGF-β1 autoproduction is essential for the presence of immature LCs in the epidermis in vivo.34,35 In line with this, TGF-β1 seems to promote rather than inhibit physiological functions of freshly isolated immature LCs.36 In further support of a suppressive effect of E-cadherin adhesion on the maturation of LCs, decreased E-cadherin expression in response to the topical application of allergens is correlated with the local maturation of LCs in the epidermis,8 whereas unspecific inflammatory conditions do not necessarily induce the same effect. Thus E-cadherin–mediated active maturation suppression of LCs, as suggested by our study results, may prevent the uncontrolled maturation of LCs by proinflammatory cytokines in vivo and thus may enable LCs to respond to specific signals, such as particular pathogens or antigens.
In support of a direct functional involvement of E-cadherin in regulating the maturation of epidermal LCs, E-cadherin is capable of inducing a variety of cellular responses, including the regulation of epithelial37 and hematopoietic38,39 precursor cell differentiation. LCs express the intracellular E-cadherin–binding signaling molecule armadilloβ-catenin,40 which is capable of translocating to the nucleus where it is involved, together with other transcription factors of the lymphocyte enhancer-binding factor 1/T-cell factor family, in the expression of specific genes.41,42 Cadherins such as E-cadherin seem to represent negative regulators of catenin signaling.43,44 An important suppressive role of E-cadherin in cell signaling is also suggested by the observation that E-cadherin expression is down-regulated in many carcinomas, an effect correlating with tumor cell metastasis. In turn, tumor metastasis is suppressed by the overexpression of E-cadherin.45,46 Interestingly, the down-regulation of E-cadherin cell surface expression in LC histiocytosis, a tumor originating from epidermal Langerhans cells in vivo, similarly correlates with the occurrence of distant metastasis.47 How E-cadherin activation on the surface of immature LCs may inhibit the transactivation of genes involved in DC maturation and migration remains to be analyzed.
We demonstrate that mAb binding to E-cadherin on the surfaces of immature LCs inhibits the acquisition of mature DC characteristics. This is in line with the concept that lateral clustering of cadherin molecules is critical for cadherin-mediated functional responses, such as tight cell adhesion.48,49 E-cadherin binding by mAb may induce cross-linkage of E-cadherin dimers on the surfaces of LCs, which may mimic E-cadherin clustering in response to the homophilic ligation of E-cadherin. Recent observations with cell lines support this concept. First, E-cadherin adhesion leads to a rapid increase in tyrosine phosphorylation at sites of cell contact formation, and this effect can be mimicked by anti–E-cadherin mAb.50 Second, anti–N-cadherin mAb-coated beads functionally mimic beads coated with the extracellular domain of N-cadherin in inducing tyrosine phosphorylation, accumulating junction-associated β-catenin molecules, and inducing G1 arrest of N-cadherin overexpressing Chinese hamster ovary cells.51,52 On the other hand, E-cadherin redistribution on the cell surface is well described as regulated by inside-out signals—ie, by protein binding to its juxtamembrane cytoplasmic tail53 or by binding of armadilloβ-catenin to the cytoplasmic cadherin tail.46 Thus, E-cadherin activation or deactivation in response to E-cadherin redistribution on LC surfaces is regulated by intracellular signaling pathways.
Our data suggest that the loss of E-cadherin adhesion rapidly induces the maturation of LC. Despite rapid secondary E-cadherin–mediated cluster formation after the disruption of primary LC clusters, most LCs have already undergone maturation (within 24 hours). This indicates that DC maturation in response to loss of E-cadherin adhesion may represent a rapid and irreversible process. These observations may mimic the in vivo situation. In vivo, the down-regulation of E-cadherin expression by LCs seems to precede the emigration of LCs from the epidermis.8
We performed a side-by-side comparison of the effects of soluble CD40L and TNFα on the acquisition of mature DC features by dispersed immature LCs. We observed that both stimuli rapidly induce the acquisition of CD83 expression and the up-regulation of CD86 expression by LCs. However, LCs stimulated in the presence of CD40L showed consistently higher CD86 and CD83 expression densities than those stimulated in the presence of TNFα. In line with this they showed more mature morphologic characteristics. Therefore, our defined serum-free culture model seems to recapitulate 3 consecutive maturation stages of LCs in vivo: immature LCs undergoing E-cadherin adhesion (primary culture, Figure 3A bottom) and resembling immature/nonactivated LCs in epidermis; intermediate-stage LCs that have lost E-cadherin adhesion, are released from a possible active suppressive effect of E-cadherin (Figure 3A, top), and resemble migrating LCs; and LCs stimulated by CD40L (Figure 3A, second panel) that correspond to DC and are activated by antigen-specific T-helper cells by CD40 engagement in secondary lymphoid organs in vivo.54-56 These experiments also demonstrate that the maturation of LCs does not require serum/plasma supplementation of the culture medium, thus confirming recent observations in the murine system.57
As mentioned, our data suggest that E-cadherin–mediated suppression of LC maturation may prevent the uncontrolled maturation of LCs induced by pro-inflammatory mediators. This seems to be in conflict with murine studies, which demonstrated that the same pro-inflammatory mediators that induce LC maturation simultaneously down-regulate E-cadherin expression and E-cadherin–mediated adhesion and, thus, seem to reduce the proposed maturation inhibition by E-cadherin.58Although several parameters vary between this study and ours, it remains to be analyzed whether exogenous TGF-β1 counteracts E-cadherin down-regulation on murine LC induced by pro-inflammatory cytokines.
Although most cells generated in primary TGF-β1– supplemented cultures show LC features (CD1a+, E-cadherin+, Lag+), these cultures also contain approximately 40% of cells that lack expression of CD1a. Interestingly, most of these CD1a− cells share phenotypic features with myelomonocytic precursor cells (CD33+, cytoplasmic CD68+, CD34−), with fractions of them also expressing CD14, lysozyme, or myeloperoxidase.16 We observed that purified fractions of these CD1a− cells can be induced in response to stimulation with TGF-β1 plus GM-CSF, SCF, FL, and TNFα (ie, the initial cytokine combination) to differentiate into CD1a+cells (data not shown). Future studies should analyze further the molecular and functional characteristics of these cells.
In conclusion, active maturation suppression of LCs by TGF-β1–induced E-cadherin adhesion, as suggested by our study, may represent an important epithelium-specific mechanism by which LCs retain their immature features over long time periods and resist uncontrolled activation by pro-inflammatory cytokines.
Acknowledgments
We thank A. Renner for his invaluable contribution in cell separation and flow sorting, M. Merad and R. Smith for critically reading the manuscript, and all the collaborating nurses and doctors of the gynecology departments at Sozialmedizinisches Zentrum Ost and Kaiser Franz Josef Spital for providing cord blood samples.
Supported by the ICP Program of the Austrian Ministry for Research and Transport.
The publication costs of this article were defrayed in part by page charge payment. Therefore, and solely to indicate this fact, this article is hereby marked “advertisement” in accordance with 18 U.S.C. section 1734.
References
Author notes
Herbert Strobl, Institute of Immunology, University of Vienna, Borschkegasse 8A, A-1090 Vienna, Austria; e-mail:elisabeth.riedl@univie.ac.at.

This feature is available to Subscribers Only
Sign In or Create an Account Close Modal