Abstract
To better characterize human dendritic cells (DCs) that originate from lymphoid progenitors, the authors examined the DC differentiation pathways from a novel CD7+CD45RA+ progenitor population found among cord blood CD34+ cells. Unlike CD7−CD45RA+ and CD7+CD45RA− progenitors, this population displayed high natural killer (NK) cell differentiation capacity when cultured with stem cell factor (SCF), interleukin (IL)-2, IL-7, and IL-15, attesting to its lymphoid potential. In cultures with SCF, Flt3 ligand (FL), granulocyte-macrophage colony-stimulating factor (GM-CSF), and tumor necrosis factor (TNF)-α (standard condition), CD7+CD45RA+ progenitors expanded less (37- vs 155-fold) but yielded 2-fold higher CD1a+ DC percentages than CD7−CD45RA+ or CD7+CD45RA− progenitors. As reported for CD34+CD1a− thymocytes, cloning experiments demonstrated that CD7+CD45RA+ cells comprised bipotent NK/DC progenitors. DCs differentiated from CD7−CD45RA+ and CD7+CD45RA+ progenitors differed as to E-cadherin CD123, CD116, and CD127 expression, but none of these was really discriminant. Only CD7+CD45RA+ or thymic progenitors differentiated into Lag+S100+Langerhans cells in the absence of exogenous transforming growth factor (TGF)-β1. Analysis of the DC differentiation pathways showed that CD7+CD45RA+ progenitors generated CD1a+CD14− precursors that were macrophage-colony stimulating factor (M-CSF) resistant and CD1a−CD14+ precursors that readily differentiated into DCs under the standard condition. Accordingly, CD7+CD45RA+ progenitor-derived mature DCs produced 2- to 4-fold more IL-6, IL-12, and TNF-α on CD40 ligation and elicited 3- to 6-fold higher allogeneic T-lymphocyte reactivity than CD7−CD45RA+ progenitor-derived DCs. Altogether, these findings provide evidence that the DCs that differentiate from cord blood CD34+CD7+CD45RA+ progenitors represent an original population for their developmental pathways and function.
Introduction
Dendritic cells/Langerhans cells (DCs/LCs) are essential antigen-presenting cells for initiating and maintaining the adaptative immune response.1 Recently, the DC system has become increasingly complex, with reports of discrete populations in humans and mice, the significance of which remains enigmatic.2-10 For example, human DCs can differentiate from CD34+ hematopoietic progenitor cells (HPCs) in the cord blood,11 the adult bone marrow or blood,5,12,13 or the thymus,14 and also from monocytes,15-17ILT3+/ILT1−/CD123+ plasmacytoid cells,6 CD2+ or CD68+ blood precursors, or even granulocyte-committed cells.9,18 19 It is still unclear whether such ontogenic diversity reflects the plasticity of DC progenitors and precursors or indicates that under appropriate conditions, eg, an inflammatory environment, a wide range of hematopoietic cells have the capacity to acquire the phenotype and function of DCs.
Classically, distinct DC subsets are obtained from human CD34+ HPCs along 2 major pathways leading to either CD1a+ precursor-derived LC-like DCs or CD14+precursor-derived DCs related to monocyte-derived DCs,20-24 a view that has been confirmed in mice.25 However, this dual LC versus “myeloid” DC model has been challenged by data that HPCs with lymphoid potential also generate DCs. The concept of lymphoid DCs arose from the observation that DCs and T lymphocytes can both develop from murine Sca+CD4lo thymic precursors26: Such DCs are now recognized as an original population regarding their CD8α+DEC205+CD11b−phenotype,26-29 RelB-independent development,30 and capacity to promote T-helper type 1 (Th1) responses.31,32 In humans, the first evidence of possible lymphoid DCs was the finding that DCs, T/B lymphocytes, and natural killer (NK) cells but not myeloid, megakaryocytic, or erythroid cells could differentiate from fetal marrow CD34+CD10+CD45RA+HPCs.33 This lineage promiscuity of DCs and lymphoid cells has been further documented by showing that thymic CD34+HPCs display DCs and NK cell potentials.14 34-36 However, the DC progeny of lymphoid HPCs is still poorly characterized, and it is currently unknown whether they relate to myeloid DCs, CD123hi precursor-derived DCs, or LCs, or whether they represent an original population. To approach this point, we analyzed herein the differentiation of DCs from cord blood CD34+ HPC populations identified according to their lymphoid and myeloid differentiation potential.
Materials and methods
Isolation of CD34+ cells from the cord blood and thymus
Normal cord blood (laboratoire Senders, hôpital Saint-Vincent de Paul; service de Gynécologie-Obstétrique, hôpital Saint-Antoine, Paris, France) was collected according to institutional guidelines. After Ficoll-Paque (Pharmacia, Uppsala, Sweden) centrifugation, mononuclear cells were enriched in low density cells by centrifugation on Percoll (d: 1.070, Pharmacia). CD34+ HPCs were purified with CD34 monoclonal antibody (mAb) 561-coated M-450 Dynabeads (Dynal, Oslo, Norway),37yielding 93% ± 6% viable CD34+ cells (n = 36). These cells (1 × 10⁶/mL) were incubated for 30 minutes at 4°C in phosphate-buffered saline (PBS), 2% fetal calf serum (FCS; Dutscher, Brumath, France), with CD34-phycoerythrocyanin (PECy5) (clone 581), CD7-fluorescein isothiocyanate (FITC) (clone 8H8.1) (both from Immunotech, Marseille, France) and CD45RA-phycoerythrin (PE) (clone HI100; Pharmingen, San Diego, CA) mAbs, diluted 1:50 final; CD34+CD7+CD45RA−, CD34+CD7+CD45RA+, and CD34+CD7−CD45RA+ HPCs were then differentially sorted with a FACStar Plus (Becton Dickinson, San Jose, CA), yielding 96% ± 1% pure populations (n = 36).
Thymic progenitors were purified as described34 from normal thymus of children undergoing cardiac surgery. Thymocytes were obtained by Ficoll-Paque centrifugation, CD34+ cells were purified with CD34 mAb 561-coated M-450 Dynabeads, labeled with CD34-PE (clone 581) and CD1a-FITC (clone BB5, Diaclone, Besançon, France) mAbs, and CD34+CD1a− cells were sorted with a FACStar Plus.
Culture of natural killer cells
Cord blood CD34+ HPCs and subsets thereof (1-3 × 10⁴/mL), sorted according to CD7 and CD45RA expression as described previously, were cultured at 37°C in humidified 5% CO2, in RPMI 1640, 10% FCS, 1% glutamine, 1% antibiotics (GIBCO BRL, Paisley, Scotland), with human recombinant cytokines: 50 ng/mL stem cell factor (SCF) (specific activity 1.2 × 10³ U/μg), 100 U/mL interleukin (IL)-2, 20 ng/mL IL-7 (specific activity ≥ 2 × 10⁶ U/mg), and 20 ng/mL IL-15 (specific activity greater than or equal to 2 × 10⁶ U/mg) (all from Valbiotech, Paris, France). Cultures were maintained for up to 2 months with half change and cytokine addition every 3 to 4 days. CD56+CD8−NK cell percentages were evaluated by double staining with CD8-FITC (clone T6) and CD56-rhodamin (RD1) (clone NKH1), both from Coulter Clone, Margency, France.
Culture of dendritic cells
HPCs (1-2 × 10⁴/mL) were cultured as reported22,23,37 38 in 6-well plates (ATGC, Noisy le Grand, France) in RPMI 1640, 10% FCS, 1% glutamine, 1% antibiotics, with the following cytokines: 20 ng/mL granulocyte-macrophage colony-stimulating factor (GM-CSF) (specific activity 1.125 × 10⁷ U/mg; gift of Schering Plough, Kenilworth, NJ), 50 ng/mL SCF (gift of Amgen, Thousand Oaks, CA), 50 ng/mL Flt3 ligand (FL; gift of Immunex, Seattle, WA), and 50 U/mL tumor necrosis factor (TNF)-α (Genzyme, Cambridge, MA). When used, IL-4 (50 ng/mL, gift of Schering Plough; specific activity 2.41 × 10⁷U/mg) and trimeric CD40 ligand (CD40LT; 0.5 μg/mL; gift of Immunex) were added from culture day 5, whereas macrophage (M)-CSF (250 ng/mL; specific activity 1.5 × 10⁵ U/μg; R&D Systems, Minneapolis, MN) or transforming growth factor (TGF)-β1 (10 ng/mL; specific activity 5 × 10⁵ U/mg; Genzyme) was added at culture initiation or on day 5. Medium and cytokines were renewed every 3 days. Thymic CD34+CD1a− progenitors were cultured under the same conditions, except that IL-7 was added during the first 3 days of culture.
Limiting dilution analysis and single-cell cultures
Limiting dilution analysis was performed as reported.35CD34+CD7+CD45RA+ and CD34+CD7−CD45RA+ HPCs were seeded into 96-well plates (ATGC) at 300, 100, 30, 10, 3, and 1 cell per 200 μL/well. Cultures supplemented with SCF, FL, GM-CSF, and TNF-α (DC condition) or with SCF, IL-2, IL-7, and IL-15 (NK condition) were maintained with half medium change and fresh cytokines added every 6 to 7 days. Plates were examined weekly, and cell-containing wells were scored under the microscope. At the end of 3 weeks, DCs were identified by FACS, which was based on CD1a expression, or morphology after 48-hour culture in the presence of CD40LT (CD40LT; 0.5 μg/mL) when less than 500 cells per well were available. NK cells were detected by FACS after labeling with CD56-PE (clone Leu-19, Becton Dickinson) or under the microscope after 20 minutes incubation with CD56 mAb (clone Leu 19)-coated magnetic beads (Dynal).35 The maximum likelihood estimate of DC or NK progenitors was calculated according to the single hit Poisson model.35
For single-cell suspension cultures, CD34+CD7+CD45RA+ HPCs were plated in 96-well plates (0.3 cell per 200μL/well), and cultured as previously described, but in the simultaneous presence of SCF, FL, GM-CSF, TNF-α, IL-2, IL-7, and IL-15 (DC and NK conditions). Cell-containing wells were scored on days 19 to 21. NK cells were detected as described previously, using CD56 mAb-coated beads, whereas DCs were identified on the basis of their morphology.
Flow cytometry cell surface marker analysis
Cells were incubated for 30 minutes at 4°C with mAbs (1:100 final unless specified) in PBS, 2% FCS, with or without 2% AB serum (Site Transfusionnel Pitié-Salpêtrière, Paris, France), washed, and analyzed with a FACscalibur (Becton Dickinson). HPCs were labeled with CD34-PE-Cy5 and the following mAbs: CD2-PE (clone 39C1.5), CD3-FITC (clone SK7), CD7-FITC (clone 8H8.1), CD38-FITC (clone T16), and CD44-FITC (clone J173) from Immunotech; CD7-PE (clone SK7), CD10-FITC (clone W8E7), CD13-PE (clone L138), CD19-PE (clone 4G7), and CD33-PE (clone P67-6) from Becton Dickinson; CD45RA-PE (clone HI100), CD45RO-FITC (clone UCHL1), CD64-FITC (clone 10.1), CD86-PE (clone FUN-1), and CD90/Thy1-FITC (clone 5E10) from Pharmingen; and rat anti-CLA mAb HECA-452 (gift from L. J. Picker and P. R. Bergstresser, Dallas, TX). In addition to CD1a-FITC, DCs were examined with the following mAbs: CD11b-PE (clone bear 1), CD11c-PE (clone BU15), CD83-PE (clone HB15A), CD116-PE (GM-CSFR; clone SCO6), and CD127-PE (IL-7R; clone R34.34, diluted 1:5) from Immunotech; CD14-PE (clone LeuM3) and CD14-allophycocyanin (clone MΦP9), CD123-PE (IL-3R; clone 9F5, diluted 1:5) from Becton Dickinson; anti–E-cadherin (clone HECD-1; R&D Systems). When anti–E-cadherin or anti-CLA unconjugated mAbs were used, labeling was developed by goat antimouse F(ab′)2-PE or antirat F(ab′)2-FITC (anti-CLA) secondary antibodies. Isotype-matched FITC-, PE-, and allophycocyanin-conjugated irrelevant control mAbs were from Immunotech and Becton Dickinson; unconjugated mouse and rat isotype controls were from Immunotech and Caltag (San Francisco, CA), respectively.
Secondary cell sorting
Culture day 5 or day 8 cells (1-5 × 10⁶/mL) were incubated at 4°C for 30 minutes with CD14-PE and CD1a-FITC mAb (1:50), resuspended in PBS, 2% FCS, and sorted with a FACStar Plus, based on CD1a or CD14 expression. This resulted in 99% ± 1% pure populations (n = 12).
Confocal microscopy
Cells were washed with PBS and cytospun onto glass slides, which were dried before 10-minute fixation in PBS, 3% paraformaldehyde at 20°C, and permeabilized with PBS, 0.05% saponin, 0.2% BSA, 0.5% AB serum. Cells were stained with 1:100 diluted unconjugated mouse anti-Lag mAb39 (a gift from F. Furukawa, Handacho, Hamamastu; K. Yoneda and S. Imamura, Kyoto; Japan) or with rabbit anti-S100 antibodies (Dako, Glostrup, Denmark) diluted 1:500. Staining was developed with a tetramethyl-rhodamin-isothiocyanate–conjugated (TRITC) swine antirabbit antibody (Dako) diluted 1:40, or with biotinylated swine antigoat, -mouse, and -rabbit multilink antibodies (Dako) diluted 1:50, followed by tetramethyl-rhodamin-isothiocyanate–conjugated streptavidin (Immunotech) diluted 1:200, and mounted in fluorescent-mounting medium (Dako). Normal rabbit serum (Dako) or mouse IgG1 (Immunotech) were used as isotype-matched controls. Confocal laser scanning microscopy and fluorescence analysis were performed using a Sarastro CLSM1000 confocal microscope (Molecular Dynamics, Sunnyvale, CA). Excitation was obtained by an argon laser filtered at 514 nm, which ensures low background light and TRITC emission. The selected dichroic filter was DF 530 nm; to avoid excitation noise at emission, fluorescence acquisition was performed using a 550-nm high-pass filter in 256 × 256 or 512 × 512 pixel matrices, and a 50-μm pinhole size. Laser power was set to 25 mW and the pm detector was set at values ranging from 778 to 1078 V (sensitivity adjustments). Images at 0.25 μm pixel size were obtained at × 40 magnification, 1.0 numerical aperture, and analyzed as reported.40 Also, visualization of images in pseudocolor provided a supplementary tool for interpretation when the signal was low. The blue representation of corresponding values emphasized legibility of images.
Electron microscopy
Culture day 8 cells were washed and fixed for 18 hours with 2% glutaraldehyde in cacodylate buffer, then with 1% osmium tetroxyde, and embedded in epoxy medium after dehydration through a graded series of ethanols. Ultrathin sections were poststained with uranyl acetate and lead citrate and examined on a JEOL 1200EX electron microscope (CMEABG, Université de Lyon, France). A minimum of 100 to 150 cells of each population were analyzed for their morphology and the presence of Birbeck granules (BGs).
Mixed leukocyte reaction assay
Responder allogeneic adult T lymphocytes enriched to more than or equal to 85% as described41 (105 cells per well in 96-well U-bottomed culture microplates; Costar) were cultured for 6 days with 0.1 to 5 × 10³ stimulating cells in RPMI 1640, 10% heat-inactivated AB serum, 1% glutamine, 1% antibiotics. Stimulating cells were day 10 mature DCs from sorted CD45RA+CD7−, CD45RA+CD7+, or bulk CD34+ HPC cultures. Incorporation of [3H]thymidine (0.037 MBq [1 μCi] per well; Amersham, Amersham, UK) was assessed by 18-hour pulse. Results are mean counts per minute (cpm) of triplicates.
Detection of cytokines in culture supernatants
CD1a+CD14−and CD1a−CD14+ precursors were sorted on day 5 from cultures of CD34+CD7+CD45RA+or CD34+CD7−CD45RA+ HPCs and cultured for another 48 hours under the standard condition plus IL-4. Immature CD1a+83− DCs (0.5 to 1 × 10⁵ cells/mL) were then recovered, washed, and cultured for 72 hours with CD40LT (0.5 μg/mL, Immunex) before supernatants were collected. Because only limited DC numbers were available, cytokine levels were normalized according to total viable cell counts, and expressed as picograms per 105cells.
Cytokines were also assayed in day 3, 5, and 7 supernatants of mixed leukocyte reaction (MLR) (ratio: 5 × 10³ DCs per 105 T lymphocytes). Alternatively, MLR day 7 T lymphocytes (2.5 × 10⁵ cell/mL) were restimulated for 48 hours with immobilized CD3 and CD28 mAbs (Immunotech) before supernatants were collected.
Supernatants were kept at −20°C until used. IL-1β, IL-1RA, IL-4, IL-6, IL-10, IL-12p40 and IL-12p70, IL-15, interferon (IFN)-γ, and TNF-α were measured by enzyme-linked immunosorbent assay (ELISA) according to the manufacturer's instructions (R&D Systems; or Biosource SA Europe, Nivelles, Belgium, for TNF-α).
Statistics
Results are shown as means ± SD of data. Statistical analyses were performed with the paired Student t test or by analysis of covariance.
Results
Phenotypic characterization of cord blood CD34+ hematopoietic progenitor cells
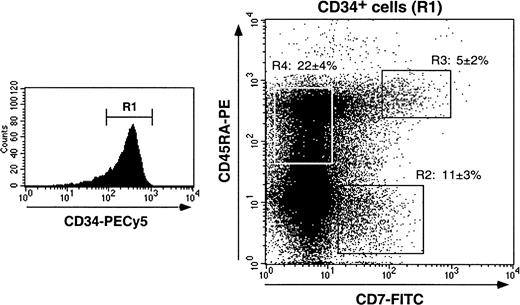
We first examined markers that distinguish myeloid from lymphoid HPCs (CD13, CD33, CD44, CD45RA, CD64, CD86 vs CD2, CD3, CD7, CD10, CD19),14,33,42-48 or immaturity markers (CD38, CD90/Thy1): 17% ± 4% of CD34+ HPCs (n = 17) expressed CD7, 12% ± 4% and 27% ± 4% were CD10+ or CD45RA+, respectively, whereas less than 1% were CD2+, CD3+, or CD19+. Colabeling for CD34, CD38, and CD7 or CD10 showed that CD34+CD7+ HPCs expressed intermediate to high CD38 levels, whereas CD34+CD10+ HPCs were mainly CD38loCD90/Thy1+ and thus corresponded to more immature cells (data not shown). According to CD45RA and CD7 expression, 3 CD34+ HPCs populations were distinguished (Figure 1): these CD7+CD45RA−, CD7+CD45RA+, and CD7−CD45RA+ cells represented 11% ± 3%, 5% ± 2%, and 22% ± 4% of HPCs, respectively, with no difference being noted whether they were analyzed in enriched CD34+ cells or among bulk mononuclear cells (data not shown). Of note, none of these populations expressed membrane or cytoplasmic CD3 (data not shown). CD13, CD33, and CD44 were expressed by more than or equal to 95% of CD34+ HPCs independent of CD7 or CD45RA, but CD45RO, CD64, and CD86 were undetectable or barely detectable. Finally, about 75% of CD34+ HPCs were CLA+,8 but there was no correlation with CD7 or CD45RA expression.
Characterization of cord blood CD34+ HPC populations according to CD7 and CD45RA expression.
Purified CD34+ cells were labeled with CD34-PECy5, CD7-FITC, and CD45RA-PE mAbs and analyzed by 3-color FACS analysis. Cells were gated based on low forward and side scatters and high CD34 expression (R1). Sort windows R2, R3, and R4 were set based on labeling with control mAbs (data not shown). CD7+CD45RA−, CD7+CD45RA+, and CD7−CD45RA+CD34+ HPC percentages are means ± SD (n = 17).
Natural killer cells differentiate only from CD34+CD7+CD45RA+ hematopoietic progenitor cells
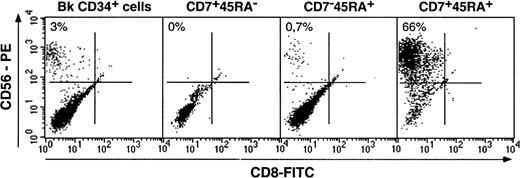
We first examined the 3 HPC populations for the capacity to generate NK cells as a marker of their lymphoid potential. Bulk HPCs and sorted subsets were cultured with SCF, IL-2, IL-7, and IL-15, which has proved as efficient for the generation of NK cells from the cord blood HPCs.49 Growth of cells with the NK phenotype was monitored on the basis of CD56 expression.50 Under the conditions used here, only CD7+CD45RA+ HPCs had NK cell potential: On culture days 14 to 21, they yielded 59% ± 6% CD56+CD8−cells (n = 7) with NK cytotoxic activity (data not shown) relative to 1% ± 0.5% for CD7−CD45RA+ and 2% ± 0.1% for bulk HPCs (Figure 2). Surprisingly, no NK cells were detected in CD7+CD45RA− HPC cultures, even after up to 60 days (data not shown). The CD56− cells in the cultures were almost exclusively myeloid CD14+/−CD1a+/− cells. CD3 and CD19 labeling was undetectable, which indicates the lack of T or B lymphocyte differentiation in this system. At variance with thymic CD34+CD1a−HPCs,34 differentiation of NK cells from CD34+CD7+CD45RA+ HPCs was dependent on IL-15 (data not shown).
Differentiation of NK cells from CD34+CD7+CD45RA−, CD34+CD7+CD45RA+, and CD34+CD7−CD45RA+ HPCs.
Cells were cultured for 3 weeks with SCF/IL-2/IL-7/IL-15, labeled with CD8-FITC and CD56-PE mAbs, and FACS analyzed. Quadrants were set based on labeling with control mAbs. CD56+CD8− NK cell percentages, indicated in the upper left corner, are from one representative experiment of 5 for bulk (Bk) CD34+ HPCs, CD34+CD7+CD45RA−(CD7 + 45RA−) and CD34+CD7−CD45RA+(CD7−45RA+) HPCs, and of 7 for CD34+CD7+CD45RA+(CD7+45RA+) HPCs.
Differentiation of dendritic cells from CD34+CD7−CD45RA+, CD34+CD7+CD45RA+, and CD34+ CD7+CD45RA− hematopoietic progenitor cells
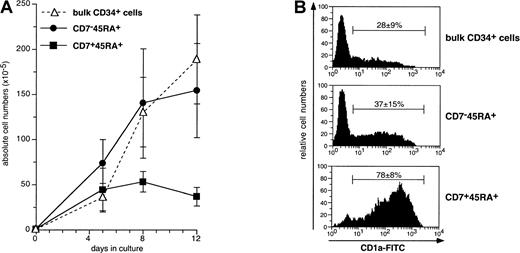
We next examined the capacity of the HPC subsets to differentiate into DCs in cultures with SCF/FL/GM-CSF/TNF-α, referred to as the standard condition.37,38,51 This was followed based on CD1a expression. CD34+CD7−CD45RA+cells (referred to thereafter as single positive [SP]) expanded at similar levels than bulk HPCs, whereas growth of CD34+CD7+CD45RA+ (double positive [DP]) cells was more limited (Figure3): Starting from 1 × 10⁵cells on day 0, day 12 cell recovery was 3.7 ± 1.0 × 10⁶ cells for DP cells versus 15.5 ± 5.2 × 10⁶ for SP cells. Nonetheless, the highest CD1a+ DC percentages were found in DP cell cultures. There were already 47% ± 6% DCs as early as culture day 5, 78% ± 8% on day 8, and 73% ± 22% on day 12, relative to 33% ± 10%, 37% ± 15%, and 45% ± 17% DCs for SP HPCs (P ≤ .02; day 8 and day 12). Also, at variance with thymic CD34+CD1a− HPC,34 DP HPC survival, growth, and differentiation did not require exogenous IL-7, which was in agreement with the lack of CD127 expression (data not shown). Finally, because of limited expansion, DP HPCs generated lower DC numbers than SP HPCs (2.6 ± 1.1 × 10⁶ vs 7.7 ± 4.1 × 10⁶; P = .04; n = 6). Of note, comparable DC percentages and absolute numbers were found in cultures of SP and bulk HPCs.
Expansion and differentiation into DCs of SP (CD7−45RA+), DP (CD7+45RA+), and bulk CD34+ HPCs cultured under the standard condition.
(A) Viable cell numbers were normalized relative to 1 × 10⁵ seeded HPCs; means ± SD (n = 5 to 8); differences were significant on days 5, 8, and 12 (P = .03 to .007) between DP and SP HPCs, and on day 8 (P = .001) and 12 (P = .0005) between DP and bulk HPCs. (B) FACS analysis of day 8 CD1a-FITC-labeled cells; means ± SD CD1a+ DC percentages (n = 8); differences between DP and SP or bulk HPCs (P ≤ .001), between SP and bulk HPCs (P = .07).
CD34+CD7+CD45RA− HPC expanded less than bulk HPCs: starting from 1 × 10⁵ cells, 3.9 ± 2.6 × 10⁶ cells were recovered on day 12 versus 20.2 ± 10.2 × 10⁶ for bulk HPCs (P = .03; n = 5). This was associated with delayed differentiation into DCs, which represented 5% ± 3% of cells on day 5 versus 15% ± 7% in bulk HPC cultures (P = .04; n = 4). However, later on, CD1a+ cell percentages were somewhat higher, but not significantly, in CD34+CD7+CD45RA− HPC cultures (day 8: 36% ± 19% vs 27% ± 10%; day 12: 52% ± 14% vs 36% ± 9%; P ≥ .10).
Altogether, these data indicate that, as with respect to NK cell differentiation, DP HPCs also display the highest capacity to generate DCs under the conditions used here.
Dendritic cells and natural killer cells differentiate from common double positive progenitors
We thus examined whether DP HPCs comprised common DC and NK cell progenitors. To this end, cells were plated at limiting dilutions and cultured for 3 weeks under the DC or the NK condition before scoring positive wells. DCs and NK cells were then assessed by FACS, based on CD1a or CD56 expression. When cell numbers were too low, DCs were identified according to their morphology after a 48-hour culture in the presence of CD40LT, and NK cells by the binding of CD56 mAb-coated beads. In 2 independent experiments, clonogenicity was estimated as 1:3 and 1:4 under the DC condition, relative to 1:22 and 1:42 under the NK condition, DCs being found in all positive wells cultured under either condition; NK cell progenitor frequency were estimated as 1:23 and 1:76 under the NK condition. As to SP HPCs, almost all wells still scored positive for DCs at the 1 cell per well dilution under the DC condition, and no NK cells were found under the NK condition.
Because these data suggested that DP HPCs might contain bipotent DC/NK progenitors, cells were seeded under clonal conditions (0.3 cell per well) and cultured for 3 weeks with cytokines of both the DC and NK conditions to allow for the simultaneous differentiation of both cell types. Again, in 2 independent experiments, typical DCs were found in all cell-containing wells, whereas only 5% and 30% of the clones also yielded NK cells that bound CD56 mAb-coated beads (data not shown). Thus, at least a subset of DP HPCs has the capacity to generate both DCs and NK cells under the conditions used here.
Phenotypic characterization of dendritic cells differentiated from single positive and double positive hematopoietic progenitor cells
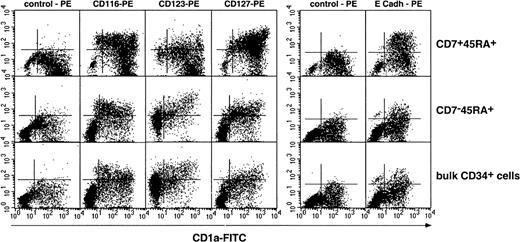
We then examined whether DCs from SP or DP HPC origin differed as to expression of cytokine receptors CD116/GM-CSFR, CD123/IL-3R, CD127/IL-7R, as well as of CD11b, CD11c, CD83, and E-cadherin. Irrespective of origin, DCs were homogeneously CD11b+CD11c+ (data not shown); DCs from SP or bulk HPC cultures were CD123+, expressed intermediate CD116 and CD127 and low to undetectable E-cadherin levels, whereas DCs from DP HPC cultures displayed a more complex pattern: Most CD1ahi DCs were CD123−, about 50% being also CD116lo/−, whereas CD1aint/lo DCs were CD116+CD83+ (Figure4; data not shown), indicating that these corresponded to immature and mature DCs, respectively. Of note, 36% ± 13% of DP HPC-derived DCs expressed E-cadherin (E-cadh) irrespective of CD1a level, relative to 13% ± 9% and 16% ± 9% (P ≤ .03; n = 6) for DCs from SP or bulk HPC cultures. Because such discrepancies could relate to differences in DCs differentiation/maturation kinetics as well as origin, IL-4, TGF-β1 or CD40LT was added from day 5 onward to SP and DP HPC cultures with SCF/FL/GM-CSF/TNF-α. On day 8, 3 days later, immature CD1ahi DCs were all CD83−CD123lo/−CD127−E-cadh+in cultures with IL-4 or TGF-β1, whereas CD40LT induced homogeneous mature CD1alo/−CD83+CD123+CD127+E-cadh+DCs (data not shown). That no difference was noted between SP-, DP- or bulk HPC-derived DCs indicates that CD123, CD116, or E-cadherin expression relates to the DC differentiation/maturation stage rather than origin.
Phenotypic characterization of DCs differentiated from DP (CD7+45RA+), SP (CD7−45RA+), and bulk CD34+ HPCs.
Results are shown as 2-color fluorescence plots of cells cultured for 8 days under the standard condition, labeled with CD1a-FITC and the corresponding mAbs (y-axis) and FACS analyzed. Quadrants were set according to control antibody labeling. Composite results of 2 experiments of 12.
Double positive hematopoietic progenitor cells do not require exogenous tumor growth factor β1 to differentiate into Langerhans cells
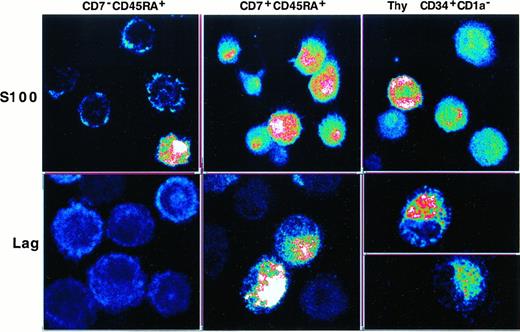
We then investigated whether SP or DP HPCs could differentiate into LCs. This was first approached by assessing Lag and S100 expression by DCs of 8-day cultures under the standard condition, with IL-4 being added for the last 3 days. The immature CD1a+DCs obtained in this manner were sorted from SP HPC, but not from DP HPC, cultures because at that time they represented more than or equal to 90% of the cells. Confocal microscopy examination showed that SP HPC-derived DCs were essentially Laglo/−, with only 10% to 25% being S100+. In contrast, DCs originating from DP HPCs were S100+ and approximately 30% were Laghi. Interestingly, most DCs differentiated from CD34+CD1a− thymic HPCs were also S100+, and 30% to 40% coexpressed Lag (Figure5). Because these data argued for an association between the lymphoid and LC differentiation potential of the HPCs, we examined whether TGF-β1 affected Lag expression by the DC progeny of DP and SP HPCs. In cultures conducted for 8 days in the presence of TGF-β1, the DCs obtained expressed similar CD1a, E-cadherin, CD83 and CD116 levels, and 60% to 80% became Laghi irrespective of their origin (data not shown).
Confocal fluorescence microscopy analysis of S100 and Lag expression by immature DCs differentiated from SP (CD7−45RA+), DP (CD7+45RA+), or CD34+CD1a− thymic HPCs.
SP HPCs were cultured for 8 days under the standard condition, IL-4 being added from day 5 onward before DCs were sorted, based on high CD1a expression, and cytospun; DP and thymic HPCs were cultured and processed under the same conditions but without preliminary sorting (CD1ahi DC more than or equal to 90% of day 8 cells). Images at 0.25 mm pixel size were obtained at × 40 magnification, 1.0 numerical aperture, and visualized in pseudocolor. Results are representative of 2 of 6 experiments.
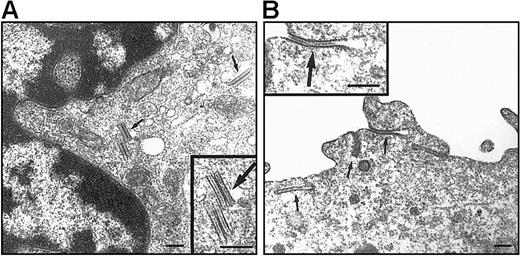
On electron microscopy (EM) examination, no BGs were observed in DCs differentiated under the standard condition (data not shown). As to DP HPC-derived DCs, this discrepancy with Lag labeling was not unexpected because these are transient structures found only in less than or equal to 20% of CD34+ HPC-derived Lag+LCs.52 In the presence of TGF-β1 (Figure6), 10% to 35% of DCs originating from DP HPCs were BG+ relative to 0% to 20% for their SP HPC counterparts: DP HPC-derived DCs displayed typical, short rod-shaped, BGs with periodically striated lamella that were located in the central portion of the cytoplasm particularly in the Golgi region, whereas long and curved BGs derived resembling cytomembrane-sandwiching and endocytic structures formed by superimposition of clathrine-coated parts of the plasma membrane were observed in DCs differentiated from SP HPCs.
EM examination of DCs originating from DP and SP HPCs.
DCs were sorted as indicated in the legend of Figure 5, from 9 day cultures under the standard condition with TGF-β1 added from culture day 0. Both DP HPC-derived (A) and SP HPC-derived (B) DCs present BGs (arrows). Note that typical cytoplasmic rod-shaped BGs, located at the vicinity of the Golgi apparatus, are present in DP HPC-derived DCs; in SP HPC-derived DC BGs are predominantly formed by a sandwiching process of the plasma membrane. Bars represent 200 nm. Data are from 1 of 2 experiments.
Thus, DP and SP HPCs can both generate BG+ LCs, but only SP HPCs require exogenous TGF-β1.
Analysis of the CD1a+CD14−and CD1a−CD14+ dendritic cell differentiation pathways from single positive and double positive hematopoietic progenitor cells
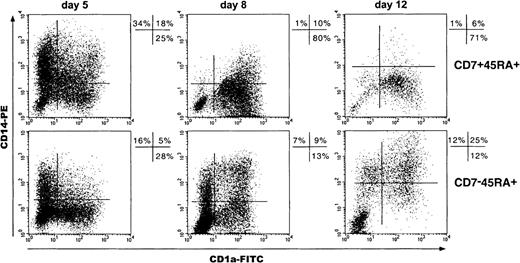
Because studies of DC differentiation from CD34+CD1a− thymic HPCs have shown the predominance of CD1a+CD14−over CD1a−CD14+ precursor-derived DCs,34 we examined these pathways in SP and DP HPC cultures by sequential CD1a and CD14 double labeling of cells (Figure7). Total day 5 CD1a+ cell percentages were greater among the progeny of DP than of SP HPCs (47% ± 6% vs 33% ± 10%; P = .07; n = 4), which was primarily due to the occurrence of CD1a+CD14+ cells and resulted paradoxically in 2-fold higher total CD14+ cell percentages (51% ± 9% vs 25% ± 9%; P = .07). However, on day 8, percentages of CD1a+CD14− (46% ± 8% vs 20% ± 11%; P = .002; n = 8) as well as of CD1a+CD14+ DCs (32% ± 5% vs 18% ± 6%;P = .004) were greater in DP HPC cultures, indicating that most day 5 CD14+ cells had then acquired CD1a. Accordingly, total CD14+ cell percentages in DP HPC cultures decreased from about 50% to 15% from day 5 to day 12, whereas they remained around 25% in SP HPC cultures. Thus, although DP HPCs do not preferentially differentiate into DCs via CD1a+CD14− precursors, their CD1a−CD14+ progeny readily differentiate into DCs under the standard condition. Of note, SP HPC-derived CD14+ cells failed to down-regulate CD14 even when cultured for up to 15 to 20 days, unless it was with 10-fold more TNF-α (500 instead of 50 U/mL), which indicates that this phenomenon does not depend on the kinetics of SP and DP HPC growth and differentiation (data not shown).
Kinetics of CD1a and CD14 expression by cells of SP (CD7−45RA+) and DP (CD7+45RA+) HPC cultures.
Results are 2-color fluorescence plots of cells taken on different days, labeled with CD1a-FITC and CD14-PE mAbs, and FACS analyzed. Quadrants were set according to control mAb labeling. Data and percentages are from 1 experiment of 4, 8, and 6 on days 5, 8, and 12, respectively.
We next assessed the effect of M-CSF on SP and DP HPC expansion and differentiation, based on the assumption that it would up-regulate CD14 expression by c-fms/CD115+ precursor-derived DCs.16 20 When M-CSF was added to the other cytokines, only SP HPCs expanded from 1 × 10⁵ day 0 cells to 29 ± 15 × 106 on day 12 relative to 19 ± 11 × 106 without M-CSF (P = .006; n = 6), whereas DP HPC cultures yielded only 4 ± 2 × 10⁶ cells whether M-CSF was present or not. In parallel, relative CD1a−CD14+ and CD1a+CD14+ cell numbers in SP HPC cultures with M-CSF were greater than under the standard condition, but this was not found for DP HPC-derived cells (Figure8A). Accordingly, day 12 CD1a+CD14− DC percentages decreased from 29% ± 15% to 4% ± 4% (P = .008; n = 6) when M-CSF was added to SP HPC cultures relative to 49% ± 23% versus 23% ± 14% (P = .20; NS) for DP HPCs under the same condition (Figure 8B). Of note, when cultured in the presence of M-CSF, only about 10% of DCs that differentiated from thymic CD34+CD1a− HPCs became CD14lo(data not shown).
Effect of M-CSF on SP (CD7−45RA+) and DP (CD7 + 45RA+) HPC growth and differentiation.
Cells from cultures under the standard condition, with (+) or without (−) M-CSF, were recovered on day 12, labeled, and analyzed as indicated in the legend of Figure 6. (A) Data (means of 3 experiments) are expressed as absolute labeled cell numbers ([percent labeled cells × cell number]/100) normalized relative to 1 × 10⁵ seeded HPCs; statistical significance of differences between the (+) and (−) conditions are indicated (upper panel). (B) Results of one experiment are shown as 2-color fluorescence plots of cells labeled with CD1a-FITC and CD14-PE mAbs; quadrants were set according to control antibody labeling.
These data indicate that most DC precursors generated from SP HPCs are c-fms/CD115+ whereas DP HPCs yield CD1a+CD14−c-fms/CD115−M-CSF-resistant DC precursors.
Functional characterization of dendritic cells differentiated from single-positive and double-positive hematopoietic progenitor cells
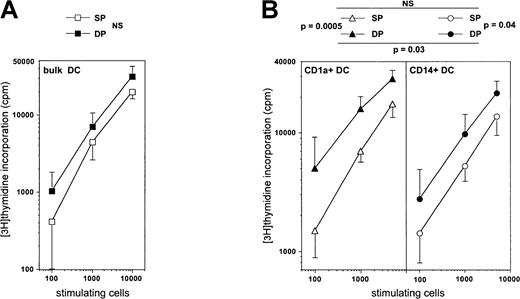
We then examined whether DC function could depend on the HPC they derive from by comparing the allogeneic MLR stimulating capacity of mature DCs derived from either SP or DP HPCs. Immature CD1a+ DCs sorted from day 8 standard condition cultures, to which IL-4 was added from day 5, were cultured for 3 more days in the presence of CD40LT, yielding homogeneously mature CD83+ DCs (data not shown). When these were added to allogeneic adult T lymphocytes, the same MLR stimulation level could be reached with about 2-fold less DP HPC-derived than SP HPC-derived DCs (P = .12; NS) (Figure 9A). Because we previously showed that, overall, CD1a+CD14− precursor-derived DCs elicit stronger MLR than those from CD1a−CD14+precursors,22 we also compared the MLR-stimulating capacity of mature CD1a+CD14− and CD1a−CD14+ precursor-derived DCs from SP and DP HPC cultures. Day 5 sorted precursors were cultured as above for 5 more days under the standard condition plus IL-4, and CD40LT for the last 72 hours. On average, CD1a+CD14−precursor-derived DCs from DP HPC cultures stimulated the MLR 3-fold more efficiently than their CD1a−CD14+counterparts, both eliciting 3- to 6-fold stronger reactivity than either type of DC from SP HPC cultures (Figure 9B).
Comparison of the capacity of mature DC differentiated from SP or DP HPCs to stimulate the MLR.
(A) Immature bulk DCs sorted from day 8 standard condition cultures to which IL-4 was added from day 5, were cultured 3 more days in the presence of CD40LT to obtain mature CD83+ DCs, which were then added to allogeneic T lymphocytes for 6 days. (B) CD1a+CD14−or CD1a−CD14+ DC precursors sorted on day 5 from either SP or DP HPC cultures were cultured for 5 more days under the standard condition plus IL-4 and with CD40LT for the last 72 hours, before the mature CD83+ DCs were added to the MLR. CD1a+DC: DCs obtained from CD1a+CD14− precursors in SP or DP HPC cultures; CD14+DC: DCs obtained from CD1a−CD14+ precursors in SP or DP HPC cultures. Results are means ± SD of counts per minute (n = 4). Statistical significance of the differences between the MLR-stimulating capacity of the different types of DCs was determined by analysis of covariance.
This led us to examine the cytokine profile of allogeneic T lymphocytes cocultured with the different types of DCs. Only IFN-γ (range: 30-150 pg/mL) but not IL-4 or IL-10 were detected in day 3 to day 7 supernatants of these cultures, with no differences according to the DCs used. When T lymphocytes were recovered on coculture day 7 and restimulated with CD3 and CD28 mAbs, there were again no differences in IL-4 (35-180 pg/mL), IL-10 (400-1350 pg/mL), or IFN-γ (1750-6500 pg/mL) levels in supernatants. Thus, none of the DC populations tested here elicited polarized Thalpen (Th) reactivities.
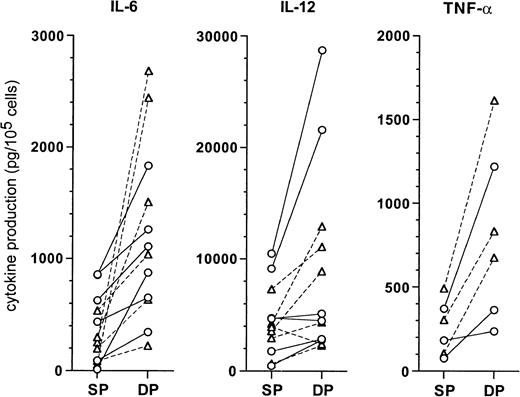
When we assessed cytokine production in culture supernatants of the DCs (Figure 10), both CD1a+CD14− and CD1a−CD14+ precursor-derived DCs originating from DP HPCs produced higher levels than SP HPC-derived DCs, for IL-6 (1360 ± 735 vs 375 ± 305 pg/105 cells;P = .004), IL-12 p40 (9950 ± 8525 vs 4740 ± 3150 pg/105 cells; P = .03), and TNF-α (825 ± 475 vs 255 ± 150 pg/105 cells;P = .015). IL-1RA production by DP HPC-derived and SP HPC-derived DCs was similar (7460 ± 4290 vs 5550 ± 3385 pg/105 cells; NS), whereas IL-1β, IL-10, IL-12 p70, and IL-15 were undetectable.
Comparison of cytokine levels produced by DC from SP or DP HPC cultures.
Supernatants of mature DCs, prepared as described in “Materials and methods,” were assessed by ELISA for the indicated cytokines. Each point indicates the supernatant of an individual DC culture. CD1a-DC (○): DCs differentiated from CD1a+CD14−precursors in SP or DP HPC cultures; CD14-DC (▵): DCs differentiated from CD1a−CD14+ precursors in SP or DP HPC cultures.
Thus, DP HPC-derived DCs display limitedly, albeit significantly, higher T-cell stimulatory and cytokine production capacities than their SP HPC-derived counterparts.
Discussion
Analysis of in vitro DC differentiation pathways from discrete HPC populations with defined developmental characteristics, eg, lymphoid or myeloid potential, represents an attractive strategy to compare DCs from different origins and, hence, to approach characterization of so-called lymphoid DCs. Because cord blood is rich in HPCs spanning from pluripotent to committed lineage-restricted populations, we examined CD34+ HPCs for markers of lymphoid or myeloid potential. Only CD45RA and CD7 appeared relevant in this respect in that they permitted to individualize 3 CD34+ HPC populations, defined as CD7+CD45RA−, SP CD7−CD45RA+, and DP CD7+CD45RA+. These populations differed as to the capacity to differentiate into NK cells, selected as marker of lymphoid potential. Unexpectedly, CD7+CD45RA−HPCs did not generate NK cells in cultures with SCF/IL-2/IL-7/IL-15, but they may in fact correspond to immature HPCs that require direct contacts with stromal cells to enter this pathway.47,49,53,54 Actually, only DP HPCs generated NK cells under these culture conditions, which indicates their lymphoid potential. In parallel, when cultured with SCF/FL/GM-CSF/TNF-α to promote differentiation into DCs,23,37,38 DP HPCs also displayed higher DC differentiation, though lower expansion capacity, than the other HPCs, especially SP HPCs.42,43 In line with these findings, cloning experiments demonstrated that DP HPCs indeed comprised bipotent NK/DC progenitors. From an ontogenic point of view, based on the observation that DP HPCs lack CD127, do not depend on IL-7 for survival, and require IL-15 to generate NK cells (data not shown), one may suggest that they could represent immediate upstream precursors of CD34+CD1a− thymocytes that also comprise bipotent NK/DC progenitors.34
Also, at variance with the thymic HPCs, cord blood DP HPCs differentiate into DCs via both CD1a+CD14− and CD1a−CD14+ precursors, which nonetheless display developmental characteristics that distinguish them from their SP HPC-derived counterparts. When cultures were conducted in the presence of M-CSF, about half of DP HPC-derived CD1a+CD14− DCs remained CD14−, whereas most SP HPC-derived cells acquired CD14, which indicates that only HPCs with lymphoid potential have the capacity to differentiate into DCs through unipotent CD1a+c-fms/CD115−precursors.20,34 Conversely, DCs that originated from SP HPCs derived mainly from c-fms/CD115+precursors,16 indicating that SP HPCs comprise myeloid-committed progenitors. Altogether, these findings indicate that the dichotomy between the CD1a+CD14− and CD1a−CD14+ DC differentiation pathways20-23 stems mainly at the HPC level. Because human CD11c−CD123hi plasmacytoid DC precursors express pre-TCRα,56 we are currently investigating their relationship with the CD1a+CD14−c-fms/CD115−differentiation pathway, but one cannot exclude that lymphoid HPCs may generate plasmacytoid DCs via yet another pathway. An unexpected finding was that, in contrast to SP HPC-derived CD1a−CD14+ precursors that need IL-4, TGF-β1, high doses of TNF-α, or CD40 ligation to differentiate into DCs, DP HPC-derived CD1a−CD14+ precursors acquired CD1a while losing CD14 under the standard culture condition. This is in line with the lack of proliferative response to M-CSF of the DP HPC progeny and indicates that DP HPC-derived CD1a−CD14+ precursors retain the capacity to differentiate into DCs. From an evolutionary point of view, DP HPC-derived CD1a−CD14+ precursors may therefore represent intermediates between unipotent CD1a+CD14−c-fms/CD115−20,34 and c-fms/CD115+16 DC precursors that originate from myeloid SP HPCs, the differentiation of which into DCs requires additional signals.57
In the last part of this report, we examined whether DCs that differentiate from DP or SP HPCs could differ regarding their phenotype and function. DCs from both DP and SP HPC cultures actually coexpressed CD11b and CD11c myeloid markers, whereas they differed regarding markers such as E-cadherin (which was low or undetectable in DCs from SP cultures), CD116, CD127, or CD123, but none of these was really discriminant. Confocal microscopy examination of cells cultured with IL-4 showed that the immature DC progeny of SP and DP HPCs differed as to expression of LC markers S100 and Lag; whereas DCs that originated from DP or from thymic CD34+CD1a− HPCs were mostly S100+ and could coexpress Lag, DCs derived from SP HPCs were essentially S100−Lag−. When TGF-β1 was added to cultures, all DCs became Laghiirrespective of their origin, though a higher proportion of DP HPC-derived DCs presented than typical BGs. Thus, at variance with myeloid SP HPCs, LCs do not require exogenous TGF-β1 to differentiate from DP HPCs.52,55 Finally, in line with a recent report,58 on CD40 ligation, the mature DCs of DP HPC origin produced more cytokines and stimulated allogeneic T lymphocytes more strongly than SP HPC-derived mature DCs, even though differences were only limited. Moreover, although CD1a+CD14− precursor-derived DCs from DP HPC cultures stimulated the MLR more efficiently than their CD1a−CD14+ counterparts, both elicited stronger reactivity than either type of DC from SP HPC cultures.
Altogether, our results provide evidence that the DCs that differentiate from cord blood DP CD7+CD45RA+HPCs represent an original population regarding their developmental pathways and function. It may thus be possible that these DCs are rather dedicated to adaptative immunity, whereas DCs of myeloid origin would be more involved as an interface between the innate and adaptative immune systems.16,30 59
Acknowledgments
We gratefully acknowledge the help of the following colleagues and companies: Pr. J. Milliez, service de Gynécologie-Obstétrique, hôpital Saint-Antoine (Paris, France) for the gift of cord blood samples; Dr E. Thomas (Immunex, Seattle, WA), for the gift of recombinant Flt3 ligand and CD40LT; Schering Plough (Kenilworth, NJ), for the gift of recombinant GM-CSF and IL-4; Amgen (Thousand Oaks, CA), for the gift of recombinant SCF; Drs L. J. Picker and P. R. Bergstresser (Southwestern Medical Center, Dallas, TX), for the gift of anti-CLA mAb HECA-452; Drs F. Furukawa (Hamamastu University School of Medicine, Handacho, Hamamastu, Japan), K. Yoneda, and S. Imamura (Faculty of Medicine, Kyoto, Japan), for the gift of the anti-Lag mAb; and Catherine Durieu (ESA 7087, hôpital Pitié-Salpêtrière, Paris, France) for cell sorting.
Supported by the Agence Nationale de Recherche contre le SIDA, the Association de Recherche contre le Cancer, the Comité de Paris de la Ligue Nationale contre le Cancer, and the Association pour la Recherche sur les Déficits Immunitaires Viro-Induits (Paris, France).
B.C. and S.C. contributed equally to this work.
The publication costs of this article were defrayed in part by page charge payment. Therefore, and solely to indicate this fact, this article is hereby marked “advertisement” in accordance with 18 U.S.C. section 1734.
References
Author notes
Bruno Canque, Laboratoire d'Immunologie, CERVI, hôpital de la Pitié-Salpêtrière, 83 Blvd de l'Hôpital, 75651 Paris Cedex 13, France; e-mail:b_canque@club-internet.fr.

![Fig. 8. Effect of M-CSF on SP (CD7−45RA+) and DP (CD7 + 45RA+) HPC growth and differentiation. / Cells from cultures under the standard condition, with (+) or without (−) M-CSF, were recovered on day 12, labeled, and analyzed as indicated in the legend of Figure 6. (A) Data (means of 3 experiments) are expressed as absolute labeled cell numbers ([percent labeled cells × cell number]/100) normalized relative to 1 × 10⁵ seeded HPCs; statistical significance of differences between the (+) and (−) conditions are indicated (upper panel). (B) Results of one experiment are shown as 2-color fluorescence plots of cells labeled with CD1a-FITC and CD14-PE mAbs; quadrants were set according to control antibody labeling.](https://ash.silverchair-cdn.com/ash/content_public/journal/blood/96/12/10.1182_blood.v96.12.3748/5/m_h82300402008.jpeg?Expires=1767714376&Signature=dRDZ98Jw65-lDHDofFYVLlWy6l5OZMka28K72AxqRh2t6SE3PAk-vji~Y5CK7yKHSj2Cr9KDRzPc1ookUdMXDFkJnR4-bjbdIv7QYakxGLQPPZc~~X~YXZ5uUEvmRwJQ7EurxCDPzhiF44SzPfAuSJYSFFhITw1YBbIXMOFEV-1zDAs-ceaGjvLPmep-1gywNz7HDMu2wzyDvvV3Zgqwjre8q4Sc6ZgAJ20bRwaPSnaHWV3V3CAV-Ohaorf8YvIzk6zku0bj4OY50nmbkNo0GUQRLusiAS8FPnQeP3kPvNj~i5qTOQ~HYphfK56TJLPNdnbGUgyrBCmdaUhD20NvfQ__&Key-Pair-Id=APKAIE5G5CRDK6RD3PGA)
This feature is available to Subscribers Only
Sign In or Create an Account Close Modal