Major T-cell receptor β chain variable region (TCRBV) repertoire perturbations are temporally associated with the down-regulation of viremia during primary human immunodeficiency virus (HIV) infection and with oligoclonal expansion and clonal exhaustion of HIV-specific cytotoxic T lymphocytes (CTLs). To determine whether initiation of antiretroviral therapy (ART) or highly active antiretroviral therapy (HAART) during primary infection influences the dynamics of T-cell–mediated immune responses, the TCRBV repertoire was analyzed by semiquantitative polymerase chain reaction in serial blood samples obtained from 11 untreated and 11 ART-treated patients. Repertoire variations were evaluated longitudinally. Stabilization of the TCRBV repertoire was more consistently observed in treated as compared with untreated patients. Furthermore, the extent and the rapidity of stabilization were significantly different in treated versus untreated patients. TCRBV repertoire stabilization was positively correlated with the slope of HIV viremia in the treated group, suggesting an association between repertoire stabilization and virologic response to treatment. To test whether stabilization was associated with variations in the clonal complexity of T-cell populations, T-cell receptor (TCR) heteroduplex mobility shift assays (HMAs) were performed on sequential samples from 4 HAART-treated subjects. Densitometric analysis of HMA profiles showed a reduction in the number of TCR clonotypes in most TCRBV families and a significant decrease in the total number of clonotypes following 7 months of HAART. Furthermore, a biphasic decline in HIV-specific but not heterologous CTL clones was observed. This indicates that ART leads to a global reduction of CD8+T-cell oligoclonality and significantly modulates the mobilization of HIV-specific CTL during primary infection.
Acute or primary infection with human immunodeficiency virus type 1 (HIV-1) is characterized by transient high-level viremia, which decreases significantly upon the emergence of the host virus–specific immune response.1,2 Particularly effective in the control of primary as well as chronic HIV-1 viremia is the cellular immune response mediated by HIV-specific CD8+cytotoxic T lymphocytes (CTLs).3-7 Important perturbations in the T-cell receptor (TCR) β chain variable region (TCRBV) repertoire are frequently observed in subjects undergoing primary HIV infection, consistent with the fact that HIV-specific CTL responses are composed largely of variable numbers of oligoclonally expanded CD8+ T-cell clones sharing common TCRBV determinants.8,9 The relative frequency and magnitude of these TCRBV repertoire perturbations have been correlated with the rate of HIV disease progression, further reinforcing the notion that host factors, including the qualitative nature of the CTL response, represent important determinants of clinical outcome.10,11CTL responses are unfortunately often tempered by viral escape mechanisms, such as mutation of CTL epitopes and down-regulation of cell-surface major histocompatibility complex class I molecules by HIV-infected cells.12-16 In addition, study of the TCR repertoire has revealed that a sizable proportion of HIV-specific CTL clones expanded during primary infection9 was deleted in a manner consistent with the occurrence of clonal exhaustion.17 18
In order to rapidly reduce circulating HIV levels, and to preserve host virus–specific CD4+ helper T-cell responses, it has become standard care to offer subjects with primary HIV infection the option of immediately initiating treatment with potent antiretroviral therapeutic combinations containing protease inhibitors, ie, highly active antiretroviral therapy (HAART).19-21 Initiation of HAART in chronic infection has been shown to induce rapid increases in CD4+ T-cell counts, rapid improvements in immune function, and a significant but incomplete normalization of the TCRBV repertoire in both CD4+ and CD8+ T cells.22-24 However, the effects of such a regimen on the dynamics, diversity, and persistence of emerging HIV-specific CTL responses have yet to be comprehensively studied. In the present study, semiquantitative polymerase chain reaction (qPCR) analysis was used to compare the perturbations in the TCRBV repertoire seen in the absence and/or presence of antiretroviral therapy in 22 HIV-infected subjects with a diagnosis of primary infection, 11 in the untreated and 11 in the treated group. The relative complexity of the T-cell subset was compared prior to and after initiation of HAART by means of TCR heteroduplex mobility shift assays (HMAs) and imaging densitometry. Finally, the relative representation of HIV-specific and heterologous CTL clones was studied longitudinally following treatment of primary HIV infection with HAART.
Materials and methods
We studied 23 subjects with primary HIV infection. All subjects were enrolled within 12 weeks of initial presentation with symptoms consistent with primary HIV infection and acute retroviral syndrome.1,2 The criteria used for the diagnosis of primary HIV infection were (1) subjects who were HIV-viremic (antigen-capture assay, Abbott Laboratories, Abbott Park, IL) but remained HIV-seronegative (Abbott enzyme-linked immunosorbent assay–negative, Western blot–negative, or indeterminate) and (2) HIV-seropositive individuals with a recent clinical history of primary HIV infection (within 12 weeks from the onset of symptoms), detectable antigenemia, and viremia greater than 50 000 HIV RNA copies per mL plasma (Amplicor assay, Roche Diagnostics, Indianapolis, IN, or NASBA, Organon-Teknika, Rome, Italy). In all cases, day 0 corresponds to the time of presentation with symptoms of primary HIV infection. Peripheral blood samples were obtained by venous puncture at regular intervals over a mean follow-up period of 170 days (range = 63 to 414 days). In 12 subjects, treatment with different regimens of antiretroviral drugs was readily initiated. These regimens consisted of (1) zidovudine (AZT) and didanosine (ddI) (n = 2); (2) AZT, 3TC, and indinavir (n = 7); and (3) AZT, lamivudine (3TC), and saquinavir (n = 3) (Table1). The untreated control group was composed of 11 subjects, all of whom have been previously described.8-10 Because of ethical concerns, study of untreated control subjects was performed retrospectively, with the use of serial cryopreserved samples collected prior to the advent of current treatment recommendations for primary HIV infection. All subjects were offered counseling and were required to provide full informed consent, in accordance with guidelines from the medical review board and/or ethics committee of all institutions concerned.
Description of patients with primary HIV-1 infection
| Patient . | Treatment . | Initial Viremia (RNA Copies)* . | Final Viremia (RNA Copies)† . |
|---|---|---|---|
| P1 | none | 216 415‡ | 17 322‡ |
| P6 | none | 2 617 358‡ | 65 938‡ |
| P8 | none | 1774‡ | 40 963‡ |
| P9 | none | 91 390‡ | 83 150‡ |
| P10 | none | — | — |
| P14 | none | — | — |
| P16 | none | 389 500‡ | 35 450‡ |
| P17 | none | — | — |
| P18 | none | 553 600‡ | 89 860‡ |
| P20 | none1-153 | 383 620‡ | 2850‡ |
| P24 | none | — | — |
| 101 | AZT/3TC/saquinavir | 75001-155 | < 4001-155 |
| 102 | AZT/3TC/saquinavir | 2 300 0001-155 | 32 0001-155 |
| 103 | AZT/3TC/saquinavir | 1 700 0001-155 | < 4001-155 |
| 104 | AZT/ddl | 62 4431-155 | 311-155 |
| 105 | AZT/ddl | 2 127 9761-155 | 1 6711-155 |
| 1155 | AZT/3TC/indinavir | 109 2701-154 | < 5001-154 |
| 1168 | AZT/3TC/indinavir | 128 8141-154 | < 5001-154 |
| 1188 | AZT/3TC/indinavir | 73 0741-154 | < 5001-154 |
| 1166 | AZT/3TC/indinavir | 206 6521-154 | < 5001-154 |
| 1192 | AZT/3TC/indinavir | 67 8621-154 | < 5001-154 |
| 1196 | AZT/3TC/indinavir | 38 9001-154 | < 5001-154 |
| 0407# | AZT/3TC/indinavir | 15 1051-160 | < 4001-160 |
Blank cells indicate not determined.
Tested on the time point closest to clinical presentation.
Tested on the time point closest to the end of TCRBV repertoire follow-up.
Determined by means of quantitative-competitive PCR.
Treatment with AZT/3TC/ddl initiated after day 150.
Determined by means of NASBA.
Determined by means of Chiron bDNA assay.
#Not included in TCRBV repertoire follow-up.
Determined by means of Roche HIV-1 RNA RT-PCR Monitor.
Peripheral blood mononuclear cells (PBMCs) were isolated from venous blood samples by Ficoll-Hypaque density gradient centrifugation. Cell samples were then frozen at 5 to 10 × 106 cells per mL in 40% vol/vol fetal bovine serum (Gibco-Life Technologies, Basel, Switzerland) and 10% vol/vol dimethyl sulfoxyde (Sigma, St Louis, MO), prior to nucleic acid extraction. In some cases, cell pellets were solubilized before being frozen in 500 μL of 0.5% wt/vol N-lauroyl sarcosine, 25 mmol/L sodium citrate, pH 7, and 4 mol/L guanidine thiocyanate (Sigma).
The TCRBV repertoire was analyzed in sequential unfractionated PBMC samples collected at different time points after the onset of symptoms, with the use of qPCR assay, as previously described.25,26Briefly, RNA was extracted from 2 to 3 × 10⁶ frozen PBMCs with the use of Ultraspec RNA (Biotecx Laboratories, Houston, TX) and were reverse transcribed in the presence of p(dN)6 (20 μg per mL), 60 U avian myeloblastosis virus reverse transcriptase (Pharmacia, Uppsala, Sweden), 40 U RNasin (Promega, Madison, WI), and 1 mmol/L deoxynucleotides triphosphates. TCRBV polymerase chain reaction (PCR) analysis used a panel of 5′ TCRBV-specific primers and a common 3′ T cell receptor β chain constant region (TCRBC) primer. In each PCR reaction, 5′ and 3′ T cell receptor α chain constant region (TCRAC) primers were included as internal amplification controls. Sequences of TCRBV-specific and control oligonucleotides have been reported elsewhere.25 To monitor the migration of PCR products, 3′ TCRBC and 3′ TCRAC primers were end-labeled with γ-[32P] adenosine triphosphate (ATP) (New England Nuclear, Boston, MA) with the use of T4 polynucleotide kinase (Boehringer-Mannheim, Rotkreuz, Switzerland). PCR products were resolved on 10% polyacrylamide gels containing 7 mol/L urea (Sequagel, National Diagnostics, Atlanta, GA). Radioactive signals were quantitated by means of an InstantImager (Packard Instrument, Donners Grove, IL) and real-time volume integration.
CD8+ T cells were purified by flow cytometry with the use of phycoerythrin-conjugated anti-CD8 monoclonal antibody (PharMingen, San Diego, CA) and were directly seeded (1 to 25 cells per well) into 96-well plates containing 50 000 irradiated allogeneic feeder cells, as described.9 Cells were cultured in Roswell Park Memorial Institute (RPMI) 1640 medium supplemented with 20% fetal bovine serum (Gibco-Life Technologies), 1 μg per mL phytohemagglutinin (Sigma), and 40 U per mL interleukin-2 (Boehringer-Mannheim). The CTL activity of proliferating micropopulations was tested by standard51Cr-release assay, with the use of autologous Epstein-Barr virus–transformed B lymphoblastoid cell lines infected with recombinant vaccinia viruses encoding specific HIV-1 proteins as targets.8,9 Vaccinia isolates vvTG 3167 (HIV-1 Pol), vvTG 4113 (HIV-1 Rev), vvTG 3196 (HIV-1 Tat), vvTG 1147 (HIV-1 Nef), vvTG 1132 (HIV-1 gp120), vvTG 1144 (HIV-1 Gag), vvTG 9-1 (HIV-1 Env), and vvTG 186P (Escherichia coli β-gal negative control) were kindly provided by Transgene SA (Strasbourg, France). The clonality of HIV-specific and heterologous micropopulations was assessed by cloning the TCR β chains expressed by the CTL clones into pBluescript KS+ (Stratagene Cloning Systems, La Jolla, CA) and dideoxy-termination sequencing of the third complementarity-determining region (CDR3), as described.9CDR3 sequences were used to design clonotype-specific oligonucleotide probes (see below).
Complementary DNA (cDNA) samples from sequential time points were amplified with the use of a panel of TCRBV-specific primers, as described.27,28 Amplification efficacy and uniformity of yield were then assessed by agarose gel electrophoresis. TCRBV-specific PCR products were mixed with 400 ng of monomorphic extended carrier DNAs obtained by amplification of corresponding TCRBV segments cloned into plasmid vectors, and were denatured and reannealed slowly, as described.28 Products of this reaction were then migrated on 8% nondenaturing polyacrylamide gels (18 hours at 4° in a Bio-RAD Protean II Xi cell; Bio-RAD Laboratories, Hercules, CA) and were blotted onto nylon membranes (Hybond N+, Amersham-Pharmacia Biotech, Dubendorf, Switzerland) by capillary transfer. Filters were hybridized with γ-[32P]ATP end-labeled sense and antisense oligonucleotides complementary to the extended part of the carrier DNAs but not to the TCRBV-specific PCR products, in 6 × SSC, 1% bovine lacto-transfer technique optimizer (BLOTTO), 0.1% sodium dodecyl sulfate (SDS), and 5 mmol/L EDTA at 37°C.28 For heteroduplex tracking of specific TCR β chain clonotypes, oligonucleotide probes complementary to the CDR3 region of HIV-specific and heterologous CTL clones were used in an identical manner. Clonotype-specific probes used were 3A11div (5′-ACC CTC AGG GGC GGT GTA-3′), 6G2div (5′-TTG TGG TCG GGG GGG TCC TA-3′), 3B12div (5′-AGC CAA ACA GAG GGG CTG TAC-3′), and 12.5B10div (5′-CCG TGG ACA GGG GGC TCG TAT-3′). Filters were then washed twice in 6 × SSC, 0.1% SDS, for 30 minutes at 37°C and were exposed to BioMax MR film (Kodak, Rochester, NY). Autoradiograms were scanned with a Bio-RAD Gel Doc 1000 imaging densitometer equipped with a UV/white light conversion screen. Densitometric profile analysis was performed with the Molecular Analyst software package (Bio-RAD Laboratories), with the use of a 3-mm–wide rectangular averaging window and default automated peak detection settings (1% of total area).
TCRBV repertoire data were transformed into point-to-point delta scores (Δ), which represent the summation of absolute differences in the relative expression levels of each individual TCRBV family between 2 consecutive time points.29 Δ is therefore an index of global repertoire variation between 2 time points, the value of Δ being proportional to the extent of repertoire variations.29 The slopes of Δ over time were calculated and were compared among different subjects with the use of the Student t test, as the distribution of values did not significantly deviate from the normal (P = .55, Kolmogorov-Smirnov test). Correlations between the slope of Δ over time and the slope of viremia levels over time were determined by means of linear regression analysis.
Results
TCRBV repertoire analysis in untreated subjects during primary HIV infection
qPCR was used to analyze the TCRBV repertoire in serial samples of total PBMCs from 11 subjects undergoing primary HIV infection, who were studied prior to and after initiation of treatment with various regimens of antiretroviral therapy (Table 1). This method can reproducibly quantitate differences in the expression levels of 24 TCRBV families.25,26 Longitudinal analysis of TCR β chain repertoire perturbations was performed with the use of Δ scores, which represent the sum of absolute differences between the levels of expression of individual TCRBV families between consecutive time points. Therefore, Δ reflects global repertoire variations, and larger Δ values are associated with larger repertoire variations, whereas low Δ values indicate relatively small variations.29 Thus, in a subject in whom several sequential time points are tested, a negative slope of Δ over time indicates progressive repertoire stabilization, whereas a positive slope is consistent with progressive repertoire destabilization.
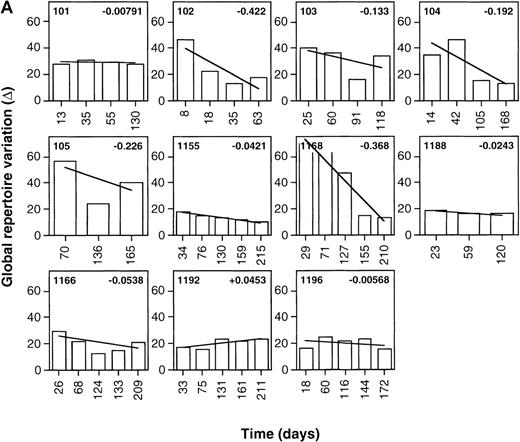
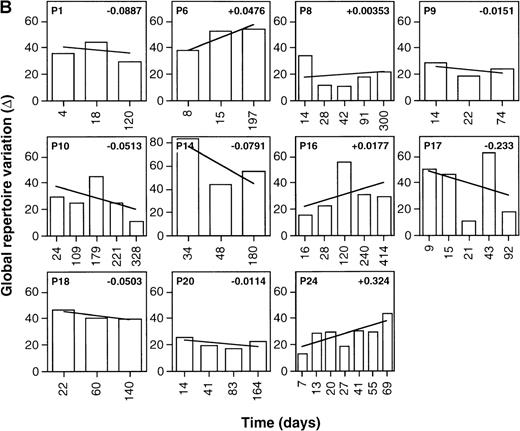
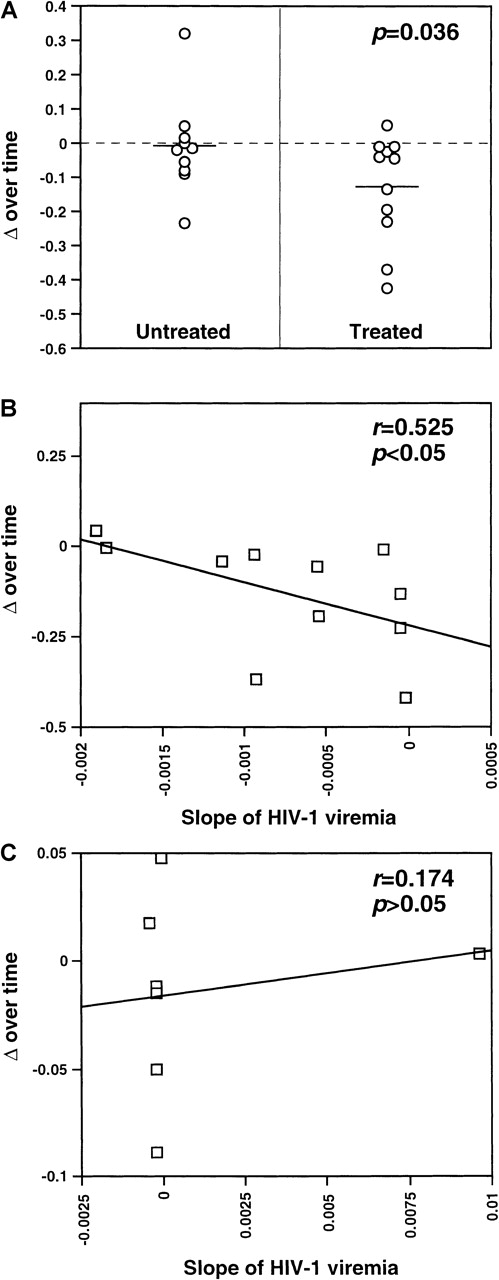
As shown in Figure 1, Δ values calculated were frequently greater than 60, reflecting relatively large point-to-point variations in the global levels of expression of the various TCR β chain familes.29 This is consistent with the previously reported presence of multiple high-level perturbations of the TCRBV repertoire in these patients.8-10 Of the treated patients, 90.9% (10 of 11) showed negative slopes of Δ over time (mean Δ slope = −0.130), indicating the occurence of progressive repertoire stabilization in these subjects (Figure1A). While negative slopes of Δ over time were seen in 63.6% (7 of 11) of the untreated patients, their Δ slopes were significantly smaller than for the treated patients (mean Δ slope = −0.0124,P = .036, Student t test) (Figure 1B). This indicates that TCR repertoire stabilization occurred more rapidly in treated than untreated patients (Figure2A). Of note, the values of Δ slopes were positively correlated with the slopes of HIV-1 viremia in treated patients (n = 11, r = 0.525,P < .05) but not in untreated subjects for whom viremia data were available (n = 7, r = 0.174, P > .05) (Table 1, Figure 2B and 2C). The mean follow-up times of patients in the 2 groups were not significantly different (161.9 days in the treated group compared with 188.9 days in the control arm;P =.48, t test). As well, the mean number of samples/time points tested per patient in the 2 groups did not significantly differ (5.27 in the treated group compared with 5.18 in the control arm; P = .85, Student t test).
Stabilization of the TCRBV repertoire following initiation of antiretroviral therapy during primary HIV infection.
Levels of TCRBV expression determined by qPCR in 24 TCRBV families were transformed into Δ scores that represent the overall change in TCRBV repertoire between 2 consecutive time points. The linear regression line of Δ over time was drawn, and the value of the slope appears in the upper right corner. (A) Patients treated with antiretroviral therapy or HAART during primary HIV-1 infection. (B) Untreated primary infection patients.
Stabilization of the TCRBV repertoire in patients treated with antiretroviral therapy during primary HIV-1 infection.
The slope of the regression line of Δ over time was calculated as in Figure 1. HIV-1 viremia values were obtained by means of quantitative-competitive PCR, NASBA (Organon-Teknika), or branched DNA assay (Chiron, Emeryville CA), as described in footnotes to Table 1. (A) TCRBV repertoire stabilization in untreated subjects and patients treated with HAART during primary infection. The mean Δ slope in each subgroup is indicated by solid lines. (B) Correlation between TCRBV repertoire stabilization and the slope of HIV-1 viremia in untreated subjects during primary infection. Significance of the correlation was tested by means of linear regression analysis. (C) Correlation between TCRBV repertoire stabilization and the slope of HIV-1 viremia in subjects treated with antiretroviral therapy during primary infection. Significance of the correlation was tested by means of linear regression analysis.
Variations in T-cell oligoclonality during HAART treatment of primary HIV infection
The fact that TCRBV-specific T-cell perturbations observed in subjects with primary HIV infection result primarily from oligoclonal expansion and clonal deletion of CD8+ HIV-specific CTL8,9 indicates that that the clonality of the initial HIV-specific CTL response can affect the clinical outcome, possibly by influencing the persistence of the CTL response.10Therefore, in order to test whether HAART-associated TCRBV repertoire stabilization was associated with decreased oligoclonality (ie, increased complexity) of T-cell populations, TCR HMA was performed on sequential samples from 4 primary infection patients (1166, 1168, 1155, and 1192), prior to and after initiation of HAART (zidovudine, lamivudine, and indinavir). Since distinct TCRBV clonotypes segregate as separate bands on HMA gels, this method allows simultaneous determination of the levels of oligoclonality in all TCRBV families and provides a direct assessment of the longitudinal changes in the clonal composition of the T-cell populations. HMA is a practical alternative to DNA sequencing–based diversity analysis, in which large numbers of TCRBV molecular clones need to be examined in order to obtain a comprehensive picture of the TCR repertoire oligoclonality.8,9,30 HMA was performed on total PBMC samples because it was shown that most if not all of the detectable oligoclonality observed during primary HIV infection was limited to the CD8+ subset,8 9 thereby limiting the usefulness of T-cell subset–specific TCR HMA typing. Densitometric profile analysis, combined with automated peak detection, was used to provide an unbiased estimate of the number of different heteroduplexes in each of the lanes of the HMA gels.
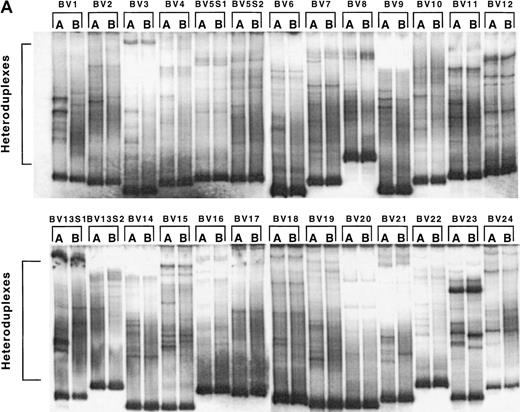
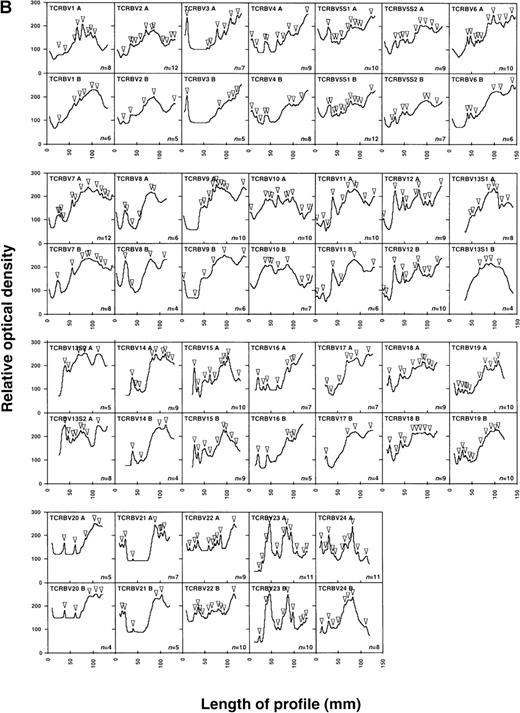
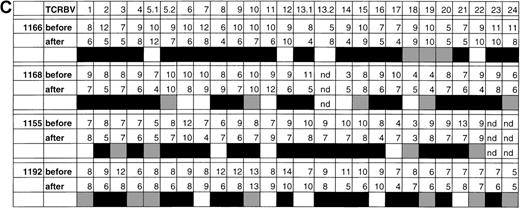
In patient 1166, profile analysis revealed the presence, in each of 26 TCRBV families and subfamilies tested, of between 4 to 12 different TCRBV heterocomplexes, corresponding to discrete heteroduplex bands on the HMA gels (Figure 3A and 3B). This value has been previously shown to be directly proportional to the actual number of expanded TCRBV clonotypes present within a clonally heterogenous TCRBV subset, and therefore represents an index of the level of clonality of a complex T-cell population.28After 7 months of HAART, changes in clonality profiles were readily detectable in all of the 4 patients in most of the TCRBV subsets (Figure 3A and 3B, data not shown). Densitometry and automated peak detection revealed that patients 1166, 1168, 1155, and 1192 all exhibited a reduced number of recognizable clonotypes per TCRBV family in 19 of 26, 16 of 25, 16 of 24, and 14 of 26 TCRBV families tested, respectively (Figure 3B and 3C, data not shown). As a consequence of these reductions, there was a statistically significant decrease in both patients in the total number of distinguishable clonotypes following 7 months on HAART (230 before versus 181 after therapy in patient 1166, P = .0012, Student t test; 201 before versus 171 after therapy in patient 1168, P = .023; 194 before versus 163 after therapy in patient 1155, P = .015; and 227 versus 192 after therapy in patient 1192, P = .015) (Figure 3C). Although a global decrease in oligoclonality was observed, the number of detectable clonotypes was actually augmented in a few TCRBV families in all subjects (TCRBV5, 12, 1352, and 22 in patient 1166; TCRBV8, 9, 11, 14 and 18 in patient 1168; TCRBV1, 8, 11 and 17 in patient 1155; TCRBV7, 11, 1351, 16 and 21 in patient 1192), suggesting that the overall reduction in oligoclonality was not incompatible with the concurrent emergence of newly expanded T-cell clones (Figure 3C). Finally, the appearance of a homogenously smeared background in the lanes of HMA gels following 7 months of treatment further indicated that the TCRBV repertoire was becoming progressively more polyclonal (Figure 3A and3B). Taken together, these results are consistent with a notable reduction in T-cell oligoclonality following 7 months of treatment with HAART in these patients.
Changes in the levels of T-cell oligoclonality following induction of HAART during primary HIV infection.
The level of oligoclonality was determined for each TCRBV family by using HMA, as described.28 (A) HMA gel hybridized with Cβb- and Cβc-carrier–specific probes showing variations in heteroduplex patterns for 26 TCRBV families and subfamilies in patient 1166, prior to and after initiation of HAART. (B) Computerized densitometric analysis of the HMA autoradiogram shown in panel A. Triangles indicate discrete TCRBV heterocomplexes detected over the HMA profiles with the use of automated peak discrimination as described in “Materials and methods.” TCRBV heterocomplex patterns prior to (TCRBV A) and after (TCRBV B) therapy for each β chain V-region family from patient 1166 are shown. The actual number of peaks detected appears in the bottom right corner. (C) Summary of clonality analysis in patients 1166, 1168, 1155, and 1192. Numbers of detectable clonotypes are shown prior to and after the introduction of HAART, while the decrease (closed boxes), stability (shaded boxes), or increase (open boxes) in the levels of oligoclonality of respective TCRBV families is indicated; nd indicates not done. Nomenclature of TCRBV families is according to Arden et al.31
Decay of HIV-specific CTL clones following HAART treatment of primary HIV infection
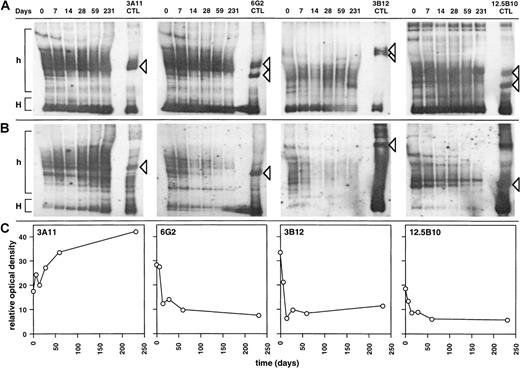
To evaluate the effects of HAART on the persistence of HIV-specific CTLs, HIV-specific CD8+ CTL populations were derived from patient 0407 by limiting dilution. Populations 6G2, 3B12, and 12.5B10 displayed significant CTL activity, directed against autologous targets infected with vaccinia virus recombinants expressing either HIV-1 gp120 or full-length HIV-1 Env (Figure 4A). In contrast, population 3A11 did not display significant CTL activity against targets expressing the HIV-1 Gag, Pol, Env, Tat, Rev, and Nef gene products (Figure 4A). To assess the clonality of these populations, the CDR3 region from the expressed TCR β chain was PCR-amplified and subcloned, and its DNA sequence was determined. Unique functional TCR β chains were detected in 3A11, 6G2, 3B12, and 12.5B10, indicating that these populations were distinct and largely monoclonal (Figure 4B). Probes complementary to the CDR3 region of the TCR β chain expressed by these clonal populations were hybridized to HMA gels, a method that allows the detection of 1:105 to 106 cells with specific clonotypes27,28 (Figure5A and B). The relative representation of each CTL clonal population was then determined by densitometric profile analysis (Figure 5C). While the representation of non–HIV-specific T-cell clone 3A11 increased during the study period, that of the 3 distinct HIV-Env–specific CTL clones sharply declined during 7 months of HAART (Figure 5B and C). The homogeneous profiles obtained by using carrier-specific probes indicate that these changes did not result from quantitative differences in amplification efficiency or gel loading (Figure 5A). The kinetics of decline were clearly biphasic, with an initial t1/2 of 14.5, 8.82, and 13.0 days for clones 6G2, 3B12, and 12.5B10, respectively, during the first 2 weeks (mean = 12.1 days). This was followed by a secondary decay phase with a t1/2 of 273 and 313 days for clones 6G2 and 12.5B10, respectively (mean = 293 days), while clone 3B12 did not exhibit a secondary decay phase (positive slope) (Figure 5B and C). In contrast to the rapid and total disappearance observed during clonal exhaustion,9 all CTL clones remained detectable at the end of the study period.
Cytotoxic activity of HIV-specific and heterologous CTL clones derived from patient 0407 during primary HIV infection.
(A) CTL activity of T-cell micropopulations derived by limiting dilution was tested against autologous targets infected with a panel of recombinant vaccinia viruses expressing HIV-1 proteins. The significance threshold was set at 10% specific cytolytic activity. (B) DNA sequence of the CDR3 (V[D]J) region of the TCR β chain from the 4 CTL clones shown in A. The sequences used to design clonotype-specific probes are boxed. Nomenclature of TCRBV families is according to Arden et al.31
Kinetics of representation of HIV-specific and heterologous CTL clones in patient 0407 following treatment of primary HIV infection with HAART.
Sequential cDNA samples from patient 0407 were amplified with the use of cognate TCRBV-specific primers, and fractionated on HMA gels, with cDNAs derived from CTL clones used as controls. These were probed with (A) sense and antisense carrier-specific and (B) clonotype-specific probes, as described in “Materials and methods.” Homoduplex (H) and heteroduplex (h) regions are shown. Heterocomplexes corresponding to specific clonotypes are indicated by arrows. (C) Computerized densitometric analysis of the HMA autoradiograms shown in panel B. The y-axis corresponds to the area under the densitometric profile measured over the heteroduplex region (h) shown in panel B.
Discussion
It has been previously demonstrated that (1) oligoclonal expansions of CD8+ T cells were commonly observed in HIV-infected patients during primary infection8; (2) a large part of the HIV-specific CTL activity measured during primary HIV infection was mediated by cells within these expanded populations8,9; (3) essentially all of the TCRBV repertoire variations seen in primary HIV infection involved cells of the CD8+ subset8-10(G.P., unpublished data, 1996); and (4) different patterns of TCR repertoire perturbationswere associated with distinct clinical outcomes, ie, slow versus rapid rates of CD4+T-cell decline and different levels of viremia at a 1-year endpoint.10 For these reasons, it was extremely important to define whether initiation of antiretroviral therapy, and especially HAART, during primary HIV infection influenced the patterns of TCRBV repertoire perturbations usually associated with primary HIV-specific CTL responses.
Our results have shown that a number of untreated primary infection subjects exhibited TCRBV repertoire stabilization during primary infection and after the transition to the chronic phase of the disease. However, it is clear that primary infection patients treated with antiretroviral therapy exhibited a more rapid rate of TCRBV repertoire stabilization than untreated subjects, as indicated by a significantly smaller slope of Δ over time in these patients. Most interestingly, values of the slope of Δ were significantly correlated with the slope of HIV-1 viremia in 11 patients treated with antiretroviral therapy, suggesting the existence of a direct relationship between repertoire stabilization and virologic response to treatment. It is conceivable that TCRBV stabilization occurred as an indirect result of antiretroviral therapy–induced reduction in viral replication and circulating viral load, leading to a decline in the levels of mobilization of CD8+ T cells and HIV-specific CTL in particular. This is consistent with reported decreases in CD8+ T-cell activation markers and with the progressive decline in the frequency of HIV-1 peptide-specific CTL observed following introduction of HAART during the course of chronic HIV infection.22,32 33
A reduction in the number of HMA bands, as detected by imaging densitometry, was also observed in 4 patients in whom primary HIV infection was treated with HAART. As the large majority of clonotypes detected with HMA in total PBMC represent clonal expansions of CD8+ T cells,34-36 this reduction is consistent with a partial but progressive transition from oligoclonality to polyclonality of the CD8+ T-cell subset during the 7 months spanning the 2 time points. This reduction was effected in a broad range of TCRBV families, suggesting that it may involve not only HIV-specific CTLs but also bystander-activated T cells. These data are in accordance with the reduced oligoclonality of the CD8+TCRBV repertoire previously reported in chronic HIV infection following introduction of antiretroviral therapy.23 24 The appearance of new discrete bands on heteroduplex gels may reflect emerging CD8+ T-cell–mediated immune responses of undefined antigeneic specificity. These new bands may also result from the oligoclonal expansion of recently produced CD4+ T cells and may therefore represent additional evidence of the resumption of CD4+ T-cell production following introduction of antiretroviral therapy.
Finally, when the representation of CTL clones was tested in a longitudinal manner, a decline in the levels of HIV-specific CTL clones, but not in the level of a non–HIV-specific T-cell clone, was observed in response to suppression of HIV viremia. This decline was biphasic, with a steep decrease in CTL representation in the first 2 weeks following introduction of HAART and a slower decline thereafter. This may be related to different kinetics of disappearance of HIV-specific CTL precursors and effectors, as previously suggested.32,33 It is important to note that despite a continuing decline, the 3 HIV-specific CTL clones analyzed were still detectable at the end of the follow-up period, suggesting that viral suppression may have prevented the occurrence of clonal exhaustion of HIV-specific CTL.9
In conclusion, the results presented in this report indicate that antiretroviral therapy significantly modulates the pattern of TCRBV repertoire mobilization during primary infection and leads to a substantial reduction in global CD8+ T-cell oligoclonality. The rapid stabilization of the TCR repertoire observed in treated subjects may reflect the transition of a larger proportion of CTL effectors into memory cells and may delay or prevent clonal exhaustion of the HIV-specific CTL clones that have become largely expanded during primary infection.9 Furthermore, similar to what occurs in chronic infection, the global reduction of CD8+ T-cell oligoclonality induced by HAART during primary infection is associated with a progressive reduction in the frequency ofcirculating HIV-specific CTL precursors and/or effectors. Therefore, it is conceivable that potentiation and long-term maintenance of a diversified HIV-specific CTL repertoire during antiretroviral treatment may require the development of therapeutic vaccine strategies to achieve effective immune-mediated control of HIV replication.37 38
Acknowledgments
The authors wish to thank D. Lee and L. Xie for their assistance with data management, and P. Dellabona and A. S. Fauci for useful discussion and critical reading of the manuscript.
Supported in part by the Santo-Suarez Foundation, the Swiss National Science Foundation Grant 31-46032.95, and the National Institutes of Health Grant NIH/1 UO1 AI41535-01.
H.S. is a Fellow of the Fonds de la recherche en santé du Québec. G.P. is a scholar of the Giorgi-Cavaglieri Foundation.
Reprints:Giuseppe Pantaleo, Laboratory of AIDS Immunopathogenesis, CHUV-Hôpital de Beaumont, 29 rue Beaumont, 1011 Lausanne, Switzerland; e-mail: giuseppe.pantaleo@chuv.hospvd.ch.
The publication costs of this article were defrayed in part by page charge payment. Therefore, and solely to indicate this fact, this article is hereby marked “advertisement” in accordance with 18 U.S.C. section 1734.

![Fig. 4. Cytotoxic activity of HIV-specific and heterologous CTL clones derived from patient 0407 during primary HIV infection. / (A) CTL activity of T-cell micropopulations derived by limiting dilution was tested against autologous targets infected with a panel of recombinant vaccinia viruses expressing HIV-1 proteins. The significance threshold was set at 10% specific cytolytic activity. (B) DNA sequence of the CDR3 (V[D]J) region of the TCR β chain from the 4 CTL clones shown in A. The sequences used to design clonotype-specific probes are boxed. Nomenclature of TCRBV families is according to Arden et al.31](https://ash.silverchair-cdn.com/ash/content_public/journal/blood/95/5/10.1182_blood.v95.5.1743.005k14_1743_1751/6/m_bloo00514004x.jpeg?Expires=1767707055&Signature=cvlgDsdIv0h5VpZHgryvR4z5POciOJPzDVHt38qbctgcsXs5tJIB1ZGeeTK47T7URuErCPxbprJrTjm2WCcKh1uKZml-VP6sk~EPd-26nRpdplEZnb3SgjOXs5qKy02Wh2aeAoabvPjq40HhCAjZwTpvuFubjdiqzCrX41-PEOejTHDQmtx50rY52EIFJqLtEqR~eo91FGmZs5iR~bgvuAZp8Dqq6hl-z23bQl0T-mBg2KAqWp2xA4g5B4lEP9BfYaNNU7HkZMKgXu2Jv9fflWLvBomMNp3MqQrroxhdZqrBIJiolJDu7fbtHJB9PcXL47iZ7oNcnMURJQOmxOy4Og__&Key-Pair-Id=APKAIE5G5CRDK6RD3PGA)
This feature is available to Subscribers Only
Sign In or Create an Account Close Modal