Abstract
T-cell reconstitution after bone marrow transplant (BMT) is characterized, for at least 1 year, by the expansion of populations of T cells with a primed/memory phenotype and by reverse CD4/CD8 proportions. T lymphocytes from 26 BMT patients (mostly adults) were obtained at various times after transplantation (from 45 to ≥730 days) and were tested for susceptibility to spontaneous apoptosis and anti-Fas triggered apoptosis in vitro. Substantial proportions of CD4+ and CD8+ cells generated during the first year after transplantation, but not by day 730, exhibited in these assays decreased mitochondrial membrane potential (▵Ψm) and apoptotic DNA fragmentation. The apoptotic phenotype tended to disappear late in the follow-up period, when substantial absolute numbers of naive (CD45RA+/CD62-L+) T cells had repopulated the peripheral blood compartment of the BMT patients. The rate of spontaneous cell death in vitro was significantly correlated with lower levels of ex vivo Bcl-2 protein, as assessed by cytofluorometry and Western blot analysis. In contrast, the levels of Bax protein remained unchanged, resulting in dysregulated Bcl-2/Bax ratios. Cell death primarily concerned the expanded CD8+/CD45R0+ subpopulation, although CD45R0− subpopulations were also involved, albeit to a lesser extent. These results show that the T-cell regeneration/expansion occurring after BMT is accompanied by decreased levels of Bcl-2 and susceptibility to apoptosis.
IMMUNE RECONSTITUTION after allogeneic bone marrow transplantation (BMT) is typified by the slow regeneration of CD4+ T cells and the faster regeneration of CD8+ T cells.1 There are also typically functional abnormalities that persist for several years after the quantitative recovery of T cells, whether the patient receives autologous or allogeneic bone marrow.2 Most of the newly generated CD4+ T cells of adult patients carry the CD45RO+, CD29high, and CD11ahighactivation/memory markers,3 and most CD8+ T cells have the CD57+/CD28−phenotype,4 a characteristic of T cells that have undergone many rounds of replication.5 Total CD4+ counts and the ability to produce naive (CD45RA+/L-selectin+) T lymphocytes decrease with increasing age, as shown for healthy BMT recipients examined 1 year after transplantation.3 Studies have been performed with murine models involving the injection of small amounts of mature T cells together with bone marrow cells into thymectomized and lethally irradiated mice. In these models, T-cell regeneration occurs primarily through the expansion of the injected T-cell population.6,7Such studies suggest that in adult BMT patients (with aged and irradiated thymus), the newly regenerated T-cell populations largely result from the thymus-independent expansion of the population of mature T cells contaminating the grafted bone marrow.6,8The peripheral expansion of donor T cells may be driven by the antigenic environment of the host, including histocompatibility antigens9 and viral antigens,10,11 restricting the diversity of the regenerated T-cell repertoire,9 and occasionally leading to oligoclonality.12 It may also be driven by an antigen-independent, homeostatic process controlling the size of the T-cell compartment13 or, for memory-phenotype CD8+ T cells, by interleukin-15 (IL-15) stimulation alone.14
During the early phase of lymphocyte reconstitution after BMT, most peripheral CD4+ and CD8+ T cells show enhanced spontaneous apoptosis in vitro.15 The molecular mechanisms underlying this phenomenon are unknown. In other clinical situations, the amount of the anti-apoptotic bcl-2 gene product, known to protect cells against a variety of apoptotic stimuli,16critically regulates the survival of ex vivo T lymphocytes. Thus, activated peripheral CD45RO+ T cells from patients suffering from acute Epstein-Barr virus (EBV) and varicella zoster virus (VZV) infections show enhanced spontaneous apoptosis in short-term cultures; this is significantly correlated with low Bcl-2 levels.17 Peripheral T lymphocytes from human immunodeficiency virus (HIV)-infected patients also undergo faster spontaneous apoptosis in vitro than lymphocytes from normal individuals, presumably reflecting the in vivo destruction of lymphocytes in acquired immune deficiency syndrome (AIDS).18,19 At least for the CD8+ T lymphocytes of HIV-infected patients, apoptosis mostly affects activated (HLA-DR+) cells with decreased levels of Bcl-2 protein.20 This is also the case for peripheral blood HLA-DR+ T cells from multiple myeloma patients.21 An inverse relationship has been identified between the amount of Bcl-2 protein and the expression of the pro-apoptotic Fas/CD95 receptor in virus-infected cells20,21 and in normal peripheral T lymphocytes subjected to in vitro stimulation with mitogens, thereby rendered susceptible to both accelerated spontaneous death and CD95-mediated apoptosis.22 23
In this study, we examined, in a long follow-up period (from 45 days to ∼730 days after transplantation), the rate of spontaneous and anti–Fas-triggered apoptosis manifested in vitro by circulating CD4+ and CD8+ T cells from BMT patients. We extended our analysis to the T-cell subsets defined by classical markers of naive and memory T cells. We evaluated the amount of Bcl-2 in ex vivo T cells to explore its possible relationship with the rate of spontaneous apoptosis in vitro.
PATIENTS, MATERIALS, AND METHODS
Patients and peripheral blood lymphocytes (PBL).
Twenty-six patients treated for hematological diseases (23 hematological malignancies, 2 sickle anemia, and 1 aplastic anemia) were included in this study. The patients had been subjected to a conditioning regimen consisting of total body irradiation or high doses of busulfan (or cyclophosphamide and total body irradiation for 1 patient). They had received a transplant with bone marrow from HLA-identical sibling donors at the BMT unit of Hôpital Henri Mondor. Prophylaxis of graft-versus-host disease (GVHD) consisted of an association of cyclosporin-A and methotrexate. Six patients, suffering from acute GVHD shortly after transplantation were given prednisone (2 mg/kg/d) for approximately 2 months. No symptomatic GVHD requiring treatment was observed in any patient from day 180 after transplantation onward. Twenty-one of the patients were 23 to 57 years old, 2 were 17 years old, and the other 3 were 13 to 14 years old (mean age, 36 years). Peripheral blood mononuclear cells (PBMC) from patients who received transplant were sequentially obtained and frozen on days 45, 90, 180, 365, and eventually 730 to 740 after BMT. PBMC from the corresponding bone marrow donors were used as control cells.
Monoclonal antibodies (MoAb) and reagents used in functional assays.
The agonistic anti-Fas MoAb CH-11 immunoglobin—(IgM) was purchased from DIACLONE (Besançon, France). The antagonistic anti-Fas MoAb M3 (IgG1) and the control anti-Fas MoAb M33 (an IgG1 that is neither agonistic or antagonistic) were kindly given by Dr D. Lynch (Immunex Research and Development Corporation, Seattle, WA). The anti-CD3 MoAb OKT3 (IgG2a), was obtained from the American Type Culture Collection (Rockville, MD). Recombinant IL-2 was given by Roussel Uclaf (Romainville, France), and IL-15 was kindly given by Dr B. Azzarone (ICIG, Villejuif, France). The matrix metalloproteinase inhibitor KB8301 was purchased from Becton Dickinson (Le Pont de Claix, France).
Phenotypic analysis.
CD45RO, CD45RA, HLA-DR, CD57, and CD95 expression on CD4+and CD8+ T lymphocytes were analyzed by 3-color immunofluorescence using Quantum RedTM conjugated anti-CD4 and anti-CD8 from Sigma (St Quentin Fallavier, France) emitting in FL3, in conjunction with fluorescein isothiocyanate (FITC)- and phycoerythin (PE)-labeled mouse MoAb. These were PE-conjugated anti-CD45RO from Dako (Trappes, France), PE-conjugated anti-CD62L from Cymbus Biotechnology (Biotest, Paris, France), and FITC-conjugated anti-CD45RA, anti-CD57, anti–HLA-DR, and anti-CD95 from Immunotech (Marseille-Luminy, France). For flow cytometric detection of membrane-bound Fas-L, PBMC were incubated, immediately after thawing and thereafter, with 10 μmol/L KB8301 in culture medium. After blocking Fc receptors with 20% human AB serum, the cells were incubated with Mike-1, a rat IgG2a directed at human Fas-L from Alexis Corporation (obtained from Coger, Paris, France), or with control rat Lo-DNP-57, a rat anti-DNP IgG kindly provided by Dr D. Latinne (University of Louvain Medical School, Brussels, Belgium), then with PE-conjugated goat anti-rat IgG (Jackson Laboratories, obtained from Becton Dickinson). After further incubation with irrelevant polyclonal rat Ig, the cells were stained with FITC-conjugated anti-CD4, anti-CD8, or anti-CD14 MoAb. Fluorochrome-labeled, isotype-matched Ig controls were from Dako. Flow cytometry detection of Bcl-2 was performed with an anti–Bcl-2 purchased from Dako according to the manufacturer’s instructions. CD57 antigen was detected with an anti-CD57 IgM (American Type Culture Collection), followed by PE-conjugated goat F(ab)′2 anti-mouse Ig (Tebu, Le Perray-en-Yvelines, France). The cells were fixed with 1% paraformaldehyde in phosphate-buffered saline (PBS) and analyzed by flow cytometry using a FACScan (Becton Dickinson). Lymphocytes were gated by a forward (FSC) versus right angle (90°) light scatter plot (SSC). For each staining, data from at least 30,000 events in the lymphocyte gate were collected and subsequently analyzed using Cell Quest software (Becton Dickinson).
Culture conditions and induction of cell death.
Nonadherent PBMC (1 to 2 × 10⁵) were seeded in the wells of 96-well round-bottomed plates (Nunc, Roskide, Denmark) in 0.2 mL of RPMI 1640 medium supplemented with 10% fetal calf serum and antibiotics. Spontaneous apoptosis was measured 18 hours later. The death signal through CD95 was delivered by using the CH-11 anti-Fas MoAb (1 μg/mL).
Flow cytometric analysis of cell death.
To evaluate mitochondrial ΔΨm whose decrease is an indicator of apoptotic cell death,24 cells were stained for 15 minutes at 37° with 40 nmol/L of the potential sensitive fluorescent dye DiOC6 (3.3′-Diethyloxacarbocyanine), which emits in FL1 (Molecular Probes; Interchim, Montluçon, France). Apoptotic cells with low ΔΨm were identified on gated CD4+ and CD8+ T cells. Electronic gates were also set on the subpopulations of CD4+ or CD8+ T cells coexpressing or lacking CD45RO.
Hypodiploid cell assessment.
5 × 10⁵ cells were washed twice in PBS with 5.5 mmol/L glucose and fixed overnight in ethanol (70% in water, at 4°C). Cells were then resuspended in 0.5 mL PBS containing 50 μg/mL propidium iodide, 100 U/mL RNAse A (Sigma) and incubated for 30 minutes at room temperature under agitation. The DNA content of 104 cells was monitored by cytofluorometry using a Coulter Epics profile II analyzer.
Immunoblot analysis.
5 × 10⁵ cells were washed and solubilized in 20 mL of lysis buffer. Cell lysates were then subjected to sodium dodecyl sulfate polyacrilamide gel electrophoresis and electroblotted onto a nitrocellulose membrane. Detection of Bcl-2 protein was performed with an anti–Bcl-2 MoAb from Dako, and that of Bax with a rabbit antiserum from Santa Cruz Biotechnology (obtained from Tebu). Blots were stained with either anti-mouse or anti-rabbit horseradish peroxidase–labeled secondary antibody (Amersham, Les Ulis, France). They were then developed using an enhanced chemiluminescence detection system (ECL kit, Amersham). Films were exposed for 1 to 5 minutes. Densitometric scanning of the exposed films were performed using the Bio-Rad gel DOC 1000 apparatus (Bio-Rad S.A., Ivry Sur Seine, France) and analyzed using the Molecular Analyst 2.1 software (Bio-Rad).
Statistical analysis.
Differences between groups were established by the Student’st-test. Correlations were calculated by linear regression analysis. A P value lower than .05 was regarded as statistically significant.
RESULTS
Ex vivo peripheral T lymphocytes from BMT patients contain a large proportion of primed/memory cells during the first year after transplant but tend to recover substantial numbers of naive T cells in the long term.
Phenotypic analyses of peripheral T lymphocytes from the 26 BMT patients included in this study were sequentially performed after transplantation, and the data were arbitrarily divided into 3 time periods: (1) days 45 and 90 after transplantation (7 and 21 recipients, respectively) plus 1 recipient examined on day 120; (2) days 180 and 360 (6 and 7 recipients respectively); and (3) days 730 to 740 (9 recipients). Absolute blood lymphocyte counts were similar in all 3 groups (mean ± SD: 2,047 ± 1,341, 2,267 ± 1,565, and 2,075 ± 732), consistent with the notion that the numbers of newly generated lymphocytes of donor origin reach the lower limits of normal levels within 2 to 3 months.25 More than 95% of T cells were TCR-α/β+, irrespective of the time at which T cells were assessed (not shown). As expected, the patients had higher than normal numbers of CD8+ T cells and lower than normal numbers of CD4+ T cells (Table1), resulting in reverse CD4/CD8 proportions, particularly obvious for the first 2 groups of patients (ie, days 45 to 365). In these 2 groups, most CD4+ T cells (∼80%) and a substantial proportion of CD8+ T cells (∼55%) expressed CD45RO, the low-molecular-weight isoform of the leukocyte common antigen CD45, a marker of primed/memory T cells. (We also included in this category cells coexpressing CD45RO and CD45RA.) Increased expression of other activation markers such as CD57, and to a lesser extent, HLA-DR, was also detected on these cells. All lymphocytes appeared as small, nondividing cells by FSC analysis and examination of their DNA profiles (see Fig 3B). This indicates that the replication phase of these cells was almost completed. On day 730 or greater, the levels of these activation markers had returned to normal values, except for CD57, the level of which remained higher than normal on CD8+ T cells.
Phenotypic Analysis of T Lymphocytes From BMT Patients During the Follow-up Study
| . | . | Donors . | Recipients (d after BMT) . | ||
|---|---|---|---|---|---|
| 45 to 90 . | 180 to 365 . | ≥730 . | |||
| CD4+ (counts/μL) | 942 ± 279 | 325 ± 281 | 509 ± 274 | 642 ± 324 | |
| (n = 10) | (n = 26) | (n = 10) | (n = 8) | ||
| CD8high+ (counts/μL) | 456 ± 142 | 730 ± 505 | 895 ± 499 | 656 ± 372 | |
| (n = 10) | (n = 26) | (n = 10) | (n = 8) | ||
| CD4/CD8ratio | 2 | 0.44 | 0.56 | 0.98 | |
| (n = 10) | (n = 26) | (n = 10) | (n = 8) | ||
| % CD45RO+ | 51 ± 16 | 80 ± 16 | 73 ± 17 | 61 ± 17 | |
| (n = 17) | (n = 18) | (n = 10) | (n = 5) | ||
| CD4+ | % HLA-DR+ | 3 ± 3 | 25 ± 14 | 20 ± 16 | 3 ± 2 |
| (n = 6) | (n = 14) | (n = 8) | (n = 5) | ||
| % CD57+ | 6 ± 4 | 38 ± 24 | 14 ± 1 | 18 ± 13 | |
| (n = 7) | (n = 12) | (n = 5) | (n = 5) | ||
| % CD45RO+ | 33 ± 11 | 55 ± 19 | 58 ± 18 | 35 ± 9 | |
| (n = 17) | (n = 18) | (n = 10) | (n = 5) | ||
| CD8+high | % HLA-DR+ | 4 ± 1 | 18 ± 8 | 15 ± 12 | 4 ± 5 |
| (n = 10) | (n = 14) | (n = 8) | (n = 5) | ||
| % CD57+ | 22 ± 8 | 65 ± 16 | 61 ± 20 | 51 ± 12 | |
| (n = 7) | (n = 12) | (n = 5) | (n = 5) | ||
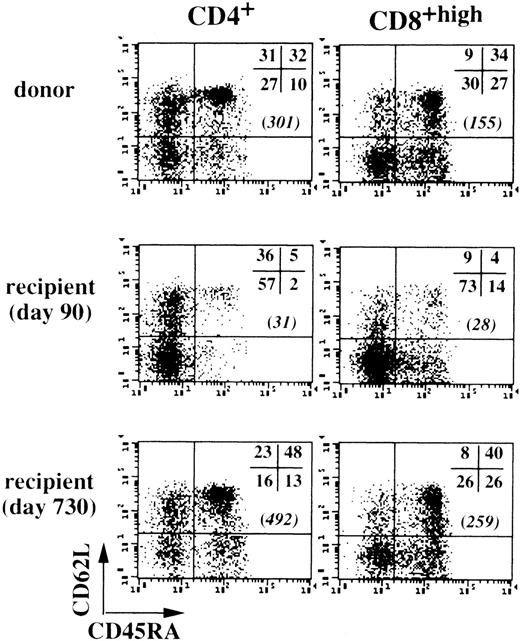
T cells with a naive phenotype are most clearly distinguished by coexpression of CD45RA and CD62L (the lymphocyte homing receptor L-selectin),26 so we used triple-color immunofluorescence to assess changes in these markers after transplantation, as shown in Fig 1 with the cells of unique patient number (UPN) 324 (30 years old). Determinations performed with the cells of 7 BMT recipients (mean age, 30.6 ± 14.2 years) showed that the absolute numbers of CD4+ T cells with a naive CD45RAhigh/CD62L+ phenotype were consistently low on day 90 after transplantation (28 ± 21 cells/μL blood), but tended to return to normal values toward the end of the follow-up period, reaching 175 ± 168 cells/μL (v 350 ± 78 naive CD4+ cells/μL in donors). The CD8+ T-cell population contained lower than normal proportions of naive CD45RAhigh/CD62L+ cells on day 90 (12% ± 7% v 38% ± 8% in donors); however, high absolute cell numbers were found in some cases. For example, UPN 564 (13 years old) had 231 naive CD8+ T cells/μL and UPN 282 (36 years old) had 322 naive CD8+ cells/μL. For the 5 other patients, a mean of 65 ± 40 naive CD8+ T cells/μL was recorded (v 171 ± 39 cells/μL in donors). In the late follow-up period, counts of naive CD8+ T cells generally normalized at around 119 ± 97 cells/μL (n = 7). These data suggest that post–BMT-generated naive T cells were present in the long term, despite reduced thymic function, because of the patients’ age.
Recovery of naive peripheral CD45RA+/CD62L+ T cells in long-term BMT patients. Peripheral CD4+ and CD8+ T cells from UPN 324 (30 years old) and his donor were examined by triple-color immunofluorescence at various time points after BMT. Values in brackets are numbers of CD45RA+/CD62L+ T cells per microliter of blood.
Recovery of naive peripheral CD45RA+/CD62L+ T cells in long-term BMT patients. Peripheral CD4+ and CD8+ T cells from UPN 324 (30 years old) and his donor were examined by triple-color immunofluorescence at various time points after BMT. Values in brackets are numbers of CD45RA+/CD62L+ T cells per microliter of blood.
Cytofluorometric analysis of Fas/CD95 expression by T cells from BMT patients.
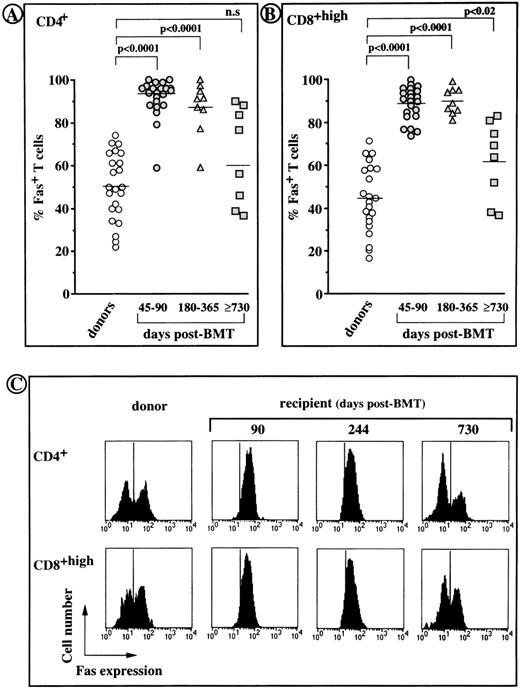
The frequency of Fas-positive cells increased greatly among both CD4+ and CD8+ T cells from all recipients during the first year after transplantation (≥90% v ∼45% and ∼50% in control CD4+ and CD8+ T cells,P < .0001). However, on day 730 or greater after transplantation, the percentages of Fas-positive cells had returned to normal values (Fig 2A and B). Fas expression on post-BMT T cells was of the same order of magnitude as Fas expression on normal T cells (Fig 2C), in which it is generally restricted to CD45RO+ memory T cells.27 Indeed, most (70% to 90%) Fas-negative T cells were CD62L+, whereas approximately only 25% Fas-positive T cells were CD62L+ (not shown).
Fas expression on CD4+ and CD8+ peripheral T cells from BMT recipients and their normal donors. (A and B) individual values obtained by cytofluorometric analysis. Horizontal bars indicate the median values for each group. (C) Representative histogram profiles generated from the T cells of UPN 324 showing the fluorescence obtained with an anti-Fas or irrelevant isotype matched MoAb (vertical bars).
Fas expression on CD4+ and CD8+ peripheral T cells from BMT recipients and their normal donors. (A and B) individual values obtained by cytofluorometric analysis. Horizontal bars indicate the median values for each group. (C) Representative histogram profiles generated from the T cells of UPN 324 showing the fluorescence obtained with an anti-Fas or irrelevant isotype matched MoAb (vertical bars).
Cultured peripheral T cells from BMT patients tend to undergo enhanced spontaneous apoptosis in vitro and are susceptible to anti–Fas-induced cell death during the first year after transplantation.
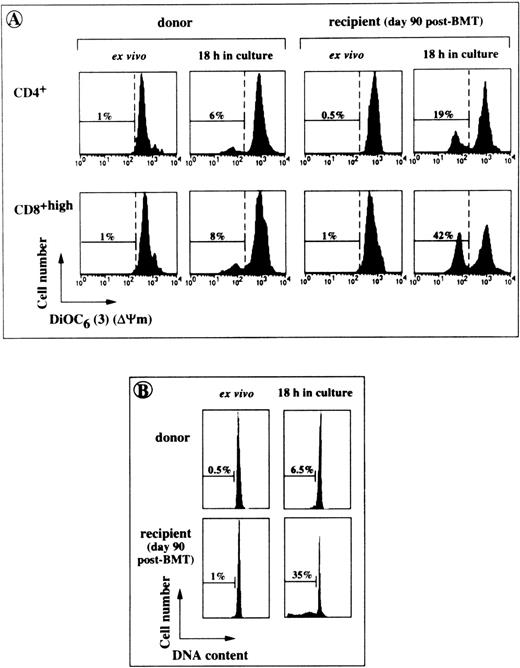
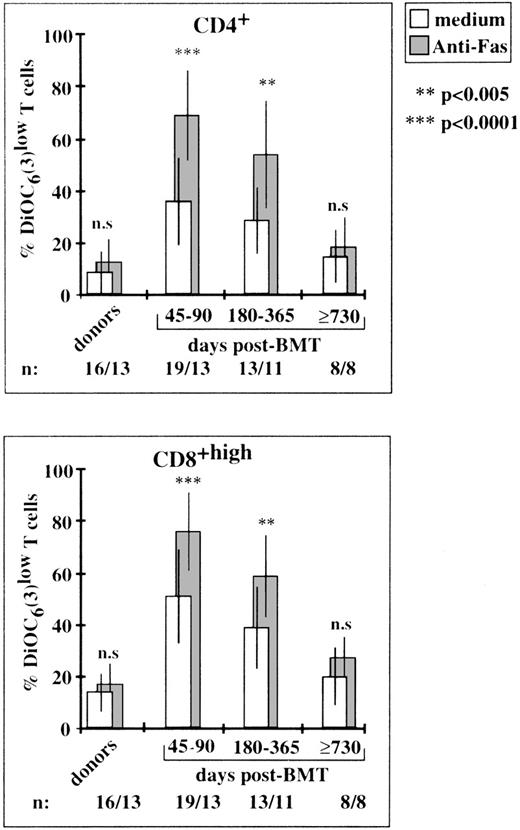
Cells at various stages of apoptosis can be detected by cytofluorometry, using the lipophilic dye, DiOC6 (3), which accumulates in mitochondria as a function of ΔΨm.24Apoptotic cells also typically appear as hypoploid cells with decreased DNA content.28 Freshly isolated T lymphocytes from BMT patients had high levels of mitochondrial activity and their DNA was not fragmented (Fig 3). However, following an 18-hour incubation in culture medium alone, CD4+ and CD8+ T cells obtained on day 90 after transplantation had higher percentages of DiOC6 (3)low cells and hypodiploid cells (Fig 3). Enhanced spontaneous apoptosis in vitro affected T lymphocytes collected on days 45 to 90 and on days 180 to 365 after BMT (P < .0001 and P < .003, respectively, in comparison with control T cells), but not those collected on day 730 or thereafter (Fig 4). The rate of spontaneous apoptosis on days 45 and 90 was higher for CD8+ T cells than for CD4+ T cells (51% ± 19% DiOC6 (3)low cells v36% ± 16%, P < .0001). This difference remained statistically significant for days 180 to 365 (P < .005). In the same conditions, 14% ± 7% and 9% ± 8% apoptotic cells were counted in donor CD8+ and CD4+ T cell populations, respectively. The binding of an agonistic anti-Fas MoAb to Fas receptors further increased the rate of cell death in post-BMT lymphocytes. A mean of 68% ± 17% CD4+ T cells and 76% ± 15% CD8+ T cells disrupted mitochondrial potential on days 45 to 90 (v 13% ± 9% and 20% ± 13% in the homologous anti–Fas-treated donor T cells). The extent of Fas-induced–specific apoptosis (ie, excess apoptosis over the spontaneous background) slightly decreased for cells collected on days 180 to 365, and became negligible for cells collected on days 730 or greater, consistent with the normalization of Fas expression and the simultaneous decrease in the levels of other activation markers.
Cytofluorometric analysis of accelerated spontaneous apoptosis affecting post-BMT T cells in short-term cultures. PBL from BMT patients and their donors were tested for apoptosis either directly after harvesting (ex vivo) or after an 18-hour incubation in culture medium. (A) A typical experiment performed with the cells of UPN 315 showing the percentages of cells with low ▵Ψm (DiOC6(3)low). (B) Percentages of hypodiploid cells detected in the same culture conditions by staining ethanol-permeabilized lymphocytes from UPN 294 with propidium iodide (linear scales are shown).
Cytofluorometric analysis of accelerated spontaneous apoptosis affecting post-BMT T cells in short-term cultures. PBL from BMT patients and their donors were tested for apoptosis either directly after harvesting (ex vivo) or after an 18-hour incubation in culture medium. (A) A typical experiment performed with the cells of UPN 315 showing the percentages of cells with low ▵Ψm (DiOC6(3)low). (B) Percentages of hypodiploid cells detected in the same culture conditions by staining ethanol-permeabilized lymphocytes from UPN 294 with propidium iodide (linear scales are shown).
Susceptibility to enhanced apoptosis in vitro and to anti–Fas-triggered apoptosis at various time points after BMT. Percentages of cells with low ▵Ψm were determined by cytofluorometry in gated CD4+ and CD8+T-cell subsets. Rates of apoptosis were much higher (P > .0001) on days 45 to 90 and 180 to 365, but not on day 730 than those of control cells. The P values (asterisks) show the levels of anti–Fas-triggered apoptosis relative to spontaneous background apoptosis. Histograms are means ± SD for individual determinations.
Susceptibility to enhanced apoptosis in vitro and to anti–Fas-triggered apoptosis at various time points after BMT. Percentages of cells with low ▵Ψm were determined by cytofluorometry in gated CD4+ and CD8+T-cell subsets. Rates of apoptosis were much higher (P > .0001) on days 45 to 90 and 180 to 365, but not on day 730 than those of control cells. The P values (asterisks) show the levels of anti–Fas-triggered apoptosis relative to spontaneous background apoptosis. Histograms are means ± SD for individual determinations.
In vitro Fas/Fas-L interactions are not involved in the high incidence of spontaneous death occurring in unstimulated cultures of post-BMT T lymphocytes.
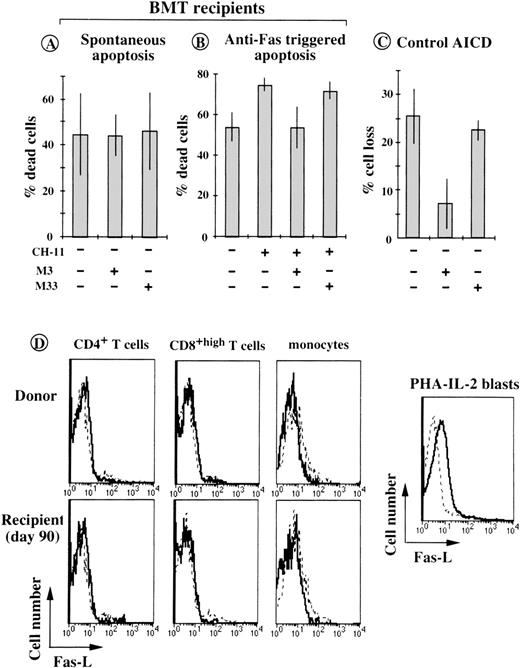
At saturating concentration (10 μg/mL), the antagonistic anti-Fas MoAb29 failed to reverse the accelerated spontaneous death occurring in vitro of T cells from BMT patients (Fig5A). Similar results were obtained when the assays were performed in the presence of 10 μmol/L K8301, a potent inhibitor of matrix metalloproteinases, used to avoid the proteolytic cleavage of membrane-bound Fas-L.30 In contrast, the M3 antibody almost completely inhibited anti–Fas-triggered apoptosis in the same cells (control anti-Fas M33 antibody had no effect, Fig 5B), and blocked activation-induced cell death (AICD) induced by CD3/TCR crosslinking of activated control CD4+ T cells (Fig 5C). An anti–Fas-L MoAb (Mik-1) specifically recognizing the extracellular domain of Fas-L failed to detect significant Fas-L expression on the surface of ex vivo T cells and monocytes from BMT patients. Moderate but significant Fas-L expression was in contrast detected on the surface of normal phytohemagglutinin-(PHA) IL-2-activated T blasts (Fig5D). These data argue against the possibility of Fas/Fas-L interactions being involved in the accelerated spontaneous death manifested in vitro by the patients’ T cells.
In vitro Fas/Fas-L interactions are not involved in accelerated spontaneous death of post-BMT T cells. (A) PBMC from 6 patients (on day 90 after BMT), were incubated for 18 hours in the presence of 10 μg/mL of the blocking anti-Fas MoAb M3 or of the negative control MoAb M33. Cell death was assessed according to trypan blue uptake and morphological criteria. Histograms are means ± SD for individual determinations. (B) Cytotoxic anti-Fas MoAb CH-11 was tested in the same conditions using PBMC isolated on day 90 after BMT (3 patients). (C) Effect of MoAb M3 on AICD of in vitro preactivated normal CD4+ T lymphocytes exposed for 8 to 14 hours to 10 μg/mL of plate-bound, anti-CD3 MoAb (OKT3). Percent cell loss is the decrease in the absolute number of viable cells compared with that of unstimulated control cells (means ± SD of 3 separate experiments). (C) Flow cytometric analyses of anti–Fas-L (solid lines) and control Lo-DNP-57 (dashed lines) MoAb reactivity with CD4+, CD8+, and CD14+ cells from donor and post-BMT T cells (from UPN 332) and with normal PHA-IL-2 blasts.
In vitro Fas/Fas-L interactions are not involved in accelerated spontaneous death of post-BMT T cells. (A) PBMC from 6 patients (on day 90 after BMT), were incubated for 18 hours in the presence of 10 μg/mL of the blocking anti-Fas MoAb M3 or of the negative control MoAb M33. Cell death was assessed according to trypan blue uptake and morphological criteria. Histograms are means ± SD for individual determinations. (B) Cytotoxic anti-Fas MoAb CH-11 was tested in the same conditions using PBMC isolated on day 90 after BMT (3 patients). (C) Effect of MoAb M3 on AICD of in vitro preactivated normal CD4+ T lymphocytes exposed for 8 to 14 hours to 10 μg/mL of plate-bound, anti-CD3 MoAb (OKT3). Percent cell loss is the decrease in the absolute number of viable cells compared with that of unstimulated control cells (means ± SD of 3 separate experiments). (C) Flow cytometric analyses of anti–Fas-L (solid lines) and control Lo-DNP-57 (dashed lines) MoAb reactivity with CD4+, CD8+, and CD14+ cells from donor and post-BMT T cells (from UPN 332) and with normal PHA-IL-2 blasts.
Relationship between Bcl-2 protein levels and the rate of enhanced spontaneous apoptosis displayed by CD4+ and CD8+ T lymphocytes from BMT patients.
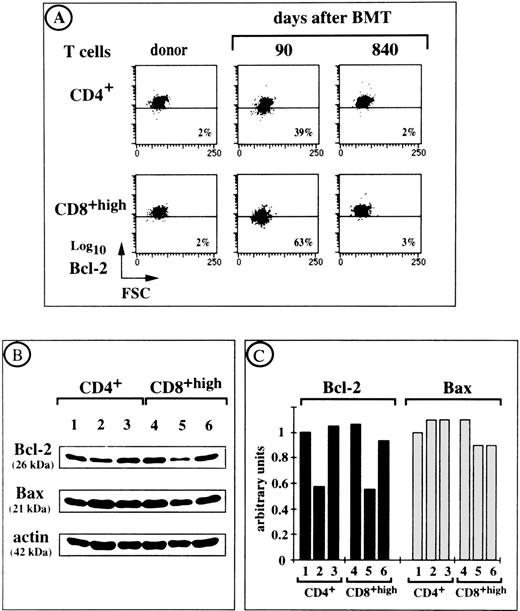
There is compelling evidence that Bcl-2 prevents the apoptotic death of activated T lymphocytes deprived of growth factors and of quiescent T cells that do not receive adequate stimuli.31 We therefore investigated whether there was a correlation between Bcl-2 levels in ex vivo T lymphocytes from BMT patients and their tendency toward spontaneous apoptosis in vitro. Most PBL from patients who received a transplant were stained with an anti–Bcl-2 MoAb. We therefore used flow cytometry to estimate the amounts of intracellular Bcl-2 protein (by measuring mean fluorescence intensity [MFI]) in individual ex vivo CD4+ and CD8+ T cells. For example, UPN 342 had 39% CD4+ T cells and 63% CD8+ T cells with decreased levels of Bcl-2 on day 90 after transplant, as assessed by a shift in staining intensity relative to control T cells (Fig6A). This was associated with a high rate of cell death in culture (30% in CD4+ T cells and 60% in CD8+ T cells). However, both Bcl-2 levels and spontaneous cell death rates returned to normal values by day 840 after transplantation. CD4+ and CD8+ T cells from UPN 342 and his bone marrow donor were also isolated by cell sorting. Their levels of Bcl-2 were compared by Western blotting using an MoAb that recognized the 26-kD Bcl-2 protein (Fig 6B) and were standardized using the amount of actin detected in each sample (Fig 6C). This approach confirmed the results obtained by flow cytometry. In contrast, the level of Bax, another member of the Bcl-2 family, which promotes cell death by antagonizing Bcl-2–mediated suppression of apoptosis,32 remained constant (see the expected 22-kD band in Fig 6B). Similar correlations between cytofluorometric and immunoblot analyses of Bcl-2 levels were found for the T cells of 4 other patients (not shown).
Ex vivo intracellular Bcl-2 and Bax protein expression by T cells from UPN 342 at various times after BMT. (A) A follow-up study of Bcl-2 levels in CD4+ and CD8+ T cells from UPN 342 is shown. Percentages of cells with a Bcl-2 content lower than that of donor cells are indicated. (B) Immunoblot analysis of Bcl-2 and Bax protein expression in 5 × 10⁵ T FACS-purified CD4+ and CD8+ T cells from UPN 342. Actin levels were assessed for the same samples. Lane 1, donor T cells; lane 2, ex vivo T cells on day 90 after BMT; lane 3, ex vivo T cells on day 840 after BMT. (C) Relative levels of Bcl-2 and Bax proteins determined by scanning the exposed films with a densitometer and expressed relative to the level of actin in the same samples. Ratios were calculated for each experimental point as follows: absorbance of Bcl-2 or Bax staining/absorbance of actin staining. The ratio for sample 1 was set as 1 arbitrary unit. All the other ratios were referred to this internal ratio.
Ex vivo intracellular Bcl-2 and Bax protein expression by T cells from UPN 342 at various times after BMT. (A) A follow-up study of Bcl-2 levels in CD4+ and CD8+ T cells from UPN 342 is shown. Percentages of cells with a Bcl-2 content lower than that of donor cells are indicated. (B) Immunoblot analysis of Bcl-2 and Bax protein expression in 5 × 10⁵ T FACS-purified CD4+ and CD8+ T cells from UPN 342. Actin levels were assessed for the same samples. Lane 1, donor T cells; lane 2, ex vivo T cells on day 90 after BMT; lane 3, ex vivo T cells on day 840 after BMT. (C) Relative levels of Bcl-2 and Bax proteins determined by scanning the exposed films with a densitometer and expressed relative to the level of actin in the same samples. Ratios were calculated for each experimental point as follows: absorbance of Bcl-2 or Bax staining/absorbance of actin staining. The ratio for sample 1 was set as 1 arbitrary unit. All the other ratios were referred to this internal ratio.
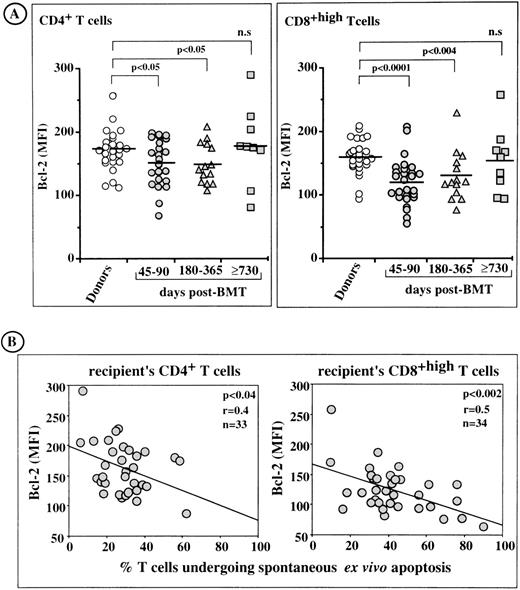
MFI values for Bcl-2 in individual T cells from bone marrow donors and from BMT patients are shown in Fig 7A. On days 45 to 90 and 180 to 365, but not on day 730 or greater after transplantation, the MFIs of CD4+ T cells and CD8+ T cells were significantly lower than those of donor cells. The decrease in Bcl-2 levels was more pronounced in CD8+ T cells than in CD4+ T cells. Linear regression analysis (Fig 7B) showed that there was a significant correlation between the proportions of patients’ CD4+ and CD8+ T cells undergoing enhanced spontaneous apoptosis in culture and those showing ex vivo downregulation of Bcl-2. This correlation was statistically more significant in CD8+ T cells (P < .002, r = .5) than in CD4+T cells (P < .04, r = .4), consistent with the higher tendency of CD8+ T cells to undergo spontaneous apoptosis in culture.
Flow cytometric analysis of Bcl-2 levels in post-BMT lymphocytes. Relationship with the rate of enhanced spontaneous apoptosis in short-term culture. (A) MFI for intracellular Bcl-2 expression in ex vivo CD4+ and CD8+ T lymphocytes. Horizontal bars are the arithmetic means of individual data. (B) Inverse correlation between Bcl-2 expression in post-BMT T cells and the rate of spontaneous apoptosis in vitro.
Flow cytometric analysis of Bcl-2 levels in post-BMT lymphocytes. Relationship with the rate of enhanced spontaneous apoptosis in short-term culture. (A) MFI for intracellular Bcl-2 expression in ex vivo CD4+ and CD8+ T lymphocytes. Horizontal bars are the arithmetic means of individual data. (B) Inverse correlation between Bcl-2 expression in post-BMT T cells and the rate of spontaneous apoptosis in vitro.
Rates of spontaneous apoptosis in vitro and Bcl-2 levels in T- cell subsets defined according to CD45RO isoform expression.
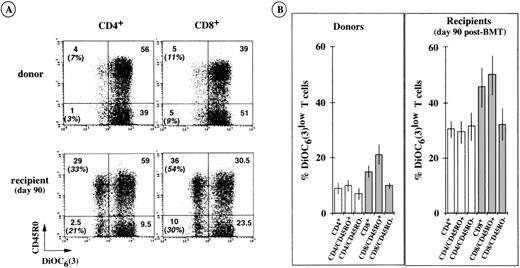
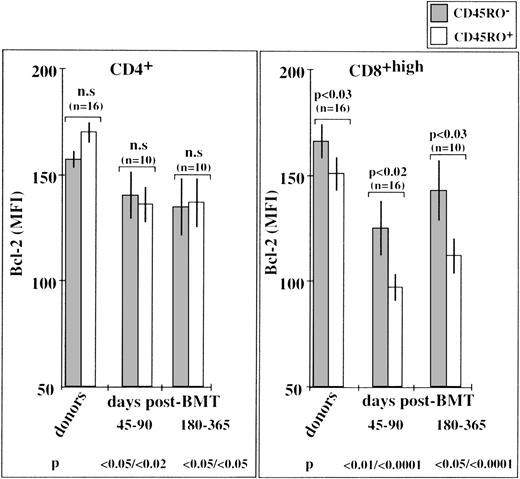
We used DiOC6(3) dye and triple-color immunofluorescence to assess the rate of spontaneous apoptosis in short-term cultures of CD4+ and CD8+ T-cell subpopulations with and without CD45RO membrane expression. Typical cytofluorometric profiles, obtained from UPN 440 (day 90 after transplantation) showed that both the CD45RO+ and CD45RO− T cells of this recipient were susceptible to accelerated apoptosis in vitro (Fig8A). Determinations were made for the cells of 6 other BMT recipients (day 90) and their bone marrow donors (Fig8B). They showed that CD8+/CD45RO+ T cells were particularly susceptible to apoptosis, with approximately 50% DiOC6low cells expressing the CD8+/CD45RO+ phenotype and approximately 30% DiOC6low cells belonging to the other CD8+/CD45RO−, CD4+/CD45RO+, and CD4+/CD45RO− T-cell subsets. These accelerated rates of apoptosis were associated with decreased levels of Bcl-2, particularly evident in ex vivo CD8+/CD45RO+ T cells from BMT patients examined on days 45 to 90 and days 180 to 365 (Fig9). Normal CD8+/CD45RO+ T cells also showed some tendency to undergo enhanced spontaneous apoptosis in culture (∼20% DiOC6low cells v ∼10% in other normal T-cell subsets, see Fig 8B). This was also associated with lower levels of Bcl-2 in normal CD8+/CD45RO+ T cells than in their CD8+/CD45RO− counterparts (Fig9). Few differences were detected in the Bcl-2 levels of CD4+/CD45RO+ T cells and CD4+/CD45RO− T cells from each group of patients, consistent with the observation that the 2 types of cells had similar rates of spontaneous apoptosis in vitro. All these data strongly support the notion that the intracellular level of Bcl-2 dictates the extent of spontaneous in vitro apoptosis affecting newly generated cells after BMT. That is, the lower the level of Bcl-2 in a cell, the more susceptible it is to this type of death.
Susceptibility to enhanced spontaneous apoptosis in vitro of T subpopulations according to CD45RO isoform expression. (A) A typical triple-color immunofluorescence analysis performed with the cells of UPN 440 and his bone marrow donor. The values in brackets are the percentages of apoptotic cells (DiOC6(3)low) within the CD45RO+ and CD45RO− T-cell subpopulations. (B) Similar analyses performed with the cells of 6 other BMT patients and their corresponding bone marrow donors. The histograms show the means ± SD of individual determinations.
Susceptibility to enhanced spontaneous apoptosis in vitro of T subpopulations according to CD45RO isoform expression. (A) A typical triple-color immunofluorescence analysis performed with the cells of UPN 440 and his bone marrow donor. The values in brackets are the percentages of apoptotic cells (DiOC6(3)low) within the CD45RO+ and CD45RO− T-cell subpopulations. (B) Similar analyses performed with the cells of 6 other BMT patients and their corresponding bone marrow donors. The histograms show the means ± SD of individual determinations.
Bcl-2 expression in CD45RO+ and CD45RO− T-cell subpopulations from BMT patients and their bone marrow donors. Bcl-2 levels (MFI values) were estimated by triple-color immunofluorescence analysis. The P values at the bottom of the figure refer to the MFI of donor CD45RO-negative T cells.
Bcl-2 expression in CD45RO+ and CD45RO− T-cell subpopulations from BMT patients and their bone marrow donors. Bcl-2 levels (MFI values) were estimated by triple-color immunofluorescence analysis. The P values at the bottom of the figure refer to the MFI of donor CD45RO-negative T cells.
DISCUSSION
Early after BMT,15 and for at least the first year after transplantation (this study), a substantial proportion of newly generated peripheral CD4+ and CD8+ T lymphocytes undergo enhanced spontaneous apoptosis in short-term culture. This suggests that these lymphocytes are in a fragile equilibrium between life and death in vivo. We found that the levels of the bcl-2 gene product, which increases lymphoid survival,33,34 were significantly lower than normal in peripheral CD4+ and CD8+ T cells from many BMT patients during the first year after transplantation, and that there was a significant correlation between the extent of spontaneous apoptosis in vitro and the decrease in Bcl-2 levels in these cells. In contrast, the amounts of the pro-apoptotic protein Bax did not change, suggesting that a decrease in the Bcl-2/Bax ratio contributed to the tendency of post-BMT T lymphocytes to undergo spontaneous apoptosis. Both the CD45RO+ and CD45RO−(CD45RA+) T-cell subsets circulating in BMT patients were susceptible to spontaneous apoptosis and had reduced Bcl-2 levels. These features were, however, much more pronounced in primed/memory CD8+/CD45RO+ T cells, consistent with studies of peripheral T cells from patients suffering from acute viral infections such as those induced by EBV, VZV,17,35 or HIV.18 19 It is unknown whether the few naive CD45RA+/CD62-L+ T cells generated during the first year after BMT were also subjected to spontaneous death in vitro. Naive T cells slowly accumulate in vivo, so they presumably resist apoptosis, whereas T cells with a primed/memory phenotype (CD62L−) are more likely to succumb, until homeostasis of the immune T-cell system is reached. Further experiments are required to investigate this possibility.
Our study shows that the expansion of the primed/memory T-cell population, during the first year after BMT, was accompanied by the upregulation of Fas expression and susceptibility to Fas-triggered apoptosis. In contrast, Fas-ligand expression was not upregulated on the surface of post-BMT T cells, nor on the monocytes from the same PBMC preparations. Accordingly, treatment with the antagonistic M3 anti-Fas MoAb failed to reverse the in vitro accelerated spontaneous death of post-BMT T cells, which suggests that Fas/Fas-ligand interactions are not involved. However, Fas+ post-BMT lymphocytes may be in vivo the targets of Fas-L-expressing cells, so the dysregulation of Fas expression may contribute, together with Bcl-2 dysregulation, to the presumed in vivo fragility of T lymphocytes after BMT. A recent report showed that CD4+ T cells, generated during peripheral expansion after intensive chemotherapy in adults, are susceptible to AICD if stimulated with mitogenic lectins.36We tested whether anti-CD3 MoAb induced AICD in the lymphocytes of BMT patients (data not shown). They did not, probably because the cells were in a quiescent state and were therefore insensitive to apoptotic stimuli that otherwise operate on fully activated T cells.
After transplant, peripheral T cells with a low Bcl-2 content showed no signs of apoptosis immediately after they were obtained. In particular, their mitochondrial transmembrane potential (ΔΨm), the dissipation of which occurs very early in the apoptotic process,24 was normal. This suggests that the cells were not yet committed to death but that they were in a fragile equilibrium between life and death. What then are their in vivo rescue signals? Constant T-cell receptor (TCR)–major histocompatibility complex contacts ensure the survival of mature CD4+ and CD8+ T cells in the periphery.37,38 Interactions with fibroblasts are also required to keep alive in vitro activated T cells with low Bcl-2 levels that have reverted to a quiescent memory state.17 Recent data indicate that type-1 interferons secreted by stromal cells are the factors responsible for the rescue of such cells.39Therefore, microenvironmental factors may counteract in vivo the tendency of post-BMT T lymphocytes (with low Bcl-2 content) toward spontaneous apoptosis. Cytokines may also be effective in this respect. However, post-BMT lymphocytes could not be rescued from apoptosis by cytokines such as IL-2 and IL-15 (data not shown), which are otherwise efficient at attenuating the spontaneous death in vitro of T cells from patients acutely infected with EBV and VZV,17 or HIV.40 41
In the long term after BMT, the apoptotic phenotype tended to disappear, and normal naive/memory T-cell profiles tended to emerge. In the case of patients undergoing intensive chemotherapy for cancer, the presence of a functional thymus makes possible the rapid regeneration of naive (CD45RAhigh) CD4+ T cells from the bone marrow progenitors, whereas in patients lacking thymus function (>15 years old), the lymphocyte population consists mainly of T cells with exclusively a primed/memory phenotype.42 These data are consistent with the notion of thymic involution starting soon after birth and continuing at a rate of approximately 3% per year until middle age (and at 1% thereafter), resulting in a dramatic loss of thymic function.43 However, remnants of thymic tissue persist for decades and support residual T-cell differentiation in adults.44 After BMT, these thymic remnants are profoundly damaged, but thymic lymphopoiesis is eventually restored at a low rate within small epithelial areas.45 This may account for the accumulation of peripheral naive T cells in adult BMT patients. However, it has been reported that short-term incubation in culture medium of T-cell–depleted mouse marrow CD4−CD8− TcR α/β− cells results in the differentiation of CD4+ and CD8highTCR-α/β+ cells similar to those of normal spleen T cells, most with a CD62Lhigh CD44low naive phenotype.46 These data suggest that there is a pathway of T-cell lymphopoiesis in the bone marrow microenvironment, which may be involved in T-cell reconstitution after BMT. In any case, the accumulation of naive T cells in the long term and the normalization of naive/primed T-cell profiles coincide with the restoration of normal Bcl-2 levels, the disappearance of the apoptotic phenotype, and the homeostatic equilibrium of the T-cell system.
Supported by grants from the CNRS, the Etablissement Français des Greffes, the Association pour la Recherche sur le Cancer, and the Université de Paris Sud.
The publication costs of this article were defrayed in part by page charge payment. This article must therefore be hereby marked “advertisement” in accordance with 18 U.S.C. section 1734 solely to indicate this fact.
REFERENCES
Author notes
Address reprint requests to Anna Senik, PhD, Equipe d’Immunologie Cellulaire et de Transplantation de L’UPR 420 du CNRS, 19 rue Guy Moquet, 94801 Villejuif, France.

This feature is available to Subscribers Only
Sign In or Create an Account Close Modal