Abstract
B7-2 is a costimulatory molecule expressed on professional antigen-presenting cells that provides T cells with a critical signal resulting in T-cell activation. Interferon-γ (IFN-γ) enhances B7-2 protein expression in monocytic cells. However, the molecular mechanisms controlling the enhanced expression of B7-2 are poorly understood. Northern blot and flow cytometry analysis revealed that human monocytes and the human monocytic cell line MonoMac6 (MM6) constitutively expressed B7-2 mRNA and protein and IFN-γ treatment further enhanced the expression of both molecules. The ability of IFN-γ to enhance B7-2 mRNA was evident at the dose of 31 U/mL and reached plateau levels at 500 U/mL. The effects of IFN-γ on B7-2 mRNA expression were time dependent and occurred within 3 hours of treatment and increased through 24 hours. In vitro transcription assays and mRNA stability experiments showed that IFN-γ increases both transcriptional activity and the stability of B7-2 mRNA. Treatment of MM6 cells with cycloheximide showed that de novo protein synthesis was not required for the IFN-γ–enhanced expression of B7-2 mRNA. Overall, these studies show for the first time that IFN-γ–enhanced expression of B7-2 protein in human monocytic cells is controlled at the gene level through a dual mechanism involving transcriptional and posttranscriptional mechanisms.
THE ENGAGEMENT of the antigen-specific T-cell receptor (TCR) with an antigenic peptide in the context of the major histocompatibility complex (MHC) provides the initial signal, recognition, for a T-cell–mediated antigen-specific immune response.1 However, although signaling through the TCR is essential for proper activation of T cells, a second signal termed costimulation seems to be pivotal in controlling the functional outcome of T-cell activation.1-3 Absence of a costimulatory signal can induce long-term antigen-specific T-cell unresponsiveness called anergy.1-3 T-cell costimulation occurs after interaction of the CD28 T-cell receptor with one of the B7 family members expressed on an antigen-presenting cell (APC). The B7 family of proteins B7-1 and B7-2 are both members of the Ig superfamily, and their functional status displays a restricted APC-dependent pattern of expression.4,5 Several transfection studies have indicated that both B7-1 and B7-2 can serve as ligands for in vitro costimulation of T cells.6-10 Although either of the B7 family members can provide costimulation, mounting evidence has accumulated supporting a dominant role for B7-2 in primary T-cell responses.11Recent observations have indicated that anti–B7-1 antibodies have a minimal inhibitory effect on T-cell proliferation during allogeneic primary mixed lymphocyte reactions,12 whereas in most cases, treatment with anti–B7-2 antibodies inhibits most of the early T-cell activation responses to levels similar to those observed with hCTLA4Ig, a potent inhibitor of the B7/CD28 costimulatory signal.10,13,14 B7-1 knockout (KO) mice display relatively normal Th1- and Th2-dependent immune responses, whereas B7-2 KO mice are severely immunocompromised.11 On most resting professional APCs, B7-2, but not B7-1, is constitutively expressed. Noteworthy, on activation of dendritic cells (DC), macrophages, and B cells, B7-2 expression can be induced with faster kinetics and, in general, to a much higher level of expression than B7-1.15Although the particular dominance of B7-1 or B7-2 as the main costimulatory molecule in vitro or in vivo is yet to be clearly determined, collectively these findings indicate that B7-2 is a major player in T-cell costimulation, and it has a critical dominant role in the initiation of the immune response.
Interferon-γ (IFN-γ), secreted by activated T lymphocytes and natural killer cells,16 is a potent activator of human monocytic cells. IFN-γ activates and differentiates human monocytes,17,18 leading to increase in Class I and Class II MHC expression,16,19,20 transferrin receptor expression,21 toxic oxygen derivatives and nitric oxide production,22 tumoricidal activity,17,23 and regulation of cytokine expression24-27 and their receptors.27Recently, it has been shown that IFN-γ also increases the expression of the costimulatory molecule B7-2 in both human monocytes28 and murine macrophages.13 However, the molecular mechanisms controlling the expression of B7-2 in human monocytic cells are not well understood. Elucidating the mechanisms involved in the expression of this important costimulatory molecule is essential for the understanding of the regulation of T-cell–dependent immunity. To investigate the mechanisms involved in B7-2–enhanced expression by IFN-γ, we studied the regulation of B7-2 mRNA in the human monocytic cell line MonoMac6 (MM6). MM6 cells have been extensively characterized, and they display phenotypic and functional features of mature human monocytes,29 including enhanced antigen expression in response to IFN-γ. We show that IFN-γ enhances B7-2 mRNA accumulation and protein expression in human monocytic cells. Upregulation of B7-2 expression by IFN-γ occurs rapidly and through mechanisms that do not require new protein synthesis. Finally, we also provide first evidence that the enhancement of B7-2 mRNA expression by IFN-γ is controlled through both transcriptional and posttranscriptional mechanisms.
MATERIALS AND METHODS
MM6 cell culture and cytokine stimulation.
The human monocytic cell line MM629 was obtained from the repository of the National Cancer Institute, Frederick Cancer Research and Development Center (Frederick, MD) and cultured as previously described.29 Briefly, MM6 cells were incubated at 37°C in a 5% CO2-humidified atmosphere in Dulbecco’s modified Eagle’s medium (DMEM) tissue culture (Advance Biotechnology, Columbia, MD) supplemented with 50 U/mL penicillin, 50 μg/mL streptomycin, 2 mmol/L L-glutamine, and 15% heat-inactivated fetal bovine serum (FBS) (Hyclone Laboratories, Logan, UT). Exponentially growing cells were cultured at 5 × 10⁵cells/mL in complete medium, hereafter referred to as complete medium. Ten milliliters of cell suspension were plated in 100-mm2tissue culture plates (Corning Glass Works, Corning, NY) in medium alone or supplemented with the indicated doses of recombinant human IFN-γ (specific activity 2.02 × 10⁷ U/mg), kindly provided by Dr Craig W. Reynolds (Biological Resources Branch, Division of Cancer Treatment, Diagnosis and Centers, National Cancer Institute, Frederick Cancer Research and Development Center). Cells were harvested at the indicated time points and were used for flow cytometry analysis or total RNA extraction as described below.
Monocyte isolation, culture condition, and stimulation.
Peripheral blood leukocytes were obtained from normal healthy volunteers by leukapheresis using a Fenwell CS-3000 blood cell separator (Fenwell Laboratories, Deerfield, IL). Mononuclear cells were separated by density gradient centrifugation on lymphocyte separation medium (LSM; Organum Teknika Corp, Durham, NC) and then purified in suspension from the unfractionated mononuclear leukocyte preparation by counter-current centrifugal elutriation in a Beckman JE-6 elutriation chamber and rotor system (Beckman Instruments Inc, Palo Alto, CA), as described elsewhere.27 The purity of monocyte preparations was 94% ± 3%, as assessed by morphology on Giemsa-stained cytocentrifuge slide preparations and by flow cytometry using the monocyte-specific monoclonal antibody (MoAb) Leu M3 (Becton Dickinson, Mountain View, CA). Viability, as determined by trypan blue exclusion test, was >99%. Monocytes were cultured in RPMI 1640 (BioWhittaker, Walkersville, MD), supplemented with 100 U/mL penicillin, 100 U/mL streptomycin, 2 mmol/L L-glutamine, 20 mmol/L HEPES (GIBCO-BRL, Gaithersburg, MD), and 10% heat-inactivated FBS (Hyclone Laboratories). Monocytes were cultured at the indicated time point in 15-cm Lux plates (Miles Scientific, Wapersville, CA) at 2 × 10⁶cells/mL in medium alone or supplemented with either 500 U/mL of recombinant human IFN-γ (specific activity 2.02 × 10⁷U/mg) or 10 ng/mL of lipopolysaccharide (LPS) from E coliserotype 0111:B4 purchased from Sigma Chemical Company (St Louis, MO).
Flow cytometry analysis.
Flow cytometry analysis was performed as previously described.30 Briefly, monocytic cells were washed once with phosphate-buffered saline (PBS) and then labeled as described below. MM6 cells (1 × 10⁶) were resuspended in 100 μL of PBS containing 2% heat-inactivated human AB serum (Sigma Chemical Co) and 0.05% sodium azide (Sigma Chemical Co), hereafter referred to as flow cytometry buffer (FB). Cells were then incubated for 30 minutes at 4°C with anti-CD86 (B70/B7-2; Pharmingen, San Diego, CA) or with isotype control anti-γ1/γ2a (Becton Dickinson, San Jose, CA) antibodies, and concentrations were used according to manufacturer’s recommendations. Cells were washed twice with cold FB and fixed with FB buffer containing 0.5% paraformaldehyde. Flow cytometry analysis of B7-2 expression was performed using an Elite flow cytometer (Coulter Corp, Hialeah, FL). The data are expressed as mean channel fluorescence intensity (MCFI in arbitrary units of fluorescence). MCFI is an indication of the relative density of surface antigens present on individual cells.
Northern blot analysis.
Human peripheral blood monocytes or MM6 cells were cultured in medium alone or supplemented with the indicated reagents. Total RNA was extracted by lysis with TRIzol (GIBCO-BRL, Gaithersburg, MD) and purified according to the manufacturer’s specifications. Northern blot analysis was performed in accordance with the previously described protocol.30 Twenty micrograms of total RNA from each sample was electrophoresed under denaturing conditions, blotted onto nytran membranes (Schleicher & Schuell Inc, Keene, NH), and cross-linked by UV irradiation. Membranes were prehybridized at 42°C in Hybrisol (Oncor Inc, Gaithersburg, MD) and hybridized overnight with 2 × 10⁶ cpm/mL of 32P-labeled probe. Membranes were then washed three times at room temperature for 10 minutes in 2× SSC (1× SSC = 0.15 mol/L NaCl, 0.015 mol/L sodium citrate, pH 7.0) and 0.1% sodium dodecyl sulfate (SDS), and twice at 65°C for 20 minutes in 0.2× SSC and 0.1% SDS before being autoradiographed using Kodak Biomax-MR (Eastman Kodak Company, Rochester, NY) films and intensifying screens at −70°C. The human cDNA B7-2 probe (a kind gift from Dr Gordon Freeman, Division of Hematologic Malignancies, Dana-Farber Cancer Institute, and Department of Medicine, Harvard Medical School, Boston, MA) and human glyceraldehide-3 phosphate dehydrogenase (GAPDH) (Clontech, Palo Alto, CA) were labeled by random priming and [α-32P]dCTP (3,000 Ci/mmol; Amersham, Arlington Heights, IL). For mRNA synthesis inhibition, actinomycin D (Act-D; Sigma Chemical Co) was dissolved in ethanol at 1 mg/mL and used at a final concentration of 5 μg/mL, as indicated in the text. For protein synthesis inhibition experiments, cycloheximide (CHX; Sigma Chemical Co) was used at a final concentration of 10 μg/mL. An alphaImager 2000 (Alpha Innotech Corporation, San Leandro, CA) was used to analyze the bands’ intensities of the autoradiographs of the Northern blots. The graphs were generated from the average of the intensities of the three distinct species of B7-2 mRNA. The results were normalized to GAPDH.
Nuclear run-on.
Nuclear run-on experiments were performed as previously described.18 Briefly, nuclei were isolated from 5 × 10⁷ cells/sample by lysing cells in 4 mL of lysis buffer (10 mmol/L Tris-HCl pH 7.4, 3 mmol/L MgCl2, 10 mmol/L NaCl, 150 mmol/L sucrose, and 0.5% nonidet P-40; Sigma Chemical Co) for 5 minutes on ice. Nuclei were spun at 167g for 5 minutes at 4°C, and pellets were resuspended in lysis buffer without nonidet P-40. Nuclei were pelleted again as described above and resuspended in 150 μL of freezing buffer (50 mmol/L Tris-HCl pH 8.3, 40% glycerol, 5 mmol/L MgCl2, 0.1 mmol/L EDTA). Run-on assays were performed by adding 150 μL of 2× transcription buffer (20 mmol Tris-HCl pH 8.0, 300 mmol KCl, 10 mmol/L MgCl2, 200 mmol/L sucrose 20% glycerol, 1 mmol dithiotreitol, 0.5 mmol each of adenosine triphosphate [ATP], guanosine triphosphate [GTP], and cytidine triphosphate [CTP]) and 100 μCi of 800 Ci/mmol [α32P] uridine triphosphate (NEN, Boston, MA) to 150 μL of nuclei suspension. The samples were incubated at 29°C for 30 minutes. Thirty microliters of 200 mmol CaCl2 and 30 μL of 1 U/mL Rnase-free Dnase 1 (Promega, Gaithersburg, MD) were added to each reaction and further incubated for 10 minutes at 29°C. Labeled transcripts were isolated using TRIzol (GIBCO-BRL) and purified according to the manufacturer’s specifications. Equal amounts of radioactivity (about 2 × 10⁶ cpm of labeled RNA) were added in 2 mL of Hybrizol (Oncor Inc) to nytran membranes on which 500 ng of denatured full-length human B7-2 cDNA (1.1 kb) and chicken β-actin cDNA (1.8 kb, HindIII fragment; Oncor Inc) were immobilized using a slot blot apparatus (GIBCO-BRL) and a UV crosslinker (Fisher Scientific, Pittsburgh, PA). Hybridization was performed at 42°C for 48 hours. Filters were washed three times at 42°C for 15 minutes with 2× SSC/0.1% SDS and two times at 65°C for 20 minutes with 0.2× SSC/0.1% SDS. Filters were then autoradiographed at −70°C. Data were normalized for the content of β-actin present in each sample using an alphaImager 2000 (Alpha Innotech Corporation).
RESULTS
IFN-γ enhances B7-2 mRNA expression in MM6.
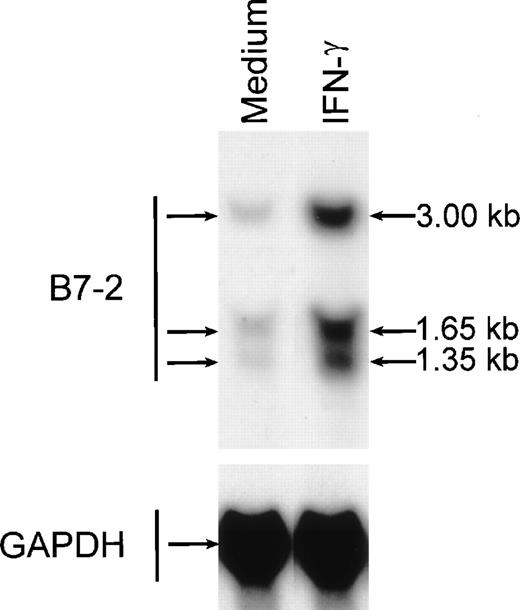
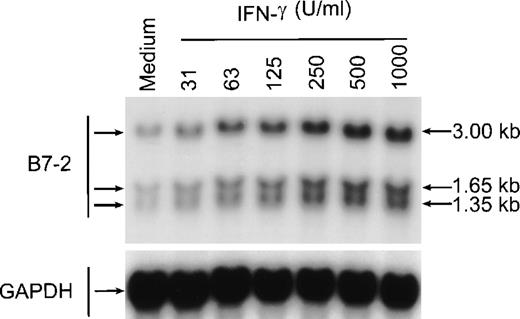
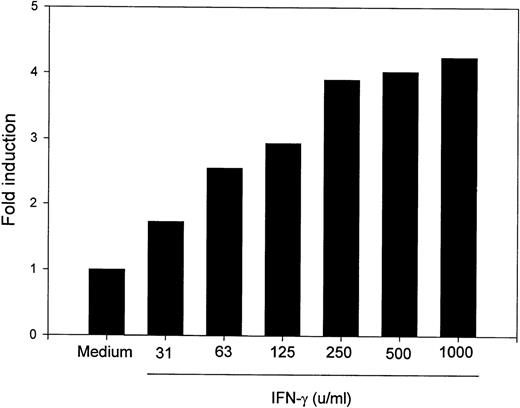
To determine whether MM6 cells responded to IFN-γ with changes in B7-2 mRNA expression, MM6 were cultured for 18 hours in medium alone or in the presence of 500 U/mL of IFN-γ, a dose previously shown to induce maximal activation of human monocytes.23 Total RNA was extracted, and Northern blot analysis was performed. As shown in Fig 1, a low basal expression of B7-2 mRNA was detected in the medium control, whereas IFN-γ treatment of MM6 cells led to a significant enhanced expression of B7-2 mRNA. Dose-response experiments were performed to determine the optimal concentration of IFN-γ needed to induce maximal enhanced expression of B7-2 mRNA. MM6 cells were cultured in medium alone or in the presence of increasing concentrations of IFN-γ. After 18 hours of stimulation, total RNA was extracted and analyzed by Northern blot for B7-2 mRNA expression. As seen in Fig 2, IFN-γ induced a dose-dependent increase of B7-2 mRNA. As little as 31 U/mL were sufficient to induce a modest increase in B7-2 mRNA levels, whereas doses of IFN-γ between 250 and 1,000 U/mL were required for maximal expression. Therefore, 500 U/mL of IFN-γ was used in all subsequent experiments.
IFN-γ treatment of MM6 cells increases B7-2 mRNA expression. MM6 cells were cultured for 18 hours in the absence or presence of 500 U/mL of IFN-γ. Total cellular RNA was extracted and analyzed by Northern blot for B7-2 mRNA expression. The same membrane was rehybridized with GAPDH to control that equal amounts of RNA were loaded in each lane. Data shown are from 1 representative experiment of 4 performed.
IFN-γ treatment of MM6 cells increases B7-2 mRNA expression. MM6 cells were cultured for 18 hours in the absence or presence of 500 U/mL of IFN-γ. Total cellular RNA was extracted and analyzed by Northern blot for B7-2 mRNA expression. The same membrane was rehybridized with GAPDH to control that equal amounts of RNA were loaded in each lane. Data shown are from 1 representative experiment of 4 performed.
B7-2 mRNA expression is enhanced in a dose-dependent manner by IFN-γ. MM6 cells were cultured for 18 hours in the absence or presence of increasing concentrations of IFN-γ. Total cellular RNA was extracted and analyzed by Northern blot for B7-2 mRNA expression. The same membrane was rehybridized with GAPDH to control that equal amounts of RNA were loaded in each lane. Data shown are from 1 representative experiment of 2 performed. Northern blot analysis for B7-2 mRNA expression (upper panel). Quantitative analysis of B7-2 mRNA expression (lower panel). As described in Materials and Methods, the bands’ intensities were normalized to the GAPDH housekeeping gene control, and the graph was generated with the relative values obtained after normalization.
B7-2 mRNA expression is enhanced in a dose-dependent manner by IFN-γ. MM6 cells were cultured for 18 hours in the absence or presence of increasing concentrations of IFN-γ. Total cellular RNA was extracted and analyzed by Northern blot for B7-2 mRNA expression. The same membrane was rehybridized with GAPDH to control that equal amounts of RNA were loaded in each lane. Data shown are from 1 representative experiment of 2 performed. Northern blot analysis for B7-2 mRNA expression (upper panel). Quantitative analysis of B7-2 mRNA expression (lower panel). As described in Materials and Methods, the bands’ intensities were normalized to the GAPDH housekeeping gene control, and the graph was generated with the relative values obtained after normalization.
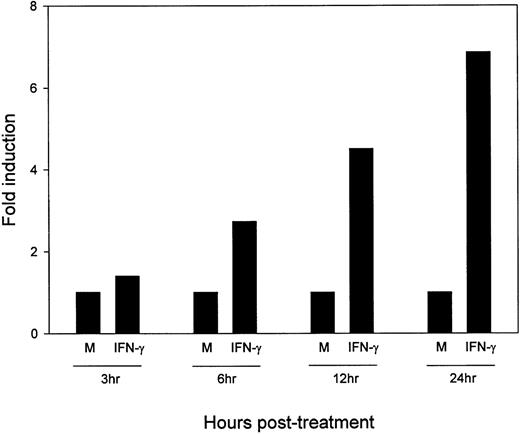
To determine the kinetics of upregulation of B7-2 mRNA by IFN-γ, MM6 cells were incubated in medium alone or with 500 U/mL of IFN-γ for the indicated lengths of time. Total RNA was extracted, and a Northern blot analysis was performed to detect B7-2 mRNA. As seen in Fig3, an early enhanced expression of the B7-2 mRNA was observed within 3 hours after stimulation with IFN-γ. Steady increases in B7-2 mRNA expression were noticed from 6 hours (a twofold increase) to 24 hours (a sevenfold increase) above the levels seen in medium-treated MM6 cells.
Kinetics of IFN-γ–induced upregulation of B7-2 mRNA. MM6 cells were stimulated in the presence or absence of 500 U/mL of IFN-γ for the indicated times. Total cellular RNA was isolated, and Northern blot analysis for B7-2 mRNA expression was performed. The same filter was subsequently probed with GAPDH to ensure that comparable amounts of RNA were loaded in each lane. Data shown are from 1 representative experiment of 2 performed. Northern blot analysis for B7-2 mRNA expression (upper panel). Quantitative analysis of B7-2 mRNA expression (lower panel). As explained in Materials and Methods, the bands’ intensities were normalized to the GAPDH housekeeping gene control, and the graph was generated with the relative values obtained after normalization.
Kinetics of IFN-γ–induced upregulation of B7-2 mRNA. MM6 cells were stimulated in the presence or absence of 500 U/mL of IFN-γ for the indicated times. Total cellular RNA was isolated, and Northern blot analysis for B7-2 mRNA expression was performed. The same filter was subsequently probed with GAPDH to ensure that comparable amounts of RNA were loaded in each lane. Data shown are from 1 representative experiment of 2 performed. Northern blot analysis for B7-2 mRNA expression (upper panel). Quantitative analysis of B7-2 mRNA expression (lower panel). As explained in Materials and Methods, the bands’ intensities were normalized to the GAPDH housekeeping gene control, and the graph was generated with the relative values obtained after normalization.
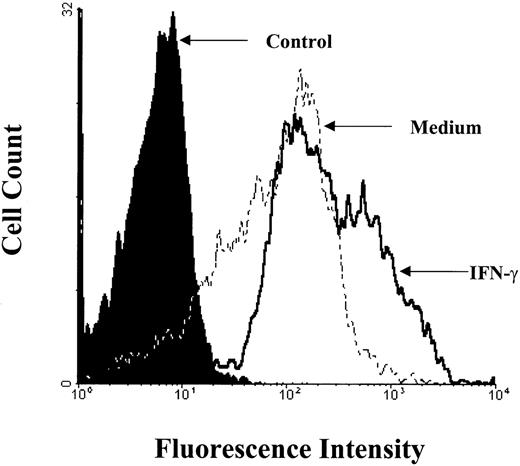
To evaluate whether the enhanced expression of B7-2 mRNA led to surface expression of B7-2, MM6 cells were cultured in the absence or presence of 500 U/mL of IFN-γ and analyzed by flow cytometry at 24 hours. As seen in Fig 4, medium-treated monocytic cells constitutively expressed low basal levels of B7-2 surface protein. Upon IFN-γ treatment, a threefold increase of B7-2 expression was observed over the MCFI of the control groups by 24 hours. Similar results were obtained in three different experiments with the IFN-γ–enhanced B7-2 expression, ranging from twofold to threefold. For any given experiment, between 50% to 70% of MM6 cells were positive for B7-2 surface expression, but no significant differences in the percentage of positive cells were observed between the IFN-γ–treated cells and the medium-treated controls (data not shown). These results indicate that IFN-γ–enhanced B7-2 mRNA expression in MM6 cells is associated with an increased expression of B7-2 protein on the surface of these cells.
B7-2 surface expression is enhanced by treatment with IFN-γ. MM6 cells were cultured for 24 hours in the presence or absence of 500 U/mL of IFN-γ. Cells were harvested and labeled for immunofluorescence analysis as described in Materials and Methods. Flow cytometry analysis was performed using an Elite flow cytometer. Closed histogram (in black) represents isotype-matched antibody control. Broken line histogram (-----) represents medium treated cells (MCFI = 16). Solid line histogram (_____) represents IFN-γ–treated cells (MCFI = 48). The MCFI values shown for medium- and IFN-γ–treated cells indicate the relative MCFI of the B7-2 staining monoclonal antibody after subtracting the MCFI of the isotype-matched antibody. Data shown are from 1 of 3 similar experiments.
B7-2 surface expression is enhanced by treatment with IFN-γ. MM6 cells were cultured for 24 hours in the presence or absence of 500 U/mL of IFN-γ. Cells were harvested and labeled for immunofluorescence analysis as described in Materials and Methods. Flow cytometry analysis was performed using an Elite flow cytometer. Closed histogram (in black) represents isotype-matched antibody control. Broken line histogram (-----) represents medium treated cells (MCFI = 16). Solid line histogram (_____) represents IFN-γ–treated cells (MCFI = 48). The MCFI values shown for medium- and IFN-γ–treated cells indicate the relative MCFI of the B7-2 staining monoclonal antibody after subtracting the MCFI of the isotype-matched antibody. Data shown are from 1 of 3 similar experiments.
The transcriptional activity of the B7-2 gene is enhanced by treatment with IFN-γ.
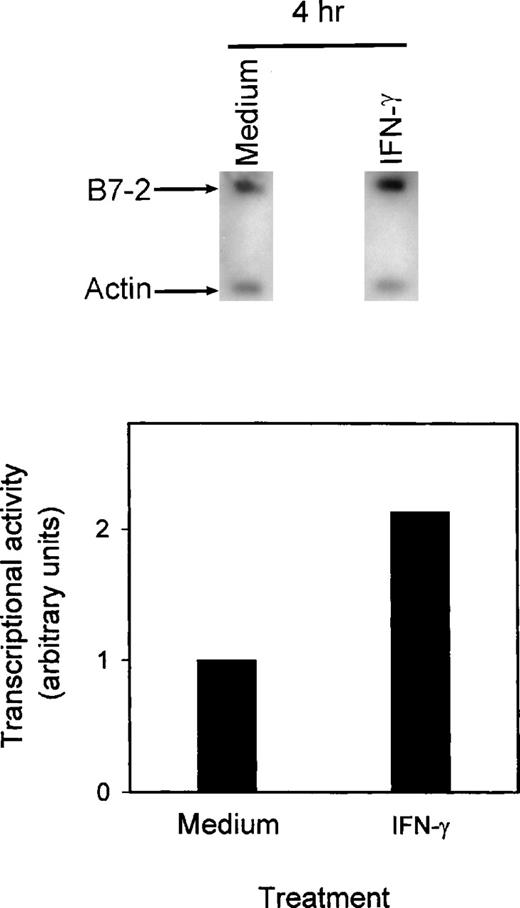
To investigate whether the increased expression of B7-2 by IFN-γ involved changes in B7-2 gene transcription, nuclear run-on experiments were performed. MM6 cells were incubated with medium alone or supplemented with 500 U/mL of IFN-γ. The nuclei were isolated at 2 hours and 4 hours after treatment, and nuclear run-on assays were performed. As seen in Fig 5, B7-2 gene was transcriptionally active in medium control cells. A twofold increase in the rate of transcription of the B7-2 gene was observed 4 hours after IFN-γ treatment. As early as 2 hours post–IFN-γ treatment, a moderate but reproducible increase in transcriptional activity was observed over the basal level of transcription of the medium-treated cells (data not shown).
IFN-γ augments B7-2 gene transcription. MM6 cells (5 × 10⁷ cells/point) were treated with medium alone or with 500 U/mL of IFN-γ. Nuclei were isolated at the indicated time points, and the rate of transcription of the B7-2 gene was then assessed by nuclear run-on analysis as described in Materials and Methods. Data presented are from 1 of 2 similar experiments. The graph was generated as described in Materials and Methods, with the relative values obtained after normalization of the bands’ intensities to the respective amounts of β-actin.
IFN-γ augments B7-2 gene transcription. MM6 cells (5 × 10⁷ cells/point) were treated with medium alone or with 500 U/mL of IFN-γ. Nuclei were isolated at the indicated time points, and the rate of transcription of the B7-2 gene was then assessed by nuclear run-on analysis as described in Materials and Methods. Data presented are from 1 of 2 similar experiments. The graph was generated as described in Materials and Methods, with the relative values obtained after normalization of the bands’ intensities to the respective amounts of β-actin.
IFN-γ enhances B7-2 mRNA stability.
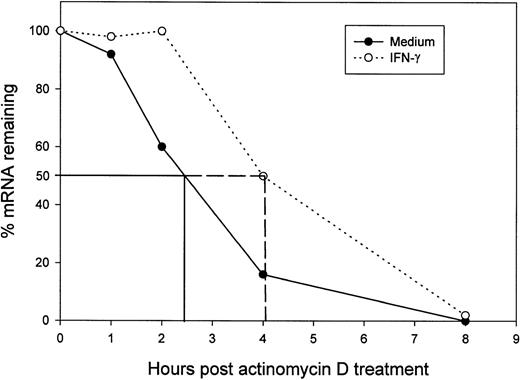
Experiments were performed to determine whether IFN-γ influenced the stability of B7-2 mRNA. MM6 cells were incubated for 18 hours with medium alone or supplemented with 500 U/mL of IFN-γ. After the 18-hour incubation period, Act-D was added to the cultures for the indicated lengths of time to block further RNA transcription. Northern blot analysis revealed that B7-2 mRNA decayed with different kinetics in untreated and IFN-γ–treated cells (Fig6). The level of B7-2 mRNA in medium-treated cells decreased by 50% (T½) after 2 hours and 20 minutes, and B7-2 mRNA became almost undetectable after 4 hours of Act-D treatment. On the other hand, IFN-γ–treated cells displayed an enhanced B7-2 mRNA stability resulting on a T½ of 4 hours. Similar results were observed in two independent experiments. Taken together, these results showed that IFN-γ enhancement of B7-2 gene expression in MM6 cells occurs through a dual mechanism involving transcriptional and posttranscriptional levels of regulation.
Treatment of MM6 cells with IFN-γ increases B7-2 mRNA stability. MM6 cells were incubated for 18 hours in medium alone or in medium supplemented with 500 U/mL of IFN-γ. After 18 hours, cells were treated with 5 μg/mL of Act-D, and their total cellular RNA was collected and analyzed by Northern blot for B7-2 mRNA expression at the indicated time points. Data shown are from 1 representative experiment of 2 performed. The graph was generated as described in Materials and Methods, and data are presented as the relative amounts of B7-2 mRNA remaining after adding Act-D and normalizing to the respective amounts of GAPDH.
Treatment of MM6 cells with IFN-γ increases B7-2 mRNA stability. MM6 cells were incubated for 18 hours in medium alone or in medium supplemented with 500 U/mL of IFN-γ. After 18 hours, cells were treated with 5 μg/mL of Act-D, and their total cellular RNA was collected and analyzed by Northern blot for B7-2 mRNA expression at the indicated time points. Data shown are from 1 representative experiment of 2 performed. The graph was generated as described in Materials and Methods, and data are presented as the relative amounts of B7-2 mRNA remaining after adding Act-D and normalizing to the respective amounts of GAPDH.
Protein synthesis is not required for the IFN-γ–induced upregulation of B7-2 mRNA.
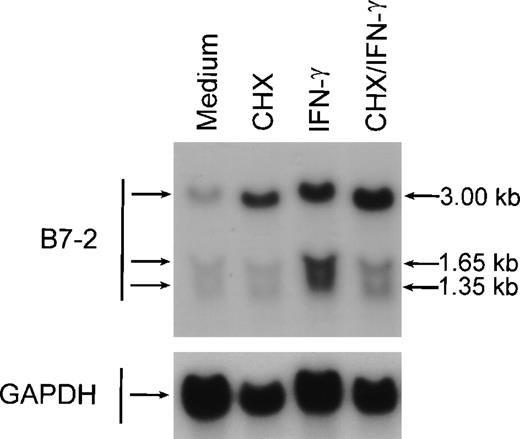
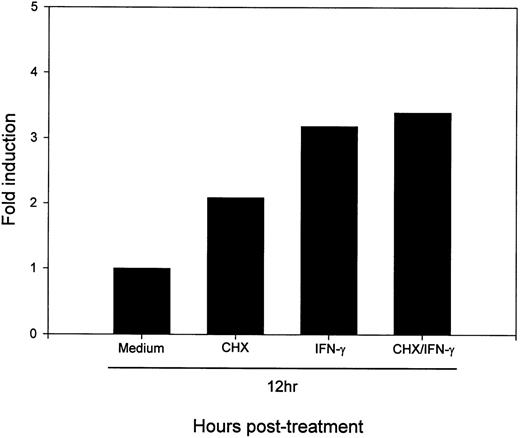
To determine whether active protein synthesis was necessary for the IFN-γ upregulation of B7-2 mRNA, MM6 cells were incubated for 12 hours in the absence or presence of 500 U/mL of IFN-γ and in the absence or presence of the protein-synthesis inhibitor CHX. As shown in Fig 7, the addition of CHX to IFN-γ–treated MM6 cells did not decrease the enhanced B7-2 mRNA expression. Noteworthy, addition of CHX to medium-treated MM6 cells caused a superinduction of the basal B7-2 mRNA expression. These results suggest that the IFN-γ–induced upregulation of B7-2 mRNA expression is not dependent on de novo protein synthesis.
De novo protein synthesis is not required for the IFN-γ–induced enhance expression of B7-2 mRNA. MM6 cells were incubated for 12 hours in the absence or presence of 500 U/mL of IFN-γ and in the absence or presence of 10 μg/mL of CHX. Total cellular RNA was extracted and analyzed by Northern blot for B7-2 mRNA expression (upper panel). Data shown are from 1 of 3 similar experiments. The graph represents the quantitative analysis of B7-2 mRNA expression (lower panel). As stated in Materials and Methods, the bands’ intensities were normalized to the GAPDH housekeeping gene control, and the graph was generated with the relative values obtained after normalization.
De novo protein synthesis is not required for the IFN-γ–induced enhance expression of B7-2 mRNA. MM6 cells were incubated for 12 hours in the absence or presence of 500 U/mL of IFN-γ and in the absence or presence of 10 μg/mL of CHX. Total cellular RNA was extracted and analyzed by Northern blot for B7-2 mRNA expression (upper panel). Data shown are from 1 of 3 similar experiments. The graph represents the quantitative analysis of B7-2 mRNA expression (lower panel). As stated in Materials and Methods, the bands’ intensities were normalized to the GAPDH housekeeping gene control, and the graph was generated with the relative values obtained after normalization.
IFN-γ enhances B7-2 mRNA expression in human peripheral blood monocytes.
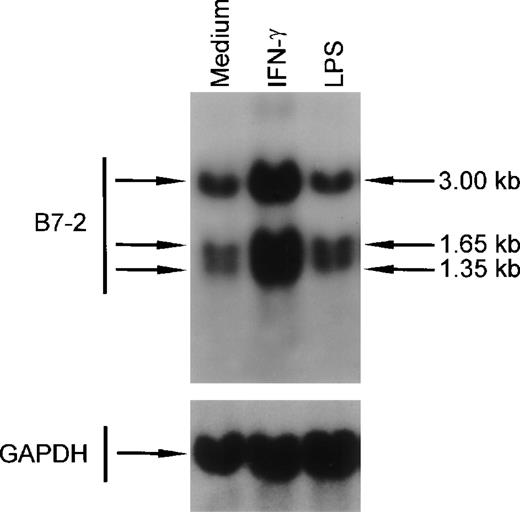
To determine whether the IFN-γ–induced changes in B7-2 mRNA expression seen in MM6 cells were also present in primary human monocytes, peripheral blood monocytes were cultured for 3 hours in medium alone or in the presence of either 500 U/mL of IFN-γ or 10 ng/mL of LPS. Total RNA was extracted, and Northern blot analysis was performed. As shown in Fig 8, a basal expression of B7-2 mRNA was detected in the medium-treated cells. IFN-γ–treated human monocytes displayed a major increase of B7-2 mRNA expression that led to an enhanced B7-2 surface expression (data not shown). On the other hand, the powerful monocyte activator LPS did not affect the basal level expression of B7-2 mRNA. These results remained unchanged up to 14 hours (data not shown).
IFN-γ treatment of human peripheral blood monocytes augments B7-2 mRNA expression. Human peripheral blood monocytes were cultured for 3 hours in medium alone or in the presence of either 500 U/mL of IFN-γ or 10 ng/mL of LPS. Total cellular RNA was extracted and analyzed by Northern blot for B7-2 mRNA expression. The same membrane was rehybridized with GAPDH to control that equal amounts of RNA were loaded in each lane. Data shown are from 1 representative experiment of 2 performed.
IFN-γ treatment of human peripheral blood monocytes augments B7-2 mRNA expression. Human peripheral blood monocytes were cultured for 3 hours in medium alone or in the presence of either 500 U/mL of IFN-γ or 10 ng/mL of LPS. Total cellular RNA was extracted and analyzed by Northern blot for B7-2 mRNA expression. The same membrane was rehybridized with GAPDH to control that equal amounts of RNA were loaded in each lane. Data shown are from 1 representative experiment of 2 performed.
DISCUSSION
Recent studies have shown that IFN-γ increases the expression of B7-2 in a number of different APCs,13,28,31-33 yet the mechanisms involved in this induction remain poorly understood. The present study provides the first look at the molecular mechanisms involved in the IFN-γ–enhanced expression of the B7-2 gene in human monocytic cells. The human monocytic cell line MM6 was used to study the effects of IFN-γ on B7-2 gene expression, given that these cells are phenotypically and functionally similar to mature human monocytes.29 Our data show that as little as 31 U/mL of IFN-γ was sufficient to induce an increase of B7-2 transcripts. B7-2 mRNA–enhanced accumulation was followed by an increased level of B7-2 surface expression, suggesting that IFN-γ–driven B7-2–enhanced surface expression is controlled, at least in part, at the gene level. To investigate whether the changes induced by IFN-γ in the MM6 monocytic cell line were also observed in primary cells, we performed Northern blot analysis in human monocytes. Our data showed that IFN-γ also rapidly upregulated the expression of B7-2 mRNA in human monocytes. Furthermore, the upregulated expression of B7-2 by IFN-γ was stimulus-specific and not associated with a general monocyte-activated phenotype, because a well-known monocyte activator LPS failed to upregulate B7-2 mRNA expression. IFN-γ–enhanced B7-2 expression was noticed as early as 3 hours and further augmented thereafter until 24 hours. The rapid upregulation of B7-2 mRNA in MM6 cells and primary cultured monocytes suggests a direct effect of IFN-γ on the expression of this gene rather than a secondary effect mediated by an IFN-γ inducible gene.
In an attempt to determine whether message stabilization was one of the mechanisms responsible for the enhanced B7-2 gene expression by IFN-γ, the T½ of the B7-2 mRNA was studied. After blocking new RNA synthesis with Act-D, B7-2 mRNA decayed at a slower rate in IFN-γ–treated MM6 cells than in medium-treated cells. These results clearly indicate that IFN-γ increased the T½ of the B7-2 transcripts and that this effect may contribute to the increased accumulation of B7-2 mRNA in MM6 cells. Rapid degradation of mRNAs encoding many oncogenes and cytokines are regulated in part by A+U-rich elements (AREs) in their 3′-untranslated regions (3′UTR).34,35 Proteins that bind to AREs in the 3′UTR of these messages control their stability, and by doing so, they also control the levels and timing of expression.34,35 Computer analysis of the published B7-2 mRNA sequence9 (accession number L25259) failed to reveal any AREs in the 3′UTR of B7-2 gene, suggesting that the increased stability of B7-2 mRNA observed in MM6 cells after IFN-γ treatment is not regulated or controlled by AREs. These results suggest that novel regulatory elements or mechanisms other than A+U-rich regions are responsible for the enhanced T½ of the B7-2 mRNA observed in IFN-γ–treated MM6 cells. Interestingly, a novel protein complex has recently been reported that binds to the 3′UTR of tumor necrosis factor-α (TNF-α) mRNA independently of the presence of AREs.36 37 This report and our present observation clearly suggest that other, yet to be identified, regulatory element(s) can control the stability of the mRNA. We are currently undertaking efforts to determine whether IFN-γ affects the protein binding pattern of the 3′UTR of B7-2 mRNA.
To further dissect the mechanism responsible for the IFN-γ–enhanced B7-2 mRNA expression, nuclear run-on experiments were performed. These in vitro transcription assays showed that B7-2 gene was transcriptionally active in medium-treated MM6 cells and that IFN-γ treatment further increased B7-2 gene rate of transcription. Our results provide the first evidence that IFN-γ can exert transcriptional control on this gene and that this effect contributes, at least in part, to the enhanced expression of B7-2 message seen in MM6 after IFN-γ stimulation.
The early IFN-γ–enhanced B7-2 mRNA expression in MM6 cells suggested a direct response independent of de novo protein synthesis. Inhibition, as well as superinduction of gene expression, have been reported in monocytes treated with different stimuli in the presence of the protein synthesis inhibitor CHX.38,39 Our data showed that treatment with CHX superinduced B7-2 mRNA basal expression. These results indicate that no new protein synthesis is required for the constitutive or IFN-γ–enhanced expression of B7-2 mRNA and suggest that B7-2 expression may be controlled by a de novo synthesized repressor protein(s) and/or by a factor(s) involved in regulation of mRNA stability. These two mechanisms have been previously suggested to be operating in the superinducibility of cytokine genes by CHX.39-41
The group of genes that are under direct transcriptional control of IFN-γ and that do not require the synthesis of new transcriptional factors for their expression are referred to as primary response genes.42-45 Some of the primary response genes are transcriptional factors themselves, such as interferon regulatory factor 1 (IRF-1), interferon regulatory factor 2 (IRF-2), MHC class II transactivator (CIITA), interferon consensus sequence binding protein (ICSBP), p48, γ-responsive factor 1 (γRF-1), and signal transducer and activator of transcription (STAT1α), which in turn regulate the expression of so-called secondary IFN-γ response genes.16 The rapid upregulation of B7-2 gene transcriptional activity by IFN-γ, independent of de novo protein synthesis, suggests a direct effect on the expression of this gene similar to that observed in primary response genes such as guanylate-binding protein (GBP), monokine induced by gamma interferon (mig), FcγRI, peptide transporter 1 (TAP1), and others.16Based on the published observations by others and our current results, it is tempting to speculate that B7-2 might be an IFN-γ primary response gene, and if so, its promoter should contain IFN-γ responsive elements. Although recently the 5′ untranslated region of the murine B7-2 gene was partially characterized, the human and murine B7-2 promoters remain elusive. We are currently undertaking efforts in our laboratory to further characterize the 5′ untranslated region of the human B7-2 gene.
The data presented here provides the first report dissecting the molecular mechanisms involved in the IFN-γ–induced B7-2 gene upregulation. We clearly showed that through processes not requiring new protein synthesis, a dual mechanism involving transcriptional and posttranscriptional changes is responsible for the enhanced expression of B7-2 mRNA in IFN-γ–treated MM6 cells. This complex and tight regulation of B7-2 gene expression underscores its relevance in the immune response and may provide monocytic cells with the capacity to quickly upregulate the expression of B7-2.
One of the novel therapeutic approaches that is currently being explored against malignancies is the manipulation of costimulatory molecules expressed on APCs or on tumor cells engineered to act as APCs in the context of cancer vaccines. Costimulation of T cells by B7-2 may play a critical role in determining the outcome of the immune response that may range from immunity to tolerance. Therefore, understanding the mechanisms regulating B7-2 expression is particularly important because it may provide a rational basis for the development of novel anticancer therapeutic modalities. The complex nature of the B7-2 gene regulation and its pivotal role in T-cell costimulation warrant further investigation of the transcriptional and posttranscriptional events controlling its expression.
ACKNOWLEDGMENT
The authors thank Dr Paul L. Fidel, Jr, Dr Ronald B. Luftig, and Dr James M. Mwatibo for their critical review of this manuscript. They also thank Dr Gordon Freeman for kindly providing the human B7-2 cDNA, Cynthia G. Healy for generating the flow cytometry histogram figure for this paper, and Marilyn Schoen, RN, for performing cytapheresis.
The publication costs of this article were defrayed in part by page charge payment. This article must therefore be hereby marked “advertisement” in accordance with 18 U.S.C. section 1734 solely to indicate this fact.
REFERENCES
Author notes
Address reprint requests to I. Espinoza-Delgado, MD, 1542 Tulane Ave, Hematology-Oncology Suite 604K, New Orleans, LA 70112; e-mail:iespin@lsumc.edu.


This feature is available to Subscribers Only
Sign In or Create an Account Close Modal