Abstract
It has been suggested that the ratio of Bcl-2 family proapoptotic proteins to antiapoptotic proteins determines the sensitivity of leukemic cells to apoptosis. However, it is believed that Bcl-2 family proteins exert their function on apoptosis only when they target to the mitochondrial outer membrane. The vinblastine-resistant T-lymphoblastic leukemic cell line CEM/VLB100 has increased sensitivity to tumor necrosis factor- (TNF-)–induced cytochrome crelease, mitochondrial respiratory inhibition, and consequently apoptosis, compared with parental CEM cells. However, there was no difference between the two cell lines in the expression of Bcl-2 family proteins Bcl-2, Bcl-XL, Bcl-XS, Bad, and Bax at the whole cell level, as analyzed by Western blotting. Bcl-2 mainly located to mitochondria and light membrane as a membrane-bound protein, whereas Bcl-XL was located in both mitochondria and cytosol. Similar levels of both Bcl-2 and Bcl-XL were present in the resting mitochondria of the two cell lines. Although the proapoptotic proteins Bcl-XS, Bad, and Bax were mainly located in the cytosol, CEM/VLB100 mitochondria expressed higher levels of these proapoptotic proteins. Subcellular redistribution of the Bcl-2 family proteins was detected in a cell-free system by both Western blotting and flow cytometry after exposure to TNF-. The levels of Bcl-2 family proteins were not altered at the whole cell level by TNF-. However, after exposure to TNF-, Bax, Bad, and Bcl-XS translocated from the cytosol to the mitochondria of both cell lines. An increase in Bcl-2 levels was observed in CEM mitochondria, which showed resistance to TNF-–induced cytochrome c release. By contrast, decreased mitochondrial Bcl-2 was observed in CEM/VLB100 cells, which released cytochrome c from the mitochondria and underwent apoptosis as detected by fluorescence microscopy. We conclude that mitochondrial levels of Bcl-2 family proteins may determine the sensitivity of leukemic cells to apoptosis and that, furthermore, these levels may change rapidly after exposure of cells to toxic stimuli.
Bcl-2, Bcl-X (Bcl-XL and Bcl-XS), Bad, and Bax are members of the Bcl-2 family proteins that play important roles in regulating cell survival and apoptosis. Antiapoptotic members such as Bcl-2 and Bcl-XLprevent apoptosis in response to a wide variety of stimuli.1-7 Conversely, proapoptotic proteins, Bad, Bax, and Bcl-XS, can accelerate death and in some instances are sufficient to cause apoptosis.8-12 The ratio of Bcl-2 family proapoptotic to antiapoptotic proteins dictates the susceptibility of cells to a variety of apoptotic stimuli13,14 and is an important determinant of the sensitivity of leukemic cells to apoptosis induced by chemotherapeutic or immunotherapeutic agents.15-17
A major pathway of apoptosis has been shown that is controlled at the mitochondrial level. During apoptosis, cytochrome c, which is normally located in the mitochondrial intermembrane space, is released. Together with other cytosolic factors, cytochrome c can trigger the activation of caspase-3 (CPP32) in a cell-free system.1,2,18-20 Functional Bcl-2 family proteins exert many of their effects when they locate to the mitochondrial outer membrane. Overexpression of Bcl-2 or Bcl-XL inhibits apoptosis by blocking the release of cytochromec.1-4 Bax targeted to mitochondria can trigger rapid release of cytochrome c.7 21 However, the expression of Bcl-2 family proteins at the mitochondrial level has not been considered as an important determinant of the sensitivity of leukemic cells to apoptosis.
Bcl-2, Bcl-XL, Bcl-XS, and Bax possess a carboxyterminal transmembrane (TM) region that is believed to serve as a membrane anchor. However, Bad does not contain a TM region.22 As a result Bcl-2, Bcl-XL, and Bcl-XS locate to the mitochondrial outer membrane, nuclear envelope, and endoplasmic reticulum.10,23-25 However, Bcl-XL and Bcl-XS have also been identified in the cytosol.10,11 It has been suggested that Bax targets to organelle membranes,26 and in particular to mitochondria,27 by its TM region. It has been recently observed that Bax is present predominantly in the cytosol in the resting state and moves to mitochondria during exposure to proapoptotic stimuli.11,12 Although Bad does not contain a TM region, unphosphorylated Bad can heterodimerize with Bcl-XL at mitochondrial membrane sites to promote cell death.28 29
We have previously shown that the vinblastine-resistant cell line, CEM/VLB100, has increased sensitivity to TNF-α–induced mitochondrial respiratory inhibition, mitochondrial ultracondensation, and consequently apoptosis, compared with parental CEM cells.30-32 In this study, we examined the ratio of Bcl-2 family proapoptotic to antiapoptotic proteins at both whole cell and mitochondrial levels. We postulate that the sensitivity of leukemic cells to apoptosis can be determined by Bcl-2 family protein expression at the mitochondrial level. We describe that cells reset the ratio of mitochondrial proapoptotic protein to antiapoptotic protein in response to TNF-α.
MATERIALS AND METHODS
Materials.
Monoclonal mouse anti–Bcl-2 (100), polyclonal rabbit anti–Bcl-XS/L (S-18), and polyclonal rabbit anti-Bax (P-19) antibodies were from Santa Cruz Biotechnology Inc (Santa Cruz, CA). Monoclonal mouse anti-Bad antibody (48) was from Transduction Lab (Lexington, KY). Native monoclonal mouse anti-cytochrome cantibody (6H2.B4) was purchased from PharMingen (San Diego, CA). MitoTracker red CMXRos and 3,3′-dihexyloxacarbocyanine iodide (DiOC6[3]) were from Molecular Probes Inc (Eugene, OR). Monoclonal mouse anti–β-actin (AC-74) antibody, TNF-α, DAPI, carbonyl cyanide m-chlorophenylhydrazone (CCCP), and all the chemicals were from Sigma (Poole, UK).
Cell lines and the preparation of subcellular fractions.
The human T-lymphoblastic CEM and its vinblastine-resistant subclone CEM/VLB100 leukemia cell lines were used in this study. Cell culture was as previously described.30 Leukemia cells (5 × 10⁷) were washed with Ca2+ and Mg2+-free phosphate-buffered saline (PBS) and resuspended in 1 mL of buffer A (250 mmol/L sucrose, 10 mmol/L HEPES-KOH, pH 7.4, 2 mmol/L NaCl, 2.5 mmol/L KH2PO4, 0.5 mmol/L EGTA, 2 mmol/L MgCl2, 5 mmol/L pyruvate, 1 mmol/L DTT, 0.1 mmol/L phenylmethylsulfonyl fluoride [PMSF], 20 μmol/L cytochalasin B, 2 mmol/L adenosine triphosphate [ATP], 10 mmol/L phosphocreatine, 50 μg/mL creatine phosphokinase) and incubated for 20 minutes on ice. Cells were then broken with a glass Dounce homogenizer (Jencons, Leighton Buzzard, UK). After pelleting the nuclei, 790g for 10 minutes at 4°C, the post-nuclear supernatant was further spun at 10,000g for 10 minutes at 4°C. The crude mitochondrial pellet was purified by passing a gradient sucrose (0.1 to 0.3 mol/L) cushion at 9,000g for 8 minutes to purify mitochondria. The purity of mitochondria was determined by Western blotting as being β-actin negative. The supernatant (S10 fraction) was further ultracentrifuged at 16,000g and then filtered by passing through a 0.22-μm Ultrafilter (Sigma) to get purified cytosol. Light membrane was obtained from a pellet of S10 fraction and the membrane on the ultrafilter, which was identified as the RNA positive and cytochrome c negative fraction. Protein concentration was measured using Bradford reagent (Bio-Rad, Hertfordshire, UK).
Western blotting.
Whole cells, purified mitochondria, or light membrane was lysed in lysis buffer (1% Triton X-100, 0.5% sodium deoxycholate, 0.1% sodium dodecyl sulfate (SDS), 1 mmol/L PMSF, 1 mmol/L DTT, 10 μg/mL aprotinin, 10 μg/mL leupeptin, 1 mmol/L sodium orthovanadate in PBS, pH 7.4) for 30 minutes at 4°C. Lysed cells or mitochondria were then centrifuged at 16,000g for 30 minutes at 4°C. Protein extracts were further mixed with sample buffer (187.5 mmol/L Tris-HCl, pH 6.8, 6% SDS, 15% β-mercaptoethanol, 30% glycerol, 0.006% bromophenol blue) and heated at 100°C for 3 minutes. Fifty micrograms of protein was subjected to 12% sodium dodecyl sulfate-polyacrylamide gel electrophoresis (SDS-PAGE) gel, followed by transfer to nitrocellulose membrane (Bio-Rad). The blot was blocked by 5% nonfat milk and probed with anti–Bcl-2 antibody (1:100 dilution), anti–Bcl-XS/L antibody (1:200 dilution), anti-Bad antibody (1:500 dilution), or anti-Bax (1:200 dilution) and anti-β-actin (1:10,000 dilution) antibodies. Secondary probes constituted horseradish peroxidase (HRP)-labeled anti-mouse antibody (1:2,000 dilution, Santa Cruz) or anti-rabbit antibody (1:3,000 dilution, Santa Cruz). Filters were washed three times with 0.05% Tween-20 (for monoclonal anti-mouse antibody) or 0.1% Tween-20 (for polyclonal anti-rabbit antibody) containing PBS. Specific protein complexes were identified using the “SuperSignal” enhanced chemiluminescence (ECL) reagent (Pierce, Rockford, IL). Rainbow markers (Amersham, Little Chalfont, UK) served as standard molecular weights. Relative densitometry analysis of autoradiographs was based on integrated density percentage value using an AlphaImager 2000 scanner fitted with AlphaEase Stand Alone software (Alpha Innotech Corp, San Jose, CA).
Flow cytometry of isolated mitochondria.
To measure Bcl-2 expression, mitochondria were blocked by incubation with 1% bovine serum albumin (BSA) in buffer B (225 mmol/L mannitol, 75 mmol/L sucrose, 10 mmol/L KCl, 10 mmol/L Tris-HCl, 5 mmol/L KH2PO4, pH 7.2) for 30 minutes on ice and washed with buffer B. Twenty microliters of mitochondrial suspension in buffer B (containing 0.1% BSA) was then incubated with 0.5 μg of primary anti–Bcl-2 antibody or 0.5 μg of control antibody for 30 minutes on ice. After one wash, mitochondria were resuspended with 0.5 μg of fluorescein isothiocyanate (FITC)-conjugated anti-mouse antibody and incubated for 30 minutes on ice, washed, and resuspended in 1mL of buffer B for flow cytometry analysis using the Lysys II software package on a FACScan flow cytometer (Becton Dickinson, Oxford, UK). To measure mitochondrial membrane potential (ΔΨm), mitochondria were suspended in buffer B and incubated with 80 nmol/L DiOC6(3) for 15 minutes at 37°C followed by analysis on a FACScan flow cytometer.
Immunofluorescence analysis of cytochrome c release.
To colocalize cytochrome c in mitochondria, intact cells were first labeled with the mitochondrion-specific dye, MitoTracker red CMXRos. Cells in culture medium were incubated with MitoTracker CMXRos (100 nmol/L for the CEM cell line, 150 nmol/L for the CEM/VLB100 cell line) at 37°C for 30 minutes. Cells were washed twice with Ca2+/Mg2+-free PBS and resuspended in 10% FCS containing culture medium. One hundred fifty microliters of cell suspension (5 × 10⁵ cells/mL) was cytocentrifugated onto a microscope slide using a Shandon Southern Cytospin (Pittsburgh, PA) centrifuge at 1,200 rpm for 3 minutes. Slides were air dried, permeabilized, and fixed in 4% paraformaldehyde/0.05% saponin in Ca2+/Mg2+-free PBS for 15 minutes. Cells were then washed twice in 0.03% saponin containing PBS and incubated in a blocking solution (1% BSA, 1% normal goat serum, and 0.1% Tween-20 in PBS) for 30 minutes. After washing once, cells were incubated with the anti-cytochrome c antibody 6H2.B4 (25 μg/mL) diluted in blocking solution for 2 hours at room temperature in a humidified chamber. Cells were washed in PBS then incubated with FITC-conjugated anti-mouse secondary antibody (Sigma) at a 1:10 dilution in blocking solution for 1 hour in the dark. Cells were rinsed three times in PBS, then incubated with 50 ng/mL DAPI-containing PBS for 1 minute. Slides were air dried at 4°C in the dark and mounted in Immuno-Mount solution (Shandon) and viewed under a Zeiss Axioskop fluorescence microscope (Zeiss, Germany) attached to a CCD camera (Photometric Ltd, Tucson, AZ) driven by IPLLabs Spectrum and SmartCapture (Cambridge, UK) software. The filter wheel was set at Texas red (excitation 540 to 580 nm/emission 600 to 660 nm), fluorescein (excitation 465 to 495 nm/emission 515 to 555 nm), and DAPI (excitation 310 to 380 nm/emission 435 to 485 nm). Photographs for the triple labeling experiments were taken through triple exposure.
RESULTS
The expression of Bcl-2 family proteins in TNF-sensitive and TNF-resistant cell lines at the whole cell level.
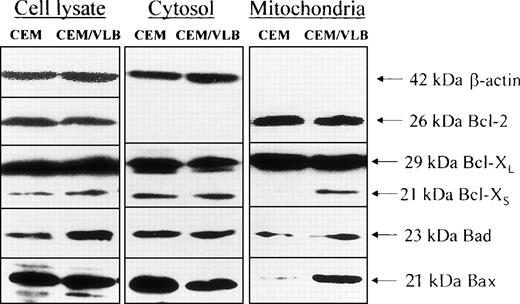
We initially proposed that the differential sensitivity between the two cell lines might be due to the different levels of Bcl-2 family death proteins or survival proteins. However, using Western blotting with densitometry, it was observed (Fig 1) that the total cellular expression of Bcl-2, Bcl-XL, and Bax between the two cell lines was similar. The TNF-sensitive CEM/VLB100 cell line did express higher levels of the death proteins, Bcl-XS and Bad, compared with the parental CEM.
The expression of Bcl-2 family proteins at the whole cell level and subcellular distribution. Resting CEM and CEM/VLB100 cells were dissolved with 1% Triton X-100 containing lysis buffer. Protein extract (50 μg/lane) was loaded on to 12% SDS-PAGE, transferred to nitrocellulose membrane, and probed with indicated anti–Bcl-2 family protein antibodies. β-Actin served as protein quality control with each experiment. The density of each band was analyzed by densitometry. For whole cell lysate, the ratio CEM:CEM/VLB100 for Bcl-XS = 29:71 (1:2.4); ratio CEM:CEM/VLB100 for Bad = 38:62 (1:1.6). For mitochondria protein, ratio CEM:CEM/VLB100 for Bcl-XS = 3:97 (1:32); ratio CEM:CEM/VLB100for Bad = 38:62 (1:1.6); ratio CEM:CEM/VLB100 for Bax = 12:88 (1:7.3). For the cytosol proteins, ratio CEM:CEM/VLB100 for Bax = 62:38 (1.6:1).
The expression of Bcl-2 family proteins at the whole cell level and subcellular distribution. Resting CEM and CEM/VLB100 cells were dissolved with 1% Triton X-100 containing lysis buffer. Protein extract (50 μg/lane) was loaded on to 12% SDS-PAGE, transferred to nitrocellulose membrane, and probed with indicated anti–Bcl-2 family protein antibodies. β-Actin served as protein quality control with each experiment. The density of each band was analyzed by densitometry. For whole cell lysate, the ratio CEM:CEM/VLB100 for Bcl-XS = 29:71 (1:2.4); ratio CEM:CEM/VLB100 for Bad = 38:62 (1:1.6). For mitochondria protein, ratio CEM:CEM/VLB100 for Bcl-XS = 3:97 (1:32); ratio CEM:CEM/VLB100for Bad = 38:62 (1:1.6); ratio CEM:CEM/VLB100 for Bax = 12:88 (1:7.3). For the cytosol proteins, ratio CEM:CEM/VLB100 for Bax = 62:38 (1.6:1).
Subcellular distribution of Bcl-2 family proteins in the resting state.
We were next interested in whether the distribution of Bcl-2 family proteins in mitochondria was consistent with the whole cell levels. Leukemic cells were broken with a homogenizer in the absence of detergent. The postmitochondrial supernatant (or S10), which contains light membrane (endoplasmic reticulum, nuclear envelope, and Golgi complex), was removed by ultrafiltration. The subcellular distribution of Bcl-2 family proteins, such as Bcl-2, Bcl-XL, Bcl-XS, Bad, and Bax, were analyzed in both purified cytosol and mitochondria. Bcl-2 mainly located to mitochondria and was not present in the cytosol as a soluble protein (Fig 1). However, Bcl-2 protein was also detected in the postmitochondrial supernatant containing light membrane (results not shown). Bcl-XLdistributed in both mitochondria as a membrane-bound protein and cytosol as a soluble protein. The expression of the antiapoptotic proteins, Bcl-2 and Bcl-XL, were similar between the two cell lines in both cytosol and mitochondria. The proapoptotic proteins, Bcl-XS, Bad, and Bax, mainly located to the cytosol. Interestingly, cells of the TNF-α–sensitive CEM/VLB100cell line expressed more Bcl-XS, Bad, and Bax in their mitochondria than the CEM cell line. The cytosolic expression of Bcl-XS and Bad was similar between two cell lines. Thus, it appears that the increased expression of Bcl-XS and Bad in the CEM/VLB100 cell line at the whole cell level is due to higher levels of these proteins in the mitochondria. Bax expression was lower in the cytosol and higher in the mitochondria in the CEM/VLB100 cell line compared with the CEM cell line. These results suggest that the ratio of death protein to survival protein at the mitochondrial level is different from the whole cell level. The increased susceptibility of CEM/VLB100 mitochondria to TNF-α–induced respiratory inhibition30 may be partly due to higher levels of these death proteins.
The redistribution of Bcl-2 proteins in response to TNF-α treatment.
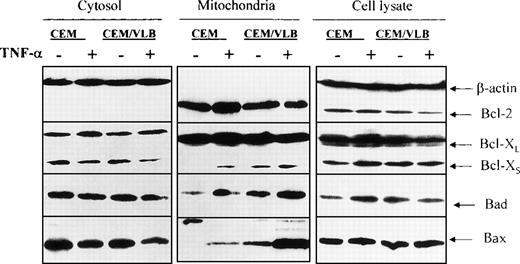
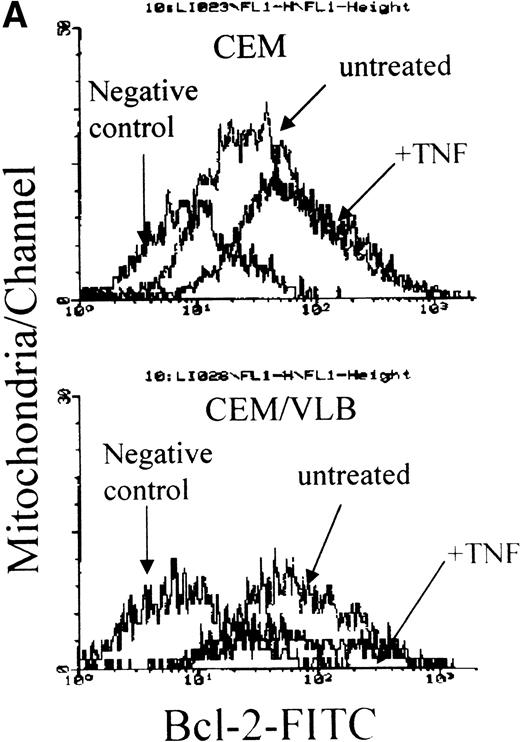
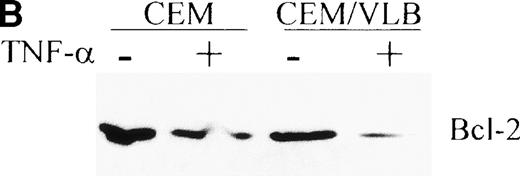
We have suggested that redistribution of the Bcl-2 family proteins might occur when leukemic cells are exposed to TNF-α. Cells were treated with 250 U/mL (12.5 ng/mL) TNF-α for 3 hours. This concentration of TNF-α has been reported to induce apoptosis in the CEM/VLB100 cell line at 3 hours31 in the absence of cell membrane leakage.30 Minimal apoptosis is seen in the CEM cell line at this time point. The whole cell population (including apoptotic and nonapoptotic cells) was obtained for the preparation of cytosol and mitochondria. Redistribution of the proapoptotic proteins, Bcl-XS, Bad, and Bax, from the cytosol to mitochondria was clearly seen in both cell lines (Fig 2). After exposure to TNF-α, TNF-sensitive CEM/VLB100 cells expressed more Bcl-XS, Bad, and Bax in their mitochondria compared with CEM cells (Fig 2). TNF-α did not alter the distribution of Bcl-XL. Bcl-XS translocation from cytosol to mitochondria was not accompanied by Bcl-XL, suggesting that Bcl-XLand Bcl-XS do not always share the same location. Increased levels of Bcl-2 protein were seen in the mitochondria of the TNF-α–resistant CEM cell line after TNF-α treatment (control:TNF = 41:59). However, a reduction in Bcl-2 protein was seen in the TNF-sensitive CEM/VLB100 mitochondria (control:TNF = 54:46) (Figs 2 and 3A). Using flow cytometry, we found that Bcl-2, Bcl-X, Bad, and Bax were all detected on the mitochondrial outer membrane (data not shown). We also confirmed that Bcl-2 translocated to the mitochondrial outer membrane of CEM cells after TNF-α treatment as shown by flow cytometry. As described above, there was no detectable soluble Bcl-2 protein in the cytosol of either cell line. Using crude cytosol (S10), which contains light membrane, we detected a reduction in Bcl-2 levels after exposure to TNF-α (Fig3B). This suggests that the increased Bcl-2 in the CEM mitochondria may have moved from the light membrane, possibly from the rough endoplasmic reticulum (RER). It is unclear why decreased Bcl-2 levels were seen in both the light membrane and mitochondria of the CEM/VLB100cell line during TNF-α–induced apoptosis.
TNF-–induced Bcl-2 family protein redistribution. Cells were treated with 250 U/mL TNF- for 3 hours. Whole cell lysate and cellular fractions were prepared, and the same amount of protein (50 μg/lane) was analyzed by Western blotting. Ratios of mitochondrial Bcl-2 family proteins after exposure to TNF- are CEM:CEM/VLB100 for Bcl-XS = 33:67 (1:2); CEM:CEM/VLB100 for Bad = 36:64 (1:1.8); and for Bax = 12:88 (1:7.3). At the whole cell level, the CEM cell line the ratio of control:TNF for Bcl-XS = 37:63 (1:1.7); control:TNF for Bad = 29:71 (1:2.4); and the CEM/VLB100cell line the ratio of control:TNF for Bcl-2 = 59:41 (1.4:1).
TNF-–induced Bcl-2 family protein redistribution. Cells were treated with 250 U/mL TNF- for 3 hours. Whole cell lysate and cellular fractions were prepared, and the same amount of protein (50 μg/lane) was analyzed by Western blotting. Ratios of mitochondrial Bcl-2 family proteins after exposure to TNF- are CEM:CEM/VLB100 for Bcl-XS = 33:67 (1:2); CEM:CEM/VLB100 for Bad = 36:64 (1:1.8); and for Bax = 12:88 (1:7.3). At the whole cell level, the CEM cell line the ratio of control:TNF for Bcl-XS = 37:63 (1:1.7); control:TNF for Bad = 29:71 (1:2.4); and the CEM/VLB100cell line the ratio of control:TNF for Bcl-2 = 59:41 (1.4:1).
TNF- induced Bcl-2 protein translocation from light membrane to the mitochondrial outer membrane. CEM and CEM/VLB100 cells were treated with 250 U/mL TNF- for 3 hours. (A) Freshly isolated mitochondria were blocked with BSA, labeled with anti–Bcl-2 antibody, FITC-conjugated anti-mouse antibody, and analyzed with flow cytometry. Control mouse IgG served as a negative control. (B) Light membrane was dissolved with lysis buffer, and 50 μg protein was used for Western blotting. Protein concentration of light membrane was confirmed by Bradford assay and by measuring optical density 280 nm at 260 nm (RNA concentration). Ratio of Bcl-2, control:TNF for CEM = 61:39 (1.6:1) for CEB/VLB100=75:25 (3:1).
TNF- induced Bcl-2 protein translocation from light membrane to the mitochondrial outer membrane. CEM and CEM/VLB100 cells were treated with 250 U/mL TNF- for 3 hours. (A) Freshly isolated mitochondria were blocked with BSA, labeled with anti–Bcl-2 antibody, FITC-conjugated anti-mouse antibody, and analyzed with flow cytometry. Control mouse IgG served as a negative control. (B) Light membrane was dissolved with lysis buffer, and 50 μg protein was used for Western blotting. Protein concentration of light membrane was confirmed by Bradford assay and by measuring optical density 280 nm at 260 nm (RNA concentration). Ratio of Bcl-2, control:TNF for CEM = 61:39 (1.6:1) for CEB/VLB100=75:25 (3:1).
We also examined whether TNF-α induces changes in Bcl-2 family proteins at the whole cell level. The expression of Bcl-XLand Bax at the whole cell level did not change after TNF-α treatment (Fig 2). Increased expression of Bcl-XS and Bad was seen in the CEM cell line after treatment with TNF-α. However, a reduction in Bcl-2 was observed in the CEM/VLB100 cell line after TNF-α treatment, as was also seen by the reductions in both mitochondrial and light membrane levels. Although slight differences were detected at the whole cell level with or without TNF-α treatment, such changes were not as great as those were at the mitochondrial level.
TNF-α–induced cytochrome c release only occurred in the CEM/VLB100 cell line.
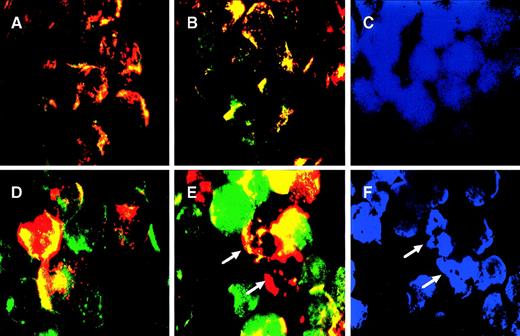
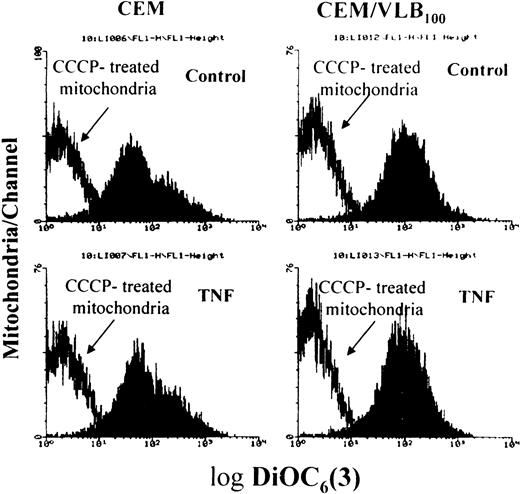
TNF-α–induced targeting of BCL-2 family death proteins to mitochondria was observed in both CEM and CEM/VLB100 cell lines. We were therefore interested in whether death protein targeting was associated with cytochrome c release from mitochondria. We developed a triple staining method to identify cytochrome crelease. Mitochondria in the living cells were first stained with a red mitochondrion-selective vital dye, MitoTracker,33 and then cytochrome c was stained green. MitoTracker staining has also been used to assess ΔΨm.34 Cytochrome c in control cells localized to mitochondria, as red and green merged pixels appeared orange/yellow (Fig 4A and D). However, not all CEM/VLB100 cells took up MitoTracker, probably due to overexpression of the P-glycoprotein in the cell membrane. Cells that did not take up MitoTracker displayed punctuate green staining in their mitochondria (Fig 4D). After exposure to TNF-α for 3 hours, no cytochrome c release was observed in the CEM cell line, as the cytochrome c distribution in TNF-treated CEM cells was similar to that of untreated cells (Fig 4B). By contrast, TNF-induced cytochrome c release was distinct in the CEM/VLB100 cell line as shown by the green-labeled cytochrome c image separating from the mitochondria with a clearly diffuse pattern (Fig 4E). Nuclei were stained with DAPI and the apoptotic cells were identified as cells containing condensed and fragmented nuclei (Fig 4C and F). Mitochondria in the apoptotic cells did not contain cytochrome c, as shown by the fact the mitochondria were stained only with a red color (Fig 4E). Mitochondria were well stained with MitoTracker in the apoptotic cells (Fig 4E), suggesting that TNF-α–induced ΔΨm depolarization did not occur before nuclear fragmentation. Staining isolated mitochondria from TNF-α–treated cells with DiOC6(3), it was confirmed that TNF-α–induced ΔΨm reduction did not occur in either cell lines, as mitochondria treated with or without TNF-α showed similar response to ΔΨm depolarization induced by the uncoupler CCCP (Fig 5). Enhanced MitoTracker dye uptake was seen in the CEM/VLB100 cell line after TNF-α stimulation, possibly indicating inhibition of the P-glycoprotein efflux pump due to decreased ATP supply by a dysfunctional mitochondrial electron transport chain. These results indicate that CEM mitochondria are more resistant to TNF-α–induced cytochromec release than those of the CEM/VLB100 cell line. The differential sensitivity of the mitochondria in the two cell lines to cytochrome c release may be due, in part, to the ratio of Bcl-2 family death proteins to survival proteins in both resting state and following stimulation with apoptosis-inducing agents.
TNF- induced cytochrome c release from mitochondria. CEM cells (A through C) and CEM/VLB100 cells (D through F) were incubated with or without 250 U/mL TNF- for 3 hours, labeled with MitoTracker, fixed, permeabilized, stained with native anti-cytochrome c antibody, and finally counterstained with DAPI as described in Materials and Methods. The stained cells were examined by fluorescence microscopy. Cytochrome c antibody was visualized with a fluorescent-conjugated anti-mouse IgG and assigned the color green, whereas mitochondria labeled with MitoTracker were assigned the color red. In the control cells (A and D) and CEM cells treated with TNF- for 3 hours (B), red and green images were merged; overlapping red and green pixels appears orange/yellow. CEM/VLB100 cells treated with TNF- for 3 hours displayed separation of the green (cytochrome c) from the mitochondria (red) with appearance in the cytosol (E and F). C and F are cells similar to B and E but counterstained with the nuclear dye DAPI. Cells with condensed and/or fragmented nuclei are apoptotic cells (arrows).
TNF- induced cytochrome c release from mitochondria. CEM cells (A through C) and CEM/VLB100 cells (D through F) were incubated with or without 250 U/mL TNF- for 3 hours, labeled with MitoTracker, fixed, permeabilized, stained with native anti-cytochrome c antibody, and finally counterstained with DAPI as described in Materials and Methods. The stained cells were examined by fluorescence microscopy. Cytochrome c antibody was visualized with a fluorescent-conjugated anti-mouse IgG and assigned the color green, whereas mitochondria labeled with MitoTracker were assigned the color red. In the control cells (A and D) and CEM cells treated with TNF- for 3 hours (B), red and green images were merged; overlapping red and green pixels appears orange/yellow. CEM/VLB100 cells treated with TNF- for 3 hours displayed separation of the green (cytochrome c) from the mitochondria (red) with appearance in the cytosol (E and F). C and F are cells similar to B and E but counterstained with the nuclear dye DAPI. Cells with condensed and/or fragmented nuclei are apoptotic cells (arrows).
TNF- did not induce ▵Ψm reduction. After cells had been treated with TNF- for 3 hours, isolated mitochondria were incubated with or without 50 μmol/L uncoupler CCCP for 15 minutes at 37°C, followed by labeling with the ▵Ψm-sensitive dye DiOC6(3).
TNF- did not induce ▵Ψm reduction. After cells had been treated with TNF- for 3 hours, isolated mitochondria were incubated with or without 50 μmol/L uncoupler CCCP for 15 minutes at 37°C, followed by labeling with the ▵Ψm-sensitive dye DiOC6(3).
DISCUSSION
In this study, we analyzed the subcellular distribution of Bcl-2 family proteins in leukemic cells with differential sensitivity to apoptosis. We proposed that the sensitivity of leukemic cells to TNF-α–induced cytochrome c release and mitochondrial dysfunction may rely on the ratio of Bcl-2 family death proteins to survival proteins at the mitochondrial level. Despite extensive study of the relationship between the expression of Bcl-2 family proteins and the sensitivity of leukemic cells to apoptosis, controversy persists, and the importance of the subcellular distribution of Bcl-2 family proteins has only recently received attention. The observation that overexpression of Bcl-2 and Bcl-XL in the mitochondrial outer membrane prevents apoptosis by blocking cytochrome c release highlights the importance of the mitochondrial location of the Bcl-2 family proteins in the regulation of apoptosis.1-4
The CEM/VLB100 cell line is more susceptible to TNF-α–induced apoptosis than the parent CEM cell line.31,32 TNF-α inhibits the mitochondrial electron transport chain (ETC)30 and induces mitochondrial ultracondensation31 and cytochrome crelease from mitochondria to a greater extent in the CEM/VLB100 cell line. We therefore proposed that the increased susceptibility of the CEM/VLB100 cell line to TNF-α may be due to the characteristics of the mitochondria. Expression of the antiapoptotic proteins, Bcl-2 and Bcl-XL, was similar at the whole cell level in the two cell lines. Although an increase in the expression of Bcl-XS and Bad was seen in the CEM/VLB100 cell line, the differences were not convincing enough to entirely account for the differences in the susceptibility to apoptosis. In addition, the total protein contents of Bcl-XS and Bad were much lower than other Bcl-2 family proteins.
The subcellular localization of Bcl-2, Bcl-XL, and Bax in the CEM cell line was consistent with that described for HL-60 leukemia cells, murine thymocytes,11 and L929 murine fibrosarcoma cells.12 Bcl-2 was exclusively membrane-bound, whereas Bax was present predominantly in the cytosol and Bcl-XL was present in both soluble and membrane-bound form. Bcl-XS and Bad were mainly present in CEM cytosol as soluble proteins. There was little Bcl-2 family death protein present in CEM mitochondria.
The Bcl-2 family death proteins, Bcl-XS, Bad, and Bax, were present at greater levels in CEM/VLB100 mitochondria compared with those of the CEM cell line. This increase in death protein was not accompanied by an increase in the levels of survival proteins. It has been reported that Bax binds to Bcl-2 via the BH3 domain to form a heterodimer, inactivating the normal ability of Bcl-2 to suppress apoptosis.21 Bad preferentially heterodimerizes with Bcl-XL through BH1 and BH2 interactions and functions to antagonize the antiapoptotic properties of Bcl-XL.28,29,36 However, the absence of BH1 and BH2 regions in Bcl-XS suggests that Bcl-XSenhances cellular sensitivity to apoptosis via a mechanism of action distinct from other Bcl-2 family members that promote apoptosis,10 possibly due to blocking the binding of cytochrome c to Bcl-XL.37 No difference in Bcl-2 and Bcl-XL expression between the two cell lines was observed at either the mitochondrial or the whole cell levels. However, the higher levels of proapoptotic proteins in the mitochondria may have diminished the antiapoptotic effect of both Bcl-2 and Bcl-XL in the CEM/VLB100 cell line and therefore decrease the cellular apoptotic threshold. This may be one of the reasons for the increased susceptibility of CEM/VLB100cells to apoptotic stimuli.
It has been shown that Bax may translocate from the cytosol to the mitochondria in leukemic cells during staurosporin-induced apoptosis.11,12 In addition, TNF-α induces inhibition of the mitochondrial ETC before other evidence of apoptosis in the CEM/VLB100 cell line, suggesting involvement of the mitochondria in the apoptotic process.30 We therefore examined whether a proapoptotic stimuli, such as TNF-α, induces redistribution of Bcl-2 family proteins in the leukemic cells. We have shown that the proapoptotic proteins, Bcl-XS, Bad, and Bax, translocate from cytosol to mitochondria in both cell lines. Translocation occurred to a similar degree, thus maintaining the higher levels of the proapoptotic proteins in the CEM/VLB100 cell line. The signal transduction pathway and mechanism, by which the proapoptotic protein molecules transferred from soluble form to membrane-bound proteins, remain unclear. However, these proapoptotic proteins are not lethal to cells in the resting state.12Bax and Bcl-XL do not form heterodimers in healthy cells.38 Bad and Bax interfere with the antiapoptotic activity of Bcl-2 or Bcl-XL by binding to them and forming nonfunctional heterodimers in challenged cells.29 The translocation of proapoptotic proteins to the mitochondria may result in the formation of channels or pores, which permit the release of cytochrome c from within the mitochondria, a critical step in the activation of the caspase protease cascade. The greater sensitivity of the CEM/VLB100 mitochondria to TNF-α–induced cytochrome c release and inhibition of the mitochondrial ETC may be due to the higher levels of Bax, Bad, and Bcl-XS in the mitochondria and a resultant diminution of the antiapoptotic activity of Bcl-2 and Bcl-XL. We also observed that TNF-α–induced mitochondrial inner membrane depolarization did not occur before DNA fragmentation. This implies that the targeting of proapoptotic proteins to mitochondria does not directly affect inner membrane function. Consequently, TNF-α–induced inhibition of the mitochondrial ETC may be the direct result of cytochrome crelease.
Bcl-2 protein translocation from RER to mitochondria was observed in the CEM cell line following exposure to TNF-α. It is known that the nuclear DNA-encoded mitochondrial membrane proteins are synthesized and imported from the RER to the mitochondria. TNF-α induces interaction between the RER and mitochondria and increases autophagy in both CEM and CEM/VLB100 cell lines.32 It is unknown whether Bcl-2 translocation occurred to CEM/VLB100mitochondria, because total cellular levels of Bcl-2 decreased in the CEM/VLB100 cell line after exposure to TNF-α. It has been found that Bcl-2 can be digested in vitro by active caspase-3 and cleaved in vivo after activation of the Fas pathway in CEM cells.39 Therefore, it is possible that Bcl-2 may be digested by caspase-3, which is only activated in the actively apoptotic CEM/VLB100 cell line and not in CEM cells (Jia et al, unpublished observations, July 1998). The cleavage of Bcl-2, and subsequent failure to translocate to the mitochondria, may further enhance cytochrome c release, permitting activation of downstream caspases (such as caspase 3) and contribute to amplification of the caspase cascade to ensure the inevitability of cell death.39 This evidence suggests the existence of a feedback loop between Bcl-2 and the caspases.
Thus, a number of mechanisms may operate to determine the sensitivity of human leukemic cells to apoptotic stimuli. Apart from differing cellular levels of proapoptotic or antiapoptotic proteins of the Bcl-2 family, these proteins may be favorably distributed to permit survival of the cell or may translocate after toxic challenge to facilitate or prevent death. BID, a member of the Bcl-2 family that directly mediates cytochrome c release, has recently been shown to translocate to the mitochondrial membrane,40 41 thus further supporting the concept of intracellular movement of these proteins under conditions of stress. We have described that the ratios of Bcl-2 family death proteins to survival proteins at the whole cell level are different to those in mitochondria. The susceptibility of leukemic cells to TNF-α–induced cytochrome c release may rely predominantly on the death proteins present in mitochondria. Furthermore, cells reset their ratio of mitochondrial Bcl-2 proteins depending on death or survival signaling.
Supported by grant LRFG 9742 awarded by the Leukaemia Research Fund (UK) to S.M.K. L.J. was supported as a post-doctoral research fellow by this grant.
The publication costs of this article were defrayed in part by page charge payment. This article must therefore be hereby marked “advertisement” in accordance with 18 U.S.C. section 1734 solely to indicate this fact.
REFERENCES
Author notes
Address reprint requests to Stephen M. Kelsey, MD, Department of Haematology, St Bartholomew’s and the Royal London School of Medicine and Dentistry, London E11BB, UK; e-mail: s.m.kelsey@mds.qmw.ac.uk.

This feature is available to Subscribers Only
Sign In or Create an Account Close Modal