Abstract
A 250-cGy whole-body γ-radiation dose was used to induce thymus regression in mice, and to study the expression and function of extracellular matrix (ECM) receptors in distinct thymocyte subsets emerging during repopulation of the organ. The onset of regeneration was detected from day 2 to 3 postirradiation (P-Ir), when a remarkable increase in the absolute counts of CD3−CD25hiCD44+ and CD3−CD25in/hiCD44−cells occurred. Enhanced expression of L-selectin, 4, and 5 integrin chains (L-selhi 4hi5hi) was also exhibited by these cells. This pattern of expression was maintained until the CD4+CD8+ (DP) young stage was achieved. Afterward, there was a general downregulation of these ECM receptors in DP as well as in CD4+ or CD8+ single positive (SP) thymocytes (L-selin 4in5in). In some recently generated SP cells, 4 expression was downregulated before the 5 chain, and L-selectin was upregulated in half of more mature cells. The expression of the 6 integrin chain was downregulated only in maturing CD4+cells. Importantly, the increased expression of L-selectin and 4 and 5 chains in thymocytes was strongly correlated with their adhesiveness to thymic epithelial cells (TEC) in vitro. Blocking experiments with monoclonal antibody or peptides showed the following: (1) that the LDV rather than the REDV cell attachment motif in the IIIC segment of fibronectin is targeted by the 4 integrin during thymocyte/TEC adhesion; (2) that the RGD motif of the 120-kD fragment of fibronectin, a target for 5 integrin, has a secondary role in this adhesion; and (3) that the YIGSR cell attachment motif of the β1 chain of laminin/merosin recognized by a nonintegrin receptor is not used for thymocyte adherence. In conclusion, our results show that an upregulated set of receptors endows CD25+ precursors and cells up to the young DP stage with a high capability of interacting with thymic ECM components.
SUSTAINED CONTACT of thymocytes with the thymic microenvironment has been shown to be necessary for the generation of CD4+CD8+ double-positive (DP) thymocytes,1,2 as well as for a successful progression to positive selection.3 An obvious conclusion from these observations is that thymic environmental components deliver signals to thymocytes, such as those mediated by soluble and/or membrane-bound cytokines,4,5 as well as by ligands present on the membrane of stroma cells or in the extracellular matrix (ECM) compartment.6 7
One ECM component that seems to be implicated in thymocyte differentiation is fibronectin (FN). In vitro, coculture of murine CD4−CD8− double-negative (DN) thymocytes with thymic microenvironmental cell lines promotes their passage to the DP stage. In this system, addition of anti-FN antibodies blocks the DN → DP transition.1,2 Moreover, murine DN cells and human DN and DP cells represent the major subsets that adhere to FN-coated plates.6,8 Additionally, FN supports migration of murine DP thymocytes through the cortically located thymic nurse cells9 and the migration of human CD4+ or CD8+ single-positive (SP) thymocytes.10
Other thymic ECM components such as laminin (LN) and one particular laminin variant, namely merosin (laminin-2), influence thymocyte migration and differentiation. Laminin is involved in the migration of immature thymocytes within thymic nurse cell complexes.11Furthermore, in the presence of Mn2+, up to 50% of human thymocytes can bind constitutively to LN- or LN-2–coated surfaces, using α6β1 and, to a lesser extent, α3β1 integrins.12 A putative role for FN and LN in thymic positive selection was suggested by results showing that these proteins can costimulate the CD3-driven thymocyte proliferation.8 12
Although consistent, the above results mostly derive from in vitro studies. In this context, putative in vivo fluctuations of ECM receptors along with thymocyte differentiation may provide clues for a better understanding of how thymocytes sequentially interact with ECM.
Sublethal irradiation promotes a profound depletion of the thymic lymphoid compartment. Depletion is followed by a wave of repopulation solely dependent on intrathymic resident precursors, and being completed by day 10 postirradiation (P-Ir).13 14 Therefore, this “ontogenetic recapitulation” model is useful for studying the expression of molecules in thymocytes at particular stages of their development, under the influence of the stromal architecture of an adult thymus. In this report we analyzed the following: (1) the expression of ECM receptors throughout thymocyte differentiation after exposure of adult mice to 250 cGy γ-radiation; (2) the correlation between the expression of these receptors and the ECM adhesive status of thymocytes; and (3) the participation of some ECM receptors in mediating this adhesive process.
MATERIALS AND METHODS
Animals.
Male and female C57Bl/6 mice ages 6 to 8 weeks were obtained from the animal care facilities of the Brazilian National Cancer Institute, Rio de Janeiro, and kept on a 12-hour (6:00 AM to 6:00PM) light regimen with food and water ad libitum. After irradiation, animals were housed at a maximum of six to a cage. In some experiments 15- to 17-day fetuses were used.
Antibodies and chemicals.
The following monoclonal (MoAb) and conventional antibodies were used: phycoerythrin (PE)-conjugated anti-CD4 (clone GK1.5) and fluorescein isothiocyanate (FITC)- or biotin-conjugated anti-CD8α (clone 53.6.7) MoAbs were purchased from Becton Dickinson (Mountain View, CA); the FITC-conjugated anti-CD3ε (clone 145-2C11) was from Boehringer Mannheim (Mannheim, Germany), and the biotin-conjugated anti-CD3ε MoAb (clone 99B) was from GIBCO-BRL Life Technologies (Gaithersburg, MD). Unlabeled (no azide/low endotoxin) or PE-conjugated anti-α4 integrin chain (clone R1-2) and anti-α5 integrin chain (clone 5H10-27) MoAb, as well as PE-conjugated anti-CD117 (clone 2B8), anti–L-selectin (clone MEL-14) MoAbs were obtained from Pharmingen (San Diego, CA); the anti-α6 integrin chain MoAb (clone GoH3) was from Immunotech (Marseille, France), and the FITC-bound anti-CD25 (clone AMT.13), the biotinylated anti-phosphotyrosine (clone PT-66), the quantum red–coupled anti-CD4 (clone H129.19), anti-CD8 (clone 53-6.7), and the anti-CD44 MoAbs (clone IM7.8.1) were from Sigma Chemical Co (St Louis, MO). The FITC-conjugated rabbit anti-rat Ig serum was from W & L Immunochemicals (Rio de Janeiro, Brazil), and the FITC-, PE-, or biotin-conjugated isotype-matched rat IgG1or IgG2 antibody controls were purchased from Becton Dickinson, Pharmingen, or Sigma. Control goat, hamster, or mouse Ig fractions were prepared in our laboratories. When using biotinylated antibodies, specific labeling was visualized with streptavidin-PE (Becton Dickinson) or streptavidin-Tricolor (Caltag Laboratories, San Francisco, CA). The following peptides were purchased from Sigma: the 1-25 and 90-109 amino acid sequences of the alternatively spliced type III connecting segment (CSIII) of FN (F-5007 and F-6398, respectively); the Gly-Arg-Gly-Asp-Ser (GRGDS) sequence enclosed by the 120-kD fragment of FN (G-4391), and the 925-933 sequence of the β1 chain of LN that binds the nonintegrin 67-kD cellular receptor (G-0668). Unless otherwise stated, all chemicals cited below were purchased from Sigma.
Irradiation schedule.
Mice were habituated to the presence of a 10 × 8 × 2-cm fenestrated acrylic box left in the cage for 24 hours. Five or six mice were then gently forced to enter the box and were whole-body irradiated between 5:00 and 7:00 am. The radiation dose was 250 cGy, delivered by a 60Co γ-ray source (THERATRON 780C apparatus; Theratronics Int Ltd, Kanata, Ontario, Canada) at a dose rate of 25 cGy/min.
Thymuses and thymocyte suspensions.
Thymuses were excised after bleeding and killing the mice by cervical dislocation under deep anesthesia. After washing in Eagle’s minimum essential medium with Earle’s base, pH 7.2 (MEM), thymuses were minced in MEM diluted 1:2 with 0.9 g% NaCl (MEM/3) plus 5% fetal calf serum (FCS; Fazenda Pigue, Nova Friburgo, RJ) and pressed through a 200 mesh stainless steel grid with the aid of a rubber policeman. Thymocytes were washed once in MEM/3-FCS (400g, 5 minutes, 10°C) and suspended to 2 × 10⁷ cells/mL, being kept on melting ice before labeling. In some experiments, thymocytes were treated with an NH4Cl solution for erythrocyte lysis.
Detection of apoptotic DNA.
Internucleosomal apoptotic DNA breaks were assessed by agarose (1.8%) gel electrophoresis as reported by Swat et al.15 Genomic DNA extracted from 1 × 10⁶ viable thymocytes (viability determined by the criteria of birefringence under phase contrast microscopy) was applied to each lane.
Nuclear staining for cell-cycle phase analysis.
For nuclear staining 0.5 to 1.0 × 10⁶ thymocytes in 25 to 50 μL were transferred to appropriate flow cytometer tubes. One-half milliliter of a 50 μg/mL propidium iodide (PI)/4 mmol/L trisodium citrate/0.3% Triton X-100 solution was added and the tubes were left to stand at room temperature in the dark for 15 minutes. The same volume of 100 μg/mL bovine pancreatic RNAse (5 to 10 Kunitz U/mL, R-5503) in 40 mmol/L trisodium citrate, pH 8.2, was then added and the tubes were left to stand under the same conditions for an additional 15 minutes.
Labeling of surface antigens.
Because of the poor cell yield obtained from day 2 and 3 P-Ir mice, we opted to perform labelings with thymocyte pools from at least three organs. One million, 1.5 × 10⁶, or 2.0 × 10⁶ thymocytes were labeled with relevant or irrelevant antibodies diluted in MEM/3-FCS in 200-μL final volumes. Incubations were done in 1-mL Eppendorf tubes on melting ice in the dark for 45 minutes. When one of the antibodies was biotinylated, the cells underwent a second step of labeling with streptavidin-Tricolor or streptavidin-PE. Alternatively, when using an uncoupled antibody (ie, anti-α6 chain MoAb), dual or triple labelings were done in three steps: the first using the relevant (or irrelevant) antibody, the second with the fluorochrome-coupled anti-Ig antibody, and the third with the other antigen-directed fluorochrome-conjugated antibody(ies). At the end of each incubation step, 1 mL of MEM1/3-FCS was added and the cells were spun down at 1,000g for 1.5 minutes. Cell pellets were washed twice and then suspended in either 100 to 200 μL (for the next labeling step) or 1.0 mL of this medium (for cytofluorometric analysis). The DNA-specific fluorochrome, PI, was finally added at a final concentration of 2 μg/mL, to exclude dead cells (which are permeable to propidium iodide) during analysis.
Labeling of intracellular phosphotyrosine (PTyr).
After surface immunostaining, cells were washed twice with phosphate-buffered saline (PBS) and the cell pellet was suspended in 1.0 mL of a freshly prepared solution of 1.0% paraformaldehyde plus 0.01% Tween 20 in PBS, pH 7.2. The suspension was kept protected from light in a refrigerator for 24 to 48 hours to allow full fixation and permeabilization of the specimens. Cells were washed three times with PBS-FCS and incubated with standardized amounts of conjugated anti-PTyr MoAb in 200 μL PBS at room temperature in the dark for 1 hour. Cells were finally washed two times with PBS-FCS and suspended in the same solution for the cytofluorometric readings.
Flow cytometry.
Flow cytometry was performed in a FACSCAN II apparatus (Becton Dickinson) equipped with an air-cooled 488 nm argon ion laser of 15 mW. The green fluorescence emission of FITC was detected after passage through a 530 nm band pass filter, the orange emission of PE or PI (cell cycle) after passage through a 585 nm band pass filter, and red emission of tricolor or quantum red after passage through a long band pass filter above 650 nm. Dynamic adjustment of electronic compensation among these reading channels was performed to remove overlap of spectral emissions. Data were obtained with the LYSYS II software program (Becton Dickinson Immunocytometry Systems) and stored in a Hewlett-Packard computer (model HP9000/300). Twenty thousand to 50,000 thymocytes (or nuclei) were acquired in each reading by the initial criteria of conventional size (forward light scatter) and granularity (side light scatter).
Thymocyte adhesion assay.
A thymic epithelial cell line 2BH4 derived from C57Bl/6 mice16 was used for the thymocyte adhesion assays. These cells secrete, among other ECM components, FN and LN, as assessed by immunostaining in our laboratories. Cells in exponential growth were detached by trypsinization and seeded in 25-cm2 Falcon tissue culture flasks (5 × 10⁵ viable cells per flask) in 5 mL of RPMI 1640 medium plus 10% FCS. Twenty-four hours later, the culture medium was removed and the nonconfluent 2BH4 monolayers were washed four times with warm FCS-free medium. A total of 1.5 to 2.5 × 10⁷ thymocytes, suspended in 1 mL medium without serum, were then added to the monolayers and the bottles left to stand for 1 hour at 37°C in an incubator. After incubation, loose thymocytes were aspired and the bottles gently washed with three changes of 5 mL warm medium to remove the remaining nonadherent thymocytes. Adherent thymocytes were recovered in 1.5 mL cold medium with 10% FCS after beating the bottles horizontally followed by pipette flushing under microscope observation. When testing for antibody or peptide blocking activity, thymocytes were preincubated in their presence for 30 minutes in an ice bath before the addition to 2BH4 monolayers (see Table 2 for concentrations of each antibody or peptide).
RESULTS
Thymus cellularity after a 250-cGy exposure.
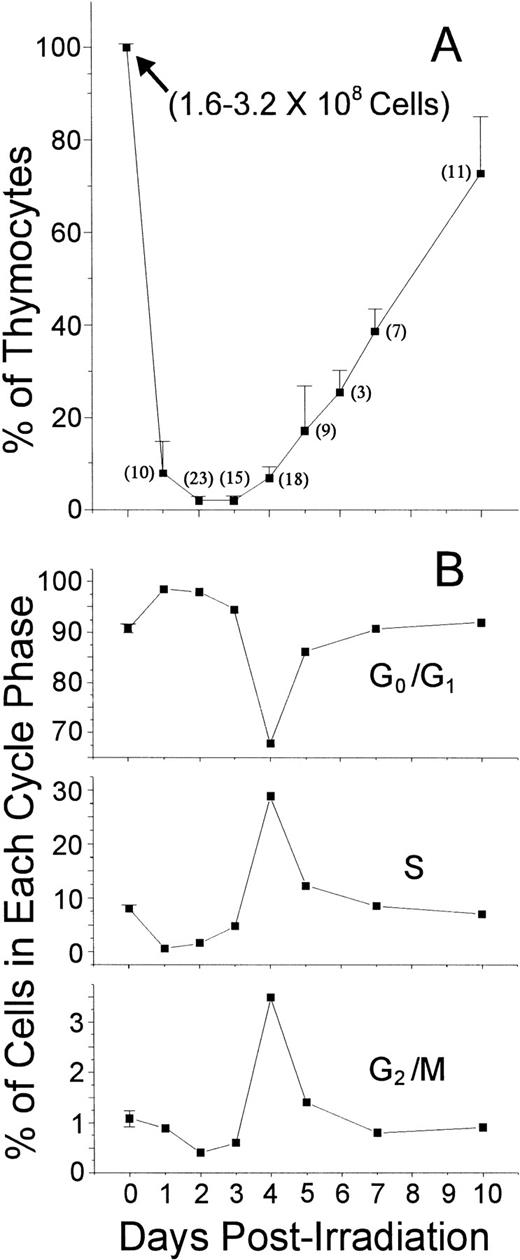
As depicted in Fig 1A, the percentage of cells recovered from thymuses after a 250-cGy whole-body radiation dose rapidly decreased, so that on days 2 and 3 P-Ir, only 1% to 2% of the control values were recovered. This accounted for a reduction of more than 80% (from 64.6 ± 15.3 mg to 11.1 ± 2.0 mg) in thymus weight on these days. This thymocyte death occurred by apoptosis because the typical DNA ladder in agarose gel electrophoresis was strongly enhanced between 2 and 12 hours P-Ir (data not shown). Thymus cellularity remained essentially unchanged by days 2-3 P-Ir, after which repopulation started. The onset of repopulation was characterized by a tremendous increase in the number of cycling cells (Fig 1B).
Percentage and cycling status of thymocytes obtained from control or irradiated mice. (A) The percentages ± SD of cells recovered from the thymus (2 lobes) of control mice (day 0) or of mice killed on different days after irradiation. The number of mice used per point is shown in parenthesis. The range of absolute thymocyte count recovery for control mice is indicated in the graph. (B) The distribution of thymocytes according to their cycling status. In this experiment, except for six individually analyzed control mice (G0/G1 = 90.75 ± 0.86, S = 8.17 ± 0.73, and G2/M = 1.08 ± 0.16), percentage values were obtained with the labeling of pooled thymocytes from at least three animals per point.
Percentage and cycling status of thymocytes obtained from control or irradiated mice. (A) The percentages ± SD of cells recovered from the thymus (2 lobes) of control mice (day 0) or of mice killed on different days after irradiation. The number of mice used per point is shown in parenthesis. The range of absolute thymocyte count recovery for control mice is indicated in the graph. (B) The distribution of thymocytes according to their cycling status. In this experiment, except for six individually analyzed control mice (G0/G1 = 90.75 ± 0.86, S = 8.17 ± 0.73, and G2/M = 1.08 ± 0.16), percentage values were obtained with the labeling of pooled thymocytes from at least three animals per point.
Evolution of thymocyte subpopulations after irradiation.
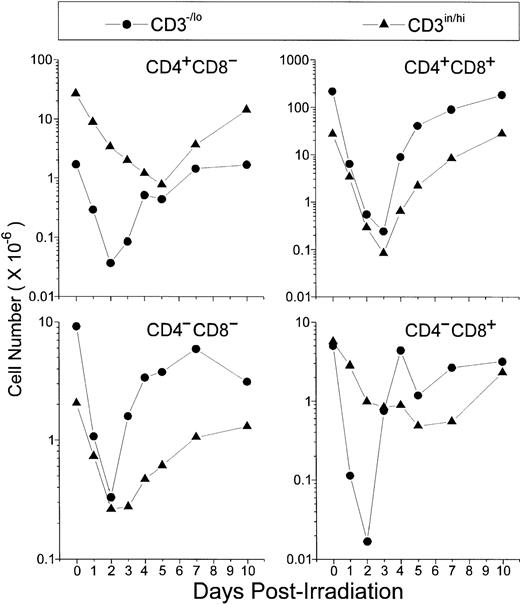
Absolute thymocyte counts showed that the first subpopulations starting recovery 2 days P-Ir comprised the DN, the CD8+, and, to a lesser extent, CD4+ phenotypes, all in the CD3−/lo stage (Fig 2). Then, by day 3 P-Ir, CD3−/loDP, CD3in/hiDN, and CD3in/hiDP cells started to increase. More radioresistant, the CD3in/hiCD4+or CD3in/hiCD8+ subsets, which progressively decreased in number until day 5 P-Ir, probably because of their exit to the periphery, started to show an increase after this day (for the CD4+) or after day 7 P-Ir (for the CD8+). Taken together, these results confirm previous reports showing that in the C57Bl/6 mouse strain the DN → DP transition occurs preferentially by the acquisition of the CD8 antigen,17with more time being expended for the generation of CD8+than for CD4+ mature cells.18
Absolute values of thymocyte subpopulations, as defined by CD3/CD4/CD8 triple-labeling, found in control or irradiated mice. For simplification, CD4/CD8-defined thymocyte subsets were divided into −/lo or in/hi according to their level of CD3 expression. For examples for this arbitrary CD3 division, see Figs 12 and 13. Values were obtained with the labeling of pooled thymocytes from at least three animals per point.
Absolute values of thymocyte subpopulations, as defined by CD3/CD4/CD8 triple-labeling, found in control or irradiated mice. For simplification, CD4/CD8-defined thymocyte subsets were divided into −/lo or in/hi according to their level of CD3 expression. For examples for this arbitrary CD3 division, see Figs 12 and 13. Values were obtained with the labeling of pooled thymocytes from at least three animals per point.
CD25, CD44, and CD117 (c-kit) expression on thymocytes.
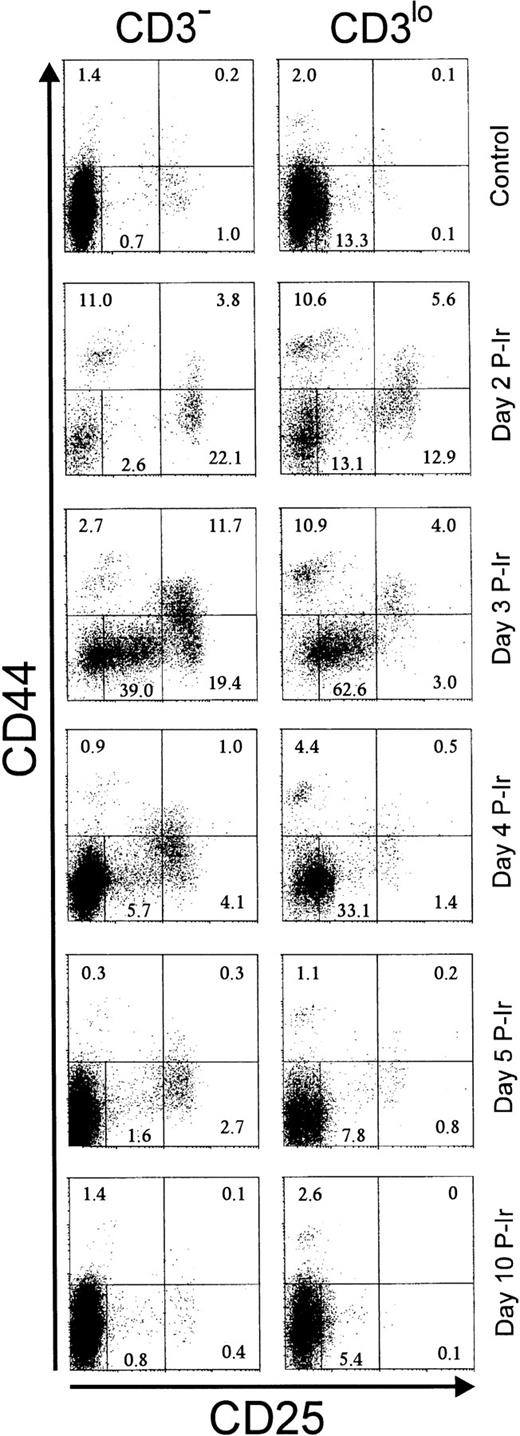
The surface expression of CD25 and/or CD44 has been shown to define distinct stages within early differentiating CD3−thymocytes.19 As expected from the literature, in control C57Bl/6 mice, less than 2% of CD25+ (ie, CD25hi) cells and less than 3% of CD44+ (ie, CD44in/hi) cells were found among CD3−/lothymocytes (Fig 3). Maximal relative increases in CD44+ and CD25+ cells were attained on days 2 and 3 P-Ir, respectively. On day 3 P-Ir, when CD3−/lo thymocytes were seen mostly in DN and CD8+ subsets, CD25hi plus CD25incells represented 70% of all CD3−/lo thymocytes.
CD25 and CD44 expression in CD3− and CD3lo thymocytes in control or irradiated mice. Major quadrants: upper left, CD25−CD44+ cells; upper right, CD25+(hi)CD44+ cells; lower left, CD25+CD44− plus CD25inCD44− (middle gate) cells; lower right; CD25+CD44− cells. Numbers represent the percentage of thymocytes in each quadrant or the gate. Values were obtained with the labeling of pooled thymocytes from at least three animals per point.
CD25 and CD44 expression in CD3− and CD3lo thymocytes in control or irradiated mice. Major quadrants: upper left, CD25−CD44+ cells; upper right, CD25+(hi)CD44+ cells; lower left, CD25+CD44− plus CD25inCD44− (middle gate) cells; lower right; CD25+CD44− cells. Numbers represent the percentage of thymocytes in each quadrant or the gate. Values were obtained with the labeling of pooled thymocytes from at least three animals per point.
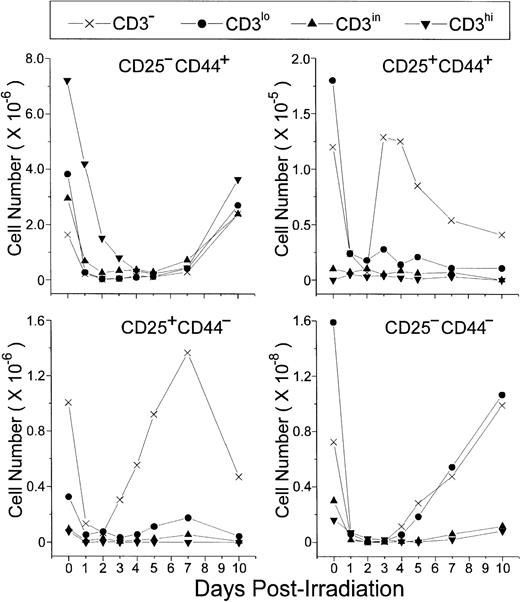
An increase of CD25+ cells at the onset of P-Ir thymocyte recovery has been previously reported.20 Our data (Fig 4) show that CD25+CD44+ and CD25+CD44− cells, both restricted to the CD3− stage, are the first to start recovery from day 2 to day 3 P-Ir. CD25+CD44+ cells exhibited a higher expansion rate (ie, slope) between days 2 and 3 P-Ir, an early decrease after this expansion (day 4 v day 7 P-Ir), and a 10-fold lower number throughout the recovery period, compared with CD25+CD44− cells. This indicates that CD25+CD44+ cells are precursors of CD25+CD44− cells. In turn, CD25−CD44− cells started their increase later, on day 4 P-Ir, when the first DP cells emerged (as seen in Fig 2). Because they were present among both CD3−and CD3lo cells, a more advanced maturation status can be ascribed to them when compared with the subsets mentioned earlier.
CD25/CD44-defined thymocyte subsets obtained at distinct stages of maturation (ie, level of CD3 expression) in control or irradiated mice. Absolute values were obtained with the labeling of pooled thymocytes from at least three animals per point.
CD25/CD44-defined thymocyte subsets obtained at distinct stages of maturation (ie, level of CD3 expression) in control or irradiated mice. Absolute values were obtained with the labeling of pooled thymocytes from at least three animals per point.
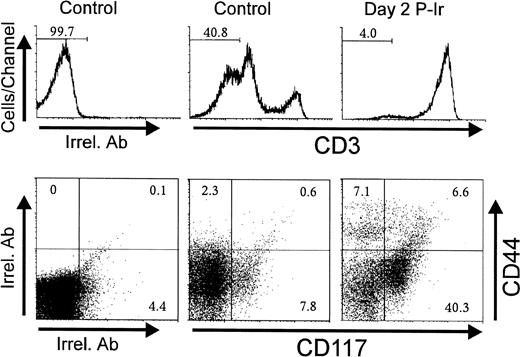
Considering that CD44 expression is shared by other leukocyte types,21 the CD3−CD25−CD44+ cells seen in Figs 3 and 4 could putatively represent macrophages, dendritic cells, B lymphocytes, and granulocytes, also discretely present in the thymus.22 CD117, a stem cell factor receptor (c-kit), has been shown to be expressed only in hematopoietic progenitors and its levels decrease during thymocyte differentiation as early as in the CD3−CD4−CD8−triple negative (TN) stage.19 Control and day 2 P-Ir thymocytes showed over 20% and 45% CD117+ cells among CD44+CD3− thymocytes, respectively (Fig 5). Importantly, the labeling intensity for CD117 was higher in CD44+ than in CD44− cells, supporting the notion that the former were in a more primitive stage of differentiation than the latter. Taken together, these results support the phenotypic maturation sequence CD25−CD44+CD117++→ CD25+CD44+CD117++→ CD25+CD44−CD117+→ CD25−CD44−CD117−among CD3− cells, as observed during ontogeny or as suggested by defective or genetically manipulated mice.19
CD44 and CD117(c-kit) expression in CD3−thymocytes obtained from control or irradiated mice. Numbers represent the percentage of thymocytes found in histogram selected region or dot plot defined quadrant regions. In this typical experiment thymocyte pools from 3 control or 6 day 2 P-Ir mice were labeled. Irrel. Ab, irrelevant antibody.
CD44 and CD117(c-kit) expression in CD3−thymocytes obtained from control or irradiated mice. Numbers represent the percentage of thymocytes found in histogram selected region or dot plot defined quadrant regions. In this typical experiment thymocyte pools from 3 control or 6 day 2 P-Ir mice were labeled. Irrel. Ab, irrelevant antibody.
Expression of L-selectin and integrin α4 or α5 chains at different CD3-defined thymocyte differentiation stages.
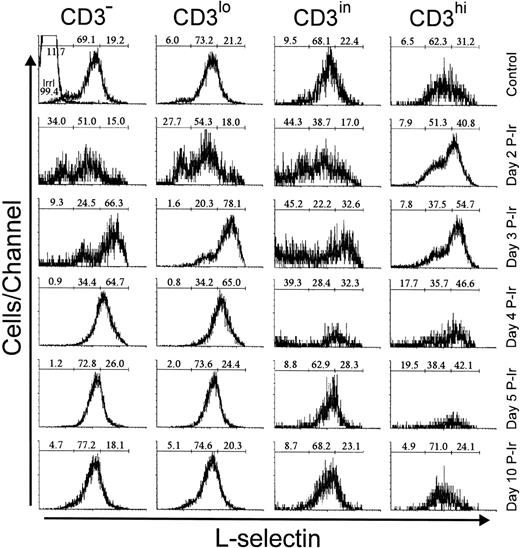
L-selectin (CD62L), a C-type lectin, recognizes sialil Lewis-x or sialil Lewis-a sugar moieties properly anchored on sialomucins.23 In control mice, most thymocytes exhibited a positive level of staining, arbitrarily defined by us as intermediary (L-selin), since a significant percentage of thymocytes with a high level of L-selectin expression (L-selhi) were also present (data not shown). The latter were found in all CD3 stages, but their frequency was higher among CD3hi cells (Fig 6). These L-selhithymocytes further increased among CD3hi cells until day 3 P-Ir.
L-selectin expression as a function of CD3 surface level in thymocytes obtained from control or irradiated mice. Numbers represent the percentages found for L-sel− (left region), L-selin (middle region), and L-selhi (right region) thymocytes. The area tagged with “irrl” shows the labeling of control thymocytes with an irrelevant antibody. Values were obtained with the labeling of pooled thymocytes from at least three animals per point.
L-selectin expression as a function of CD3 surface level in thymocytes obtained from control or irradiated mice. Numbers represent the percentages found for L-sel− (left region), L-selin (middle region), and L-selhi (right region) thymocytes. The area tagged with “irrl” shows the labeling of control thymocytes with an irrelevant antibody. Values were obtained with the labeling of pooled thymocytes from at least three animals per point.
Among CD3−/lo thymocytes from control mice, about 20% were L-selhi. In contrast, on day 3 P-Ir more than 50% of CD3−/lo thymocytes showed an L-selhiprofile. This was still seen on day 4 P-Ir, but on day 5 P-Ir and thereafter thymocytes (except most CD3hi cells) regained a predominant L-selin pattern, similar to control mice.
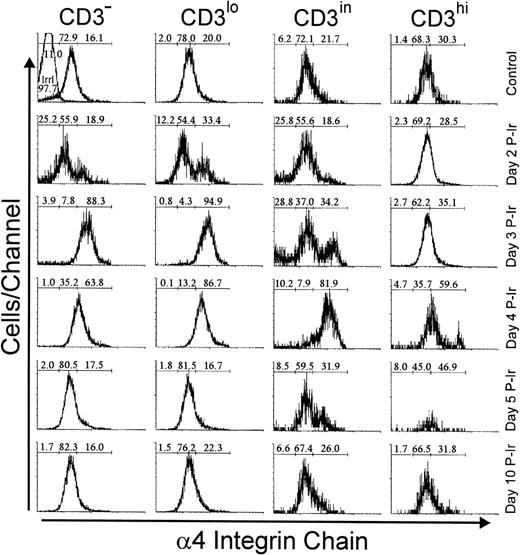
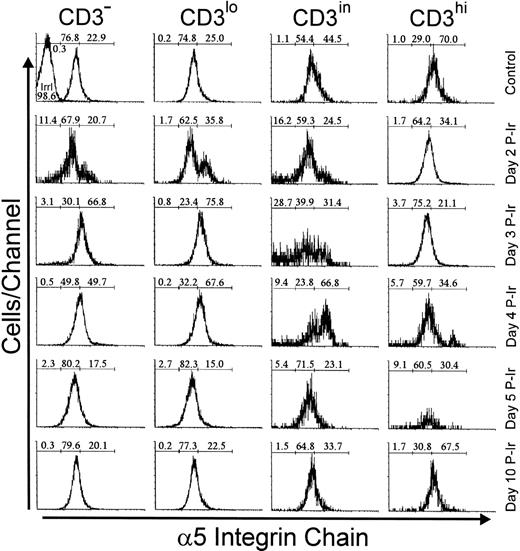
Analysis of integrins that bind to FN showed that 20% to 30% of bulk control mouse thymocytes exhibited a high labeling density for α4 or α5 integrin chains, respectively (not shown). In contrast to L-selhi cells, the frequency of α4hi and α5hi cells did not increase among CD3hithymocytes during the first days after irradiation (Figs7 and 8). However, the relative numbers of α4hi and α5hi cells in CD3−/lo thymocytes exceeded 65% from day 2 to 3 P-Ir. Cells bearing the α4hi and α5hiphenotypes only reached a majority among CD3in thymocytes on day 4 P-Ir. After day 5 P-Ir, the intermediary intensity of α4 or α5 labeling (α4in or α5in), predominant in CD3−/lo/in thymocytes from control mice, was seen again. Also noteworthy was the high proportion of α5hiCD3in/hi cells in control or day 10 P-Ir mice in contrast to α4hiCD3in/hi cells, indicating that α5hi expression is preserved for a longer time than α4hi expression during thymocyte maturation.
Integrin 4 chain expression as a function of CD3 surface level in thymocytes obtained from control or irradiated mice. Numbers represent the percentages found for 4− (left region), 4in (middle region), and 4hi(right region) thymocytes. The area tagged with “irrl” shows the labeling of control thymocytes with an irrelevant antibody. Values were obtained with the labeling of pooled thymocytes from at least three animals per point.
Integrin 4 chain expression as a function of CD3 surface level in thymocytes obtained from control or irradiated mice. Numbers represent the percentages found for 4− (left region), 4in (middle region), and 4hi(right region) thymocytes. The area tagged with “irrl” shows the labeling of control thymocytes with an irrelevant antibody. Values were obtained with the labeling of pooled thymocytes from at least three animals per point.
Integrin 5 chain expression as a function of CD3 surface level in thymocytes obtained from control or irradiated mice. Numbers represent the percentages found for 5− (left region), 5in (middle region), and 5hi(right region) thymocytes. The area tagged with “irrl” shows the labeling of control thymocytes with an irrelevant antibody. Values were obtained with the labeling of pooled thymocytes from at least three animals per point.
Integrin 5 chain expression as a function of CD3 surface level in thymocytes obtained from control or irradiated mice. Numbers represent the percentages found for 5− (left region), 5in (middle region), and 5hi(right region) thymocytes. The area tagged with “irrl” shows the labeling of control thymocytes with an irrelevant antibody. Values were obtained with the labeling of pooled thymocytes from at least three animals per point.
High expression of α4 and α5 chains is acquired at the CD3−CD25hi stage in adult mice and during normal ontogeny.
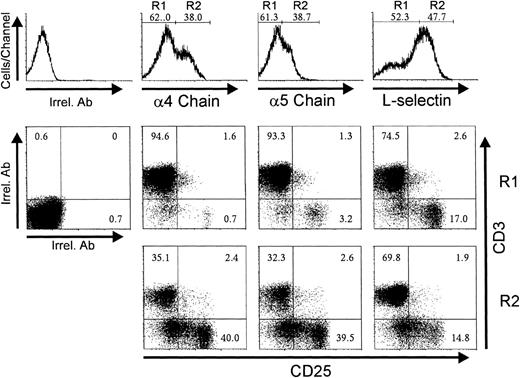
The above results established temporal and numeric relationships between the emergence of CD25in/hi cells and the increase of L-selhi , α4hi, or α5hicells among CD3−/lo thymocytes at the beginning of reconstitution. Triple-labeling experiments with day 3 P-Ir thymocytes confirmed that the vast majority of CD3−/lo and CD25in/hi thymocytes have α4hi or α5hi phenotypes (Fig 9, R2). Interestingly, most CD25hi cells exhibited a L-selin phenotype whereas most CD25−/incells exhibited an L-selhi phenotype.
CD3 and CD25 labeling profiles of 4hi, 5hi, and L-selhi cells from day 3 P-Ir thymocytes. Thymocytes pooled from 20 irradiated mice were triple stained with anti-CD3, anti-CD25, and anti-ECM receptor (anti-4 chain, anti-5 chain, or anti-L-selectin) MoAb cocktails, or with irrelevant antibodies (Irrel. Ab). Thymocytes were arbitrarily split into negative/intermediary (R1) or high (R2) staining for ECM receptor expression (histograms) and then analyzed for CD3 and CD25 expression (dot plots).
CD3 and CD25 labeling profiles of 4hi, 5hi, and L-selhi cells from day 3 P-Ir thymocytes. Thymocytes pooled from 20 irradiated mice were triple stained with anti-CD3, anti-CD25, and anti-ECM receptor (anti-4 chain, anti-5 chain, or anti-L-selectin) MoAb cocktails, or with irrelevant antibodies (Irrel. Ab). Thymocytes were arbitrarily split into negative/intermediary (R1) or high (R2) staining for ECM receptor expression (histograms) and then analyzed for CD3 and CD25 expression (dot plots).
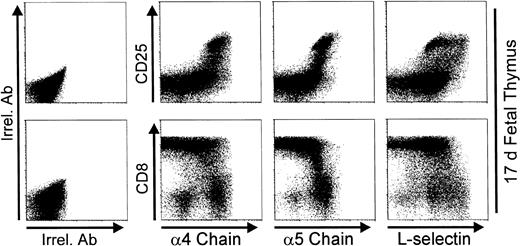
Figure 10 shows that thymic CD25in/hi cells from 17-day fetuses are present in a good number, and most thymocytes have reached or are acquiring the DP phenotype. Note the high expression of α4 or α5 chains as a hallmark of CD25in/hi thymocytes. Integrin chain expression started to decrease after CD25 downregulation and when the highest level of CD8 expression (ie, DP phenotype) was reached. Similarly to that observed on day 3 P-Ir, the L-selhi phenotype is predominantly expressed by CD25in rather than CD25hi cells.
Expression of 4 and 5 integrin chains, and L-selectin on day 17 fetal thymocytes. Thymocytes pooled from 15 17-day fetuses were triple stained with anti-CD8, anti-CD25, and anti-ECM receptor (anti-4 chain, anti-5 chain, or anti-L-selectin) MoAb cocktails, or with irrelevant antibodies (Irrel. Ab).
Expression of 4 and 5 integrin chains, and L-selectin on day 17 fetal thymocytes. Thymocytes pooled from 15 17-day fetuses were triple stained with anti-CD8, anti-CD25, and anti-ECM receptor (anti-4 chain, anti-5 chain, or anti-L-selectin) MoAb cocktails, or with irrelevant antibodies (Irrel. Ab).
High expression of L-selectin and integrin α4 and α5 chains in different CD4/CD8-defined thymocyte subsets.
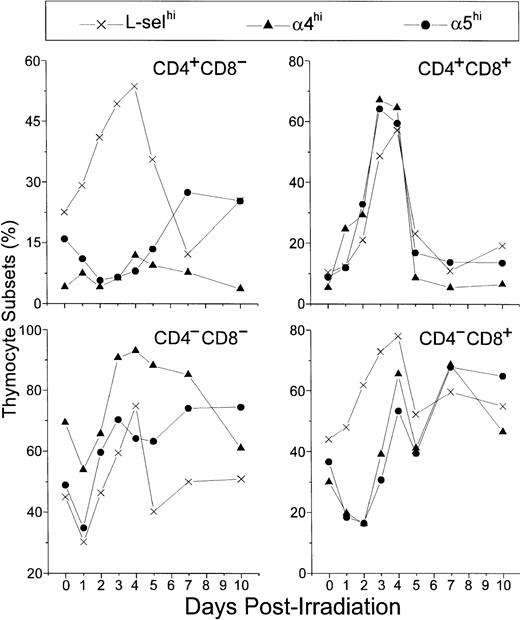
In control mice, L-selhi, α4hi, and α5hi cells represented 45%, 70%, and 50% of DN thymocytes, respectively. After a general decrease on day 1 P-Ir they further increased, reaching 60%, 90%, and 70% on day 3 P-Ir, respectively. The levels of α4hi or α5hi DN cells were then roughly maintained at least until day 7 P-Ir, whereas the levels of DN L-selhi cells decreased from day 4 to day 5 P-Ir and to levels close to those found in control mice thereafter (Fig 11).
Relative number of L-selhi, 4hi, and 5hi cells among CD4/CD8 thymocyte subsets. Values were obtained with the labeling of pooled thymocytes from at least three animals per point.
Relative number of L-selhi, 4hi, and 5hi cells among CD4/CD8 thymocyte subsets. Values were obtained with the labeling of pooled thymocytes from at least three animals per point.
Similar profiles were found for α4hi or α5hi CD8+ cells. These cells decreased from 30% to 40% (control mice) to less than 20% up to day 2 P-Ir, then exhibiting a recovery to 50% to 70% up to day 4 P-Ir. After another transient decrease on day 5 P-Ir, they remained roughly in this range until day 10 P-Ir. Nonetheless, L-selhi CD8+cells (40% to 50% in control mice) did not exhibit a decrease after irradiation, increasing to close to 80% on day 4 P-Ir, and behaving like α4hi and α5hi CD8+ cells thereafter.
In control mice, α4hi cells represented only 5% of DP thymocytes, while L-selhi or α5hi cells represented roughly 10%. On day 1 P-Ir, these percentages increased, exceeding 50% on days 3 and 4 P-Ir (when DP begins repopulation, as seen in Fig 2), and suddenly decreased on day 5 P-Ir and to values close to those found in control mice thereafter.
Finally, α4hi CD4+ cells were very poorly represented in control mice (around 5%), with their percentages not varying significantly after irradiation; only a mild increase was noted between days 4 and 7 P-Ir. In turn, α5hi CD4+cells were slightly better represented in control mice (about 15%). After irradiation, they decreased to 5% at day 2 P-Ir and increased to values close to 25% from day 5 to day 7 P-Ir, a percentage still present on day 10 P-Ir. L-selhi CD4+ thymocytes exhibited a continuous increase in relative values from 25% in control mice to more than 50% on day 4 P-Ir. In contrast to L-selhiCD8+ thymocytes, L-selhiCD4+ cells later exhibited a gradual decrease that peaked on day 7 P-Ir. Both the increase in α5hi CD4+ cells and the major decrease in L-selhiCD4+ cells seen on day 7 P-Ir coincided with the new generation of CD4+CD3in/hi cells (as seen in Fig 2). Importantly, more than 95% of CD4+ or CD8+ cells contributing to the increase of L-selhi until day 3 or 2 p-Ir, respectively, were CD3in/hi. Thereafter the relative increase of L-selhi among these subsets was due to CD3−/lo thymocytes, mainly CD8+ ones (Table 1).
Percentages of CD3−/lo and CD3in/hi Cells Among CD4/CD8 Subpopulations at Different Days P-Ir
| CD3 . | CD4+ . | DP . | DN . | CD8+ . | ||||
|---|---|---|---|---|---|---|---|---|
| −/lo . | in/hi . | −/lo . | in/hi . | −/lo . | in/hi . | −/lo . | in/hi . | |
| Control | 6.1 | 93.9 | 88.6 | 11.4 | 81.8 | 18.2 | 46.9 | 53.1 |
| Day 1 P-ir | 3.2 | 96.8 | 65.7 | 34.3 | 59.7 | 40.3 | 3.9 | 96.1 |
| Day 2 P-ir | 1.1 | 98.9 | 65.4 | 34.6 | 61.9 | 38.1 | 1.7 | 98.3 |
| Day 3 P-ir | 4.1 | 95.9 | 74.4 | 25.6 | 85.3 | 14.7 | 47.6 | 52.4 |
| Day 4 P-ir | 33.7 | 66.3 | 93.4 | 6.4 | 87.9 | 12.1 | 83.2 | 16.8 |
| Day 5 P-ir | 36.3 | 63.7 | 94.9 | 5.1 | 86.1 | 13.9 | 71.0 | 29.0 |
| Day 7 P-ir | 28.6 | 71.4 | 91.6 | 8.4 | 84.9 | 15.1 | 82.9 | 17.1 |
| Day 10 P-ir | 10.7 | 89.3 | 87.0 | 13.0 | 70.6 | 29.4 | 57.8 | 42.2 |
Data obtained with thymocyte pools from 3 to 9 mice.
In summary, the above results indicate that the high expression of L-selectin and α4 and α5 integrin chains underlines the DN → DP transition.
Expression of integrin α6 chain within CD3- or CD4/CD8-defined thymocyte subsets.
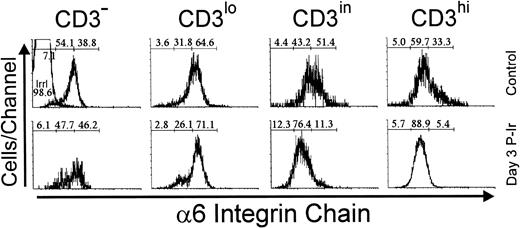
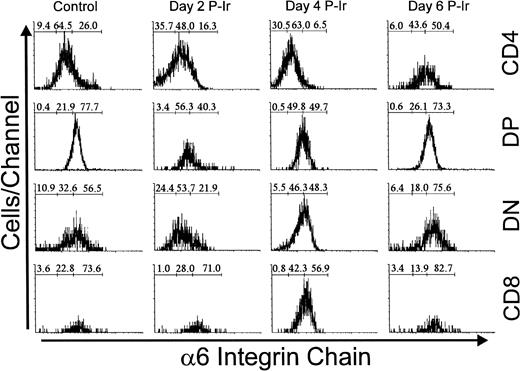
Immunolabeling of the α6 integrin chain allows the assessment of a laminin receptor expression on thymocytes. As shown in Fig 12, thymocytes from control mice exhibited a progressive decrease in α6 labeling, from the immature CD3lo cells to the more mature CD3hi cells (arbitrarily defined as α6hi to α6in). This difference in α6 expression in the CD3lo → CD3hi transition was sharper on day 3 P-Ir or even on day 4 P-Ir (data not shown). In keeping with this is the analysis of CD4/CD8 subsets (Fig 13). When DN cells were represented mainly by CD3−/lo cells, as in control or day 4 and 6 P-Ir mice (Table 1), they exhibited a predominant α6hi profile. By contrast, when CD3in/hicells increased in number within them, as on day 2 P-Ir (40%), they shifted to an α6in labeling profile. In control or day 2, 4, or 6 P-Ir mice, the vast majority of DP thymocytes maintained an α6hi profile (Fig 13). Regardless of the maturation status, a predominant α6hi profile was also kept in CD8+ cells; on day 2 P-Ir, when more than 98% of CD8+ cells were found to be CD3in/hi, or conversely on days 4 or 6 P-Ir, when 80% of them were found to be CD3−/lo, most exhibited α6hi labeling.
Integrin 6 chain expression as a function of CD3 surface level in thymocytes obtained from control or day 3 P-Ir mice. Numbers represent the percentages found for 6− (left region), 6in (middle region), and 6hi(right region) thymocytes. The area tagged with “irrl” shows the labeling of control thymocytes with an irrelevant antibody. Values were obtained with the labeling of pooled thymocytes from at least three animals per point.
Integrin 6 chain expression as a function of CD3 surface level in thymocytes obtained from control or day 3 P-Ir mice. Numbers represent the percentages found for 6− (left region), 6in (middle region), and 6hi(right region) thymocytes. The area tagged with “irrl” shows the labeling of control thymocytes with an irrelevant antibody. Values were obtained with the labeling of pooled thymocytes from at least three animals per point.
Integrin 6 chain expression in CD4/CD8-defined thymocyte subsets in control or day 2, 4, and 6 P-Ir. Numbers represent the percentages found for 6− (left region), 6in (middle region), and 6hi (right region) thymocytes. Values were obtained with the labeling of pooled thymocytes from at least three animals per point. Note: in this typical experiment, fluorescence intensities exhibited by subpopulations should be compared only for each day because thymocyte labelings were done on different days. Labeling with irrelevant antibody were done each day (not shown) and defined the negative region (left region) in the histograms.
Integrin 6 chain expression in CD4/CD8-defined thymocyte subsets in control or day 2, 4, and 6 P-Ir. Numbers represent the percentages found for 6− (left region), 6in (middle region), and 6hi (right region) thymocytes. Values were obtained with the labeling of pooled thymocytes from at least three animals per point. Note: in this typical experiment, fluorescence intensities exhibited by subpopulations should be compared only for each day because thymocyte labelings were done on different days. Labeling with irrelevant antibody were done each day (not shown) and defined the negative region (left region) in the histograms.
Differing from other subsets, CD4+ cells exhibited less rigid α6 staining profiles. In control mice they were predominantly α6−/in, a tendency that was emphasized until day 4 P-Ir. However, on day 6 P-Ir (ie, at the beginning of CD3in/hi CD4+ cell expansion), they were seen predominantly as α6hi cells. Moreover, when CD4+ cells were arbitrarily split into two gates, those cells enclosed in a gate closer to the CD4 axis in CD4 × CD8 plots (more mature) exhibited a 65% to 100% lower intensity of α6 labeling than those enclosed in a gate more distant from the CD4 axis (less mature), both in control and different day P-Ir mice (not shown). A similar split for CD8+ cells showed a less pronounced but still detectable (35%) decay in α6 labeling for cells closer to the CD8 axis as compared to those more distant from this axis (data not shown).
Upregulation of fibronectin receptors is associated with an intracellular increase of phosphotyrosine levels.
Treatment of human thymocytes with antibodies against β1 or α5 integrin chains has been shown to induce protein tyrosine phosphorylation.24 Therefore, we analyzed the levels of intracellular PTyr in thymocytes between days 2 and 3 P-Ir, the period when most CD3−/lo cells with a high α4, α5, or L-sel surface expression started to accumulate. In control mice, most of the CD3−/lo cells exhibited a PTyrinlabeling profile, while CD3in/hi cells shifted to a PTyrhi profile. Thus, at first glance, elevation of intracellular PTyr content seems to be correlated with thymocyte maturation. However, in these animals 15% of CD3−/locells exhibited a PTyrhi label represented mainly by DN and CD8+ cells (data not shown). The presence of such CD3−/lo PTyrhi cells was maximal at days 3-4 P-Ir when they corresponded to 75% of CD3-/lo cells (data not shown).
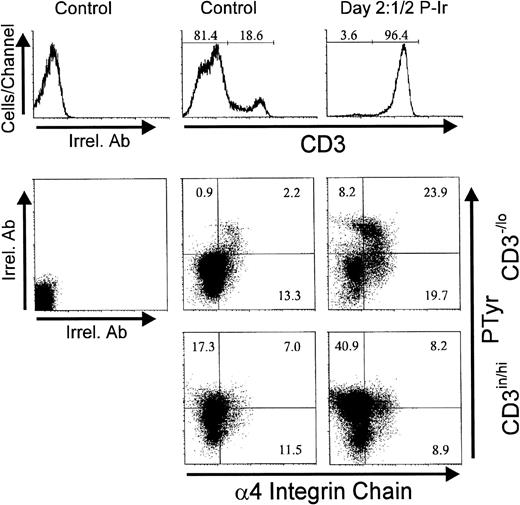
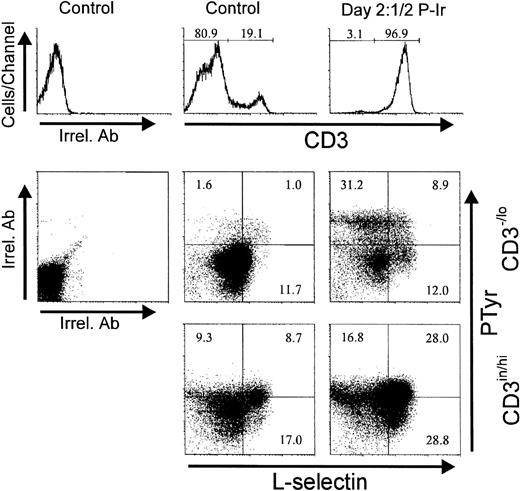
Figure 14 shows that most CD3−/lo cells having acquired an α4histatus also acquired PTyrhi labeling. Similar results were obtained for α5hi acquisition related to PTyrhi levels (not shown). Surprisingly, at day 21/2 P-Ir, the majority of CD3−/lo PTyrhi cells still exhibited L-sel−/in labeling (Fig15), thus suggesting that the increase in intracellular PTyr was not time-associated with L-sel upregulation in these cells.
Intracellular phosphotyrosine content and integrin 4 chain surface expression in thymocytes from control or day 21/2 P-Ir mice. Plots show PTyr and integrin 4 chain levels according to the level of CD3 expression as defined in the histograms. Background labeling with irrelevant antibodies (Irrel. Ab) is also shown. Values were obtained with the labeling of pooled thymocytes from at least three animals per point.
Intracellular phosphotyrosine content and integrin 4 chain surface expression in thymocytes from control or day 21/2 P-Ir mice. Plots show PTyr and integrin 4 chain levels according to the level of CD3 expression as defined in the histograms. Background labeling with irrelevant antibodies (Irrel. Ab) is also shown. Values were obtained with the labeling of pooled thymocytes from at least three animals per point.
Intracellular phosphotyrosine contents and L-selectin surface expression in thymocytes from control or day 21/2 P-Ir mice. Plots show PTyr and L-sel levels according to the level of CD3 expression as defined in the histograms. Background labelings with irrelevant antibodies (Irrel. Ab) are also shown. Values were obtained with the labeling of pooled thymocytes from at least three animals per point.
Intracellular phosphotyrosine contents and L-selectin surface expression in thymocytes from control or day 21/2 P-Ir mice. Plots show PTyr and L-sel levels according to the level of CD3 expression as defined in the histograms. Background labelings with irrelevant antibodies (Irrel. Ab) are also shown. Values were obtained with the labeling of pooled thymocytes from at least three animals per point.
CD25+ cells are the most adherent to ECM; adhesion is lost as CD3 expression is upregulated; enhanced ECM adhesion hallmarks cells in the DN stage or transiting to the DP stage.
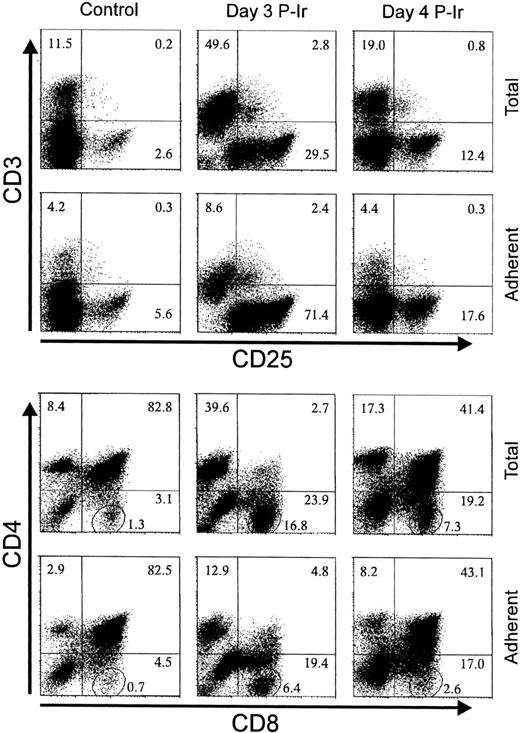
Taking into account the modulation of ECM receptors on thymocytes at different stages of differentiation, as shown during the thymic regression/reconstitution process after irradiation, and the simultaneous increase in the intracellular phosphotyrosine levels and FN receptors, we searched for the phenotypes of ECM interacting thymocytes. For this purpose, the major histocompatibility complex (MHC)-compatible 2BH4 thymic epithelial cell (TEC) line was used as a source of ECM. Figure 16 shows the phenotypes of adherent thymocytes recovered when control, day 3, or day 4 P-Ir thymocytes were allowed to bind to a subconfluent monolayer of 2BH4 cells. Adherent cells were enriched for CD3−/loCD25in/hi cells and depleted for CD3hi cells. CD4/CD8 profiles showed a simultaneous enrichment of DN cells among these thymocytes. It was noteworthy that, despite no marked changes in the percentages of CD8+ cells between total and adherent cells, the amounts of CD8+ cells closer to the axis (enclosed in circles in Fig 16) were reduced. This indicates that ECM adherent thymocytes were also enriched for cells transiting to the DP stage.
The phenotype of TEC adherent thymocytes. Thymocytes (2.5 × 10⁷ in 1 mL FCS-free medium) from control, day 3, or day 4 P-Ir were added to 2BH4 subconfluent monolayers in 25-cm2 flasks and incubated for 1 hour at 37°C. Nonadherent thymocytes were removed by aspiration followed by three gentle washes with warm medium. Adherent thymocytes were recovered in cold medium with FCS and stained for the markers shown on the axis. The circled region in the lower set of panels shows the percentage of CD8+ cells highly negative for CD4 labeling (ie, mature CD8 cells). Values were obtained with the labeling of pooled thymocytes from at least three mice per point.
The phenotype of TEC adherent thymocytes. Thymocytes (2.5 × 10⁷ in 1 mL FCS-free medium) from control, day 3, or day 4 P-Ir were added to 2BH4 subconfluent monolayers in 25-cm2 flasks and incubated for 1 hour at 37°C. Nonadherent thymocytes were removed by aspiration followed by three gentle washes with warm medium. Adherent thymocytes were recovered in cold medium with FCS and stained for the markers shown on the axis. The circled region in the lower set of panels shows the percentage of CD8+ cells highly negative for CD4 labeling (ie, mature CD8 cells). Values were obtained with the labeling of pooled thymocytes from at least three mice per point.
α4 Integrin rather than α5 integrin intervenes in the adhesion of day 3 P-Ir thymocytes to thymic epithelial cells.
The above experiments showed that an increase in the expression of ECM receptors on thymocytes was related to their adhesiveness to ECM components. However, they did not prove that the ECM receptors studied were responsible for this adhesiveness. To address this issue, anti-α4 or anti-α5 chain MoAbs reported to block integrin binding to FN or peptides that mimic FN and interfere with integrin binding to FN were assayed for their capability to inhibit adhesion of day 3 P-Ir thymocytes to 2BH4 monolayers (Table 2). Adhesion was strongly blocked by anti-α4 chain MoAb (60% inhibition) and the FN 1-25 IIICS peptide which contains the critical LDV motif recognized by α4β1 integrin (70% inhibition). A FN 90-109 IIICS segment, which contains a critical REDV motif also recognized by α4β1 integrin,25 exhibited a poor inhibitory effect (21%). Anti-α5 chain MoAb or FN GRGDS peptide which contains the critical RGD motif recognized by α5β1 integrin exhibited no or poor (18%) anti-adhesive action, respectively.
Adhesion of Day 3 P-Ir Thymocytes to Thymic Epithelial Cell Monolayers in the Presence of MoAb Directed to FN Receptors or Peptides Mimicking FN or LN Moieties
| Addition . | Amount . | Concentration (mmol/L) . | Relative Binding . | |
|---|---|---|---|---|
| Exp 1 . | Exp 2 . | |||
| No | — | — | 100.0* | 100.0* |
| Rat Ig | 20 μg/mL | — | 99.6 | 89.2 |
| Anti-α4 chain antibody | 20 μg/mL | — | 43.7 | 37.2 |
| Anti-α5 chain antibody | 20 μg/mL | — | 100.7 | 93.2 |
| FN 1-25 IIICS (LDV)†,‡ | 1 mg/mL | 0.37 | 23.5 | 30.0 |
| FN 90-109 IIICS (REDV)†,‡ | 1 mg/mL | 0.42 | 77.8 | 79.6 |
| FN GRGDS‡ | 1 mg/mL | 2.04 | 81.9 | 83.6 |
| LN 925-933 (YIGSR)‡ | 1 mg/mL | 1.03 | 102.4 | 87.6 |
Thymocytes (1.5 × 10⁷ in 1 mL FCS-free medium) were pre-incubated in the presence of MoAb or peptides for 30 minutes on ice bath and then added to 2BH4 monolayers. After an additional incubation of 1 hour at 37°C, nonadherent thymocytes were removed by aspiration followed by three washes with warm medium. Adherent thymocytes were recovered in cold medium with FCS after beating the culture flasks and pipette flushing.
100% represents 7.7% and 4.3% of total thymocytes used in Exp 1 and Exp 2, respectively.
IIICS means the alternatively spliced type III connecting segment from FN.
In bold are shown the amino acid sequences critical for integrin binding (LDV or REDV for α4β1, RGD for α5β1, and YIGSR for the 67-kD LN receptor).
Previous results from our laboratory have shown that the α6 integrin chain mediates thymocyte adhesion to TEC.11 To determine if the nonintegrin 67-kD cell receptor for LN was also involved in thymocyte/TEC adhesion we assayed the 925-933 amino acid sequence of the LN-β1 chain that contains the critical YIGSR motif targeted by this receptor.26 As shown in Table 2, this peptide failed to block TEC/thymocyte adhesion.
DISCUSSION
In this report we used P-Ir thymocyte reconstitution to study ECM receptor expression and function during thymocyte differentiation. With the 250-cGy dose the onset of repopulation was hastened by 2 to 3 days when compared with doses of 600 or 750 cGy used in most, if not all, previous reports dealing with this subject.20,27 28 Even though the dose used by us seems to spare more thymic resident precursors, as suggested by a 5- to 10-fold higher cellular input after repopulation, the CD3/CD4/CD8-defined subpopulation profiles obtained during the regression/reconstitution process were found to be similar to those reported with higher radiation doses.
Previous reports have shown that α4hi cells are better represented within DN and CD8in thymocyte subsets.1,6 It was also demonstrated that CD25+thymocytes were the main representative α4hi cells among DN cells.6 Our results confirm and expand these findings. Here we show that, in addition to the α4 chain, L-selectin and the α5 integrin chain are also upregulated in CD25+ cells. The upregulation of these ECM receptors is maintained up to the complete loss of CD25 expression, along with the onset of P-Ir reconstitution in adult mice or during ontogeny. The expression of these receptors is suddenly downregulated after the DP phenotype has been reached (days 4 and 5 P-Ir). This downregulation still occurs in the CD3−/lo stage since on days 4 and 5 P-Ir more than 90% of the DP cells bear this phenotype. However, a small fraction of α4hi and/or α5hi cells reach the SP CD3in/hi phenotypes (as suggested by their permanence on day 2 P-Ir) when CD3in/hi cells account for more than 98% of SP thymocytes. The higher percentage of α5hi than α4hi cells among CD4+thymocytes in control mice or after day 5 P-Ir (when CD3in/hi CD4+ cells reappear) suggests that α5 expression is preserved for a longer time than α4hiexpression, at least during the beginning of maturation of some cells of this subset. The increase in L-selhi CD4+cells until day 3 P-Ir, or of L-selhi CD8+cells until day 2 P-Ir (when >98% of SP cells are CD3in/hi) is in accordance with the literature, which points to an increase in L-sel expression as an indicator of terminal maturation for a fraction of thymic lymphocytes.29
Discrete numbers of L-sel−, α4−, or α5− cells were present in control mice. Some exhibited a CD3−CD44−phenotype (data not shown) and increased until day 2 P-Ir, most likely representing cells of other leukocyte series. Others exhibited a DN or CD4+ CD3/TcRαβinCD25−B220− CD44hiCD45RB+ CD45RC−CD69+phenotype (data not shown). These cells represented 1% to 3% of control mouse thymocytes and increased relatively more than fivefold in day 2 or 3 P-Ir mice (30% to 50% of CD3in thymocytes). On the basis of their phenotype, these cells appear to be IL-2Rβ+ and/or NK1.1+thymocytes.30 31
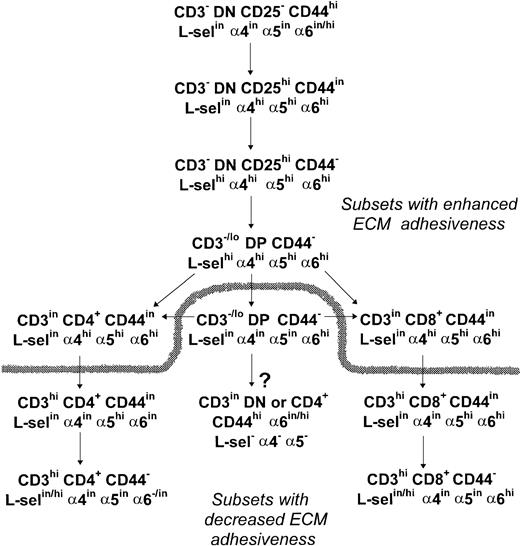
With regard the expression of the LN receptor in thymocytes, our results show that an α6hi labeling profile is seen until the early CD4+ or late CD8+ stages of thymocyte differentiation. Maintenance of an α6hi expression in more mature staged CD8+ cells could be involved in their preferential medullary localization because the medulla exhibits a higher density of LN (data not shown), and class I antigens than the cortex.32 Alternatively, the α6hi profile of these cells could be involved in the maturational delay of CD8+ cells as compared with CD4+cells.18 In summary, our analysis of ECM receptor expression during murine thymocyte development supports the scheme proposed in Fig 17.
Schematic representation of ECM receptor expression and adhesive function throughout thymocyte differentiation. A high expression of the ECM adhesion receptors, in special FN receptors, and an increased adhesiveness to TEC cells hallmarks the early steps of thymocyte differentiation. Recently generated DP thymocytes keep an upregulated expression of L-selectin, 4, and 5 integrin chains, while DP thymocytes emerging later during thymus reconstitution exhibit a downregulated profile of these ECM receptors. During SP cell maturation the 4 chain is downregulated before the 5 chain, and L-selectin is upregulated in a fraction of fully mature thymocytes, while a more marked downregulation of the 6 chain is observed in CD4+ cells than in CD8+ cells. The dashed line splits thymocyte subsets according to their high or low TEC adhesive capabilities. The arrow tagged with a question mark shows a CD3inCD45RC− subset that is enriched after irradiation and most likely represents IL-2Rβ+and/or NK1.1+ thymocytes of still undefined origin in C57Bl/6 mouse thymus, according to the literature.
Schematic representation of ECM receptor expression and adhesive function throughout thymocyte differentiation. A high expression of the ECM adhesion receptors, in special FN receptors, and an increased adhesiveness to TEC cells hallmarks the early steps of thymocyte differentiation. Recently generated DP thymocytes keep an upregulated expression of L-selectin, 4, and 5 integrin chains, while DP thymocytes emerging later during thymus reconstitution exhibit a downregulated profile of these ECM receptors. During SP cell maturation the 4 chain is downregulated before the 5 chain, and L-selectin is upregulated in a fraction of fully mature thymocytes, while a more marked downregulation of the 6 chain is observed in CD4+ cells than in CD8+ cells. The dashed line splits thymocyte subsets according to their high or low TEC adhesive capabilities. The arrow tagged with a question mark shows a CD3inCD45RC− subset that is enriched after irradiation and most likely represents IL-2Rβ+and/or NK1.1+ thymocytes of still undefined origin in C57Bl/6 mouse thymus, according to the literature.
Analysis of human thymocytes showed that cells with high expression of α4 and α5 integrin chains are preferentially distributed among DN, DP, and CD4+ cells.8 This suggests that in the human thymus the increased expression of these chains is also primordially linked to the transit of DN cells to the DP stage because in this species this transit occurs by the preferential acquisition of the CD4 antigen.33,34 Three other features of human thymocyte differentiation also seem to be shared by murine thymocyte differentiation: (1) the high expression of L-selectin, not only in mature, but also in very immature CD34+cells29; (2) a longer α5hi expression compared with α4hi expression during thymocyte maturation35; and (3) the presence of α4− or α5− cells exhibiting a non-T series CD3−CD4−CD7−CD8−phenotype.35
Our functional adhesion assays using thymocytes from control and day 3 or 4 P-Ir mice showed an enrichment of CD25in/hi cells, DN cells, and CD8+ cells transiting to the DP phenotype. This increase paralleled a decrease in the adhesion of more mature CD4+ and CD8+ cells and a depletion of CD3hi cells among adherent thymocytes. Therefore, the upregulation of ECM receptors on thymocyte subsets is closely correlated with their capability to bind to epithelial cells or their ECM secretion products. This is in agreement with previous data showing that DN cells are the most adhesive, while SP cells are the least adhesive thymocytes to TEC monolayers or FN-coated surfaces.1 6
It is important to stress that, in our adhesion assays, control or day 3-4 P-Ir thymocytes furnished adhesion yields of 2% or 4% to 8%, respectively. A second adhesion attempt with the same thymocyte samples (day 3 P-Ir) showed only 1/3 of the cells adhered in the first assay, although a large amount of cells expressing a high density of ECM receptors still remained in the supernatant after the first adhesion assay (not shown). This indicates that ECM binding sites on TEC monolayers were not overloaded with an excess of thymocytes and that not all thymocytes (despite their high density of ECM receptors) are simultaneously prone to interact with ECM components. This behavior could exist in vivo, for instance, to allow locomotion or opportune alternative signals, or may be a consequence of loss of activation by in vitro manipulation.
The efficiency of both the anti-α4 chain MoAb and the peptide with the LDV cell attachment motif, recognized by the α4 chain, in blocking adhesion of thymocytes to epithelial cells, shows that the interaction of this integrin with the IIIC segment of FN is critical for this attachment. Other FN cell attachment motifs, such as the REDV present in the IIIC segment, also recognized by the α4 chain, or the RGD motif present in the 120-kD segment and recognized by the α5 chain, seem to play a secondary role in this adhesion. This mandatory role of the α4 chain as compared with the α5 chain in mediating thymocyte/epithelial adhesion has been also reported using another thymic cell line.1 6 Interestingly, adherent thymocytes (day 3 P-Ir) recovered from control or anti-α4 MoAb or LDV motif peptide–treated cultures revealed no major differences in the percentages of CD25/CD4/CD8-defined subpopulations recovered (not shown).
The LN receptors seem to be involved in some aspects of thymus physiology. In vitro, the binding of murine pre-T cells to thymic endothelial cells can be blocked by anti-α6 integrin MoAb in an LN-independent way.36 A previous report from our laboratory has shown that addition of an anti-α6 integrin MoAb inhibits thymocyte adhesion to TEC and their exit from isolated thymic nurse cells.11 Our blocking experiments (Table 2) failed to reveal the participation of the YIGSR motif of the LN-β1 chain, recognized by the nonintegrin receptor of 67 kD, in thymocyte binding to 2BH4 cells. Therefore, integrins seem to be the main LN receptors involved in thymocyte/TEC interaction.
CD44 is an ECM receptor of the proteoglycan family able to bind to hyaluronic acid, and to a lesser extent to FN and collagen.21 Recently, using reaggregated thymus organ cultures, it has been shown that both epithelial cells and fibroblasts are necessary to generate DP cells from CD25+CD44+ precursors, whereas the more advanced staged CD25+CD44− precursors required only the former to do so. Interestingly, addition of anti-CD44 or anti-α4 antibodies to these cultures affected the CD25+CD44+ → DP transition but not the CD25+CD44− → DP transition. A role for ECM, rather than cell contact, in delivering such signals was also indicated by data showing that addition of anti–VCAM-1 antibodies failed to block the CD25+CD44+ → DP transition and metabolically inactive fixed fibroblasts kept their differentiation-promoting capability on CD25+CD44+ cells, but lost it after hyaluronidase treatment.37 Therefore, downregulation of CD44 expression seems to map the end of ECM fibroblast dependence (or dependence on other mesenchimal cell types) in T-cell development. Additionally, evidence has been obtained indicating that contact at the CD25−CD44+ early stage is critical for bidirectional signaling to occur, leading to the development of both the lymphoid and cortical epithelial compartments during thymus ontogeny.38 We recently described an “epidermal growth factor (EGF)-like” molecule restricted to the surface of DN thymocytes which may represent one of the mediators of this contact, considering that epithelial cells bear EGF receptors and the addition of soluble EGF to fetal organ cultures blocks thymocyte differentiation at the CD44hiCD25dull stage.39
It has been observed that the maximal repopulating rate of 750-cGy irradiated murine thymuses is reached with intrathymic injection of approximately 200 bone marrow cells.40,41 This indicates the existence of a differentiation control window for early precursor in the adult thymus, either due to a certain number of available microenvironmental niches40,42 or to an unknown negative feedback mechanism. If the niche theory is correct, the availability of such niches would depend to some extent on stroma density. Therefore, we could expect that in normal nonregressed thymuses it would be more difficult for precursors to contact such niches, while in the regressed ones this would be easier to do. In other words, as thymocyte cellularity increases, the rate of differentiating precursors would decrease due to niche disruption and/or dilution. Decreased contact with the microenvironment would also reduce the survival of differentiating thymocytes, as recently observed to occur with germinal center B lymphocytes.43
Finally, interaction of mature lymphocytes with ECM components has been shown to promote the phosphorylation of tyrosine residues in various proteins.44,45 Within this context, the fact that SCF has been shown to increase the avidity of α4β1 and α5β1 integrins for FN in hematopoietic cell lines is noteworthy.46 If CD25−CD44+(c-kit++) precursors also exhibit such upregulated set of counter-receptors or if this pattern is acquired after a closer contact with stroma remains unknown. Also, treatment of human thymocytes with antibodies against β1 or α5 integrin chains induces tyrosine phosphorylation in some still unidentified proteins.24 Our results of intracellular PTyr labeling of CD3−/lo thymocytes from day 21/2, rich in CD25+ cells, also suggest that interaction with thymic ECM, namely FN, may contribute to bringing these thymocytes to a high status of activation. At this particular moment of early thymocyte differentiation, the increase of intracellular PTyr was temporarily correlated with the increase of α4 or α5 chain expression in CD3−/lo cells, but not with the increase in L-sel expression (Figs 12 and 13). Indeed, the shape of the integrin plots suggests that the increase in integrin expression precedes the PTyrhi condition.
In conclusion, our data reinforce the concept that high levels of ECM receptors prepare thymocytes to interact with ECM components. Physiologically, this interaction is crucial for T-cell development. It could guide thymocytes to a more intimate contact with stromal cells, thus permitting the reception of survival signals provided by the latter, such as membrane cytokines. It could serve to increase the sensitivity to antigens thus cooperating with the processes of positive and/or negative selection, as already observed with mature T cells. Additionally, fine-tuned variations in the density or the activation status of diverse ECM receptors, some with distinct membrane placement, may dictate the ordered events of adhesion and de-adhesion (ie, migration) necessary for an adequate progress through the steps of thymocyte differentiation.
ACKNOWLEDGMENT
We thank the staff of the animal care facilities and of the Radiotherapy Center of the Brazilian National Cancer Institute, especially Terezinha de Jesus dos Santos Pereira and Dr Joel Francisco Gonçalves, respectively. We also express our gratitude to Dr Amarante-Mendes (University of São Paulo, Brazil) for providing the thymic epithelial cell line.
Supported by grants from the Brazilian Ministry of Health, Ary Frauzino Foundation, PADCT/ CNPq, and PRONEX/CNPq (Brazil).
The publication costs of this article were defrayed in part by page charge payment. This article must therefore be hereby marked “advertisement” in accordance with 18 U.S.C. section 1734 solely to indicate this fact.
REFERENCES
Author notes
Address reprint requests to Sergio R. Dalmau, PhD, Program of Experimental Medicine, Basic Research Center, National Cancer Institute, Praça Cruz Vermelha 23, 6o andar, 20230-130, Rio de Janeiro, RJ, Brazil.

This feature is available to Subscribers Only
Sign In or Create an Account Close Modal