Abstract
Human granzyme H is a neutral serine protease that is expressed predominantly in the lymphokine-activated killer (LAK)/natural killer (NK) compartment of the immune system. The gene that encodes this granzyme is located between the granzyme B and cathepsin G genes on human chromosome 14q11.2. Although the murine orthologue of human granzyme H has not yet been identified, murine granzymes C, D, E, F, and G also lie between the murine granzyme B and cathepsin G genes on murine chromosome 14; murine granzymes C, D, and F are also highly expressed in LAK cells, but minimally in cytotoxic T lymphocytes (CTL). We therefore tested whether the 5′ flanking region of human granzyme H contains the cis-acting DNA sequences necessary to target a reporter gene to the LAK/NK compartment of transgenic mice. A 1.2-kb fragment of 5′ flanking human granzyme H sequence was linked to an SV40 large T-antigen (TAg) reporter gene and used to create six transgenic founder lines. SV40 TAg was specifically expressed in the LAK cells of these mice, but not in resting T or NK cells, in CTL, or in any other tissues. Most mice eventually developed a fatal illness characterized by massive hepatosplenomegaly and disseminated organ infiltration by large malignant lymphocytes. Cell lines derived from splenic tumors were TAg+ and NK1.1+ large granular lymphocytes and displayed variable expression of CD3, CD8, and CD16. Although these cell lines contained perforin and expressed granzymes A, B, C, D, and F, they did not exhibit direct cytotoxicity. Collectively, these results suggest that the 5′ flanking sequences of the human granzyme H gene target expression to an NK/T progenitor compartment and to activated NK (LAK) cells. Mice and humans may therefore share a regulatory “program” for the transcription of NK/LAK specific granzyme genes.
THE HUMAN GRANZYME H gene encodes a neutral serine protease1-4 that is expressed predominantly in the cytotoxic granules of natural killer (NK) and lymphokine-activated killer (LAK) cells. This gene lies between the human granzyme B and cathepsin G genes on human chromosome 14q11.2.5 Although granzyme B and cathepsin G are highly conserved between mice and humans, the precise functional orthologue of human granzyme H has not been determined.6,7 Several murine granzymes lie between murine granzyme B and murine cathepsin G, including granzymes C, F, G, D, and E (5′ → 3′).8-10 Interestingly, granzymes C, D, and F are minimally expressed in murine cytotoxic T lymphocytes (CTL) (created by 5-day mixed lymphocyte cultures or 2 days of exposure to 50 U/mL recombinant human interleukin-2 [rhIL-2] and 5 μg/mL concanavalin A [Con A]), but are highly expressed in murine LAK cells.11Therefore, murine granzymes C, D, and F and human granzyme H are similarly located between granzymes B and cathepsin G and have similar expression profiles. These data suggest that mice may have an NK/LAK regulatory compartment for granzymes that is similar to that of humans.
To test this hypothesis, we created transgenic mice containing granzyme H regulatory sequences driving a reporter gene. We decided to use the 5′ flanking region of granzyme H in our initial targeting construct because a similar 5′ flanking region upstream from the the human granzyme B gene specifically directs expression of a growth hormone reporter gene to the activated CTL compartment of transgenic mice.12 13 These results suggested that regulatory information that restricts granzyme H expression to the LAK/NK compartment might also lie immediately upstream from that gene.
Therefore, we used a 1.2-kb region just upstream from granzyme H to drive the SV40 TAg gene in transgenic mice. Young transgenic mice containing this construct express T-antigen (TAg) predominantly in the LAK compartment. With time, a large percentage of mice expressing this transgene developed a fatal lymphoma-like illness; the tumor cells in the spleens of these mice were TAg+ and were capable of transferring the tumor phenotype to secondary severe combined immunodeficient (SCID) animals. Cell lines derived from tumors had a large granular lymphocyte morphology, and were NK1.1+ and CD16+; the lines variably expressed CD3, CD8, and CD16, suggesting that TAg contributed to the transformation of cells that are of the NK/T lineage. These data suggest that the regulatory compartment in which human granzyme H is expressed is conserved in the mouse, and that murine transcription factors can recognize the human sequences. They also suggest that granzyme H, and its murine counterparts, granzymes C, D, and F, are probably expressed normally at an early stage of NK/T cell development, and in activated NK (LAK) cells.
MATERIALS AND METHODS
Construct.
1.2 kb of the 5′ region of granzyme H was obtained by polymerase chain reaction (PCR) using the forward primer: GTCGACGGAGTCTCGCTCTGTCACCC (−1212 to −1183) and the reverse primer: TATACCTAGGAGGCTGCCCAGGTCAGAGCT (+20 to +1). The resultingSal 1/BamH1 fragment was subcloned into pUC19. ABamH1 linkered fragment containing 2.7 kb of SV40 Large TAg (+5156 to +2450)14 was inserted into the BamH1 site downstream from the sequence in the “sense” orientation. A 1.0-kbNde 1 fragment derived from the SV40 sequence was used as a probe for Southern blotting.
Production of transgenic mice.
The 3.9-kb gel-purified fragment containing 5′ granzyme H (−1212 to +20) driving TAg was microinjected into the male pronuclei of oocytes derived from C57BL/6 × C3H/He crosses. These oocytes were implanted into pseudopregnant Swiss Webster outbred female recipients. Tail DNA samples derived from 39 potential founders were analyzed by Southern blotting using a 1-kb Nde 1 TAg fragment to detect the presence of the transgene. Mice were maintained in a Specific Virus Antibody Free (SVAF) barrier facility.
Production of CTL and adherent (Ad) LAK.
One-way mixed lymphocyte cultures were performed as previously described15 to generate alloreactive CTL. Activated CTL were also generated by incubating splenocytes in K5 media (5% heat-inactivated fetal calf serum, 1% glutamine-L, 1% nonessential amino acids, 1% sodium pyruvate, 0.05% penicillin/streptomycin, in RPMI 1640 pH 7.2) with 50 U/mL rhIL-2 (Chiron, Emeryville, CA) and 5 μg/mL Concanavalin A (ConA; Sigma, St Louis, MO).12 AdLAK cells were generated by isolating lymphocytes with a Hypaque-Ficoll 1119 (Sigma) gradient and plating cells at 2 × 10⁶ cells/mL in K5 media with 1,000 U/mL rhIL-2 for 10 days.11 On day 3, media was centrifuged at 2,000 rpm for 5 minutes to remove dead cells, and the supernatant was returned to the flask. Cells were procured for analysis 7 days later.
Western blots.
Total proteins were prepared from activated CTL, AdLAK, or organ homogenates by sonicating these cells in 200 μL of lysis buffer (1 mol/L NaCl, 25 mmol/L Tris 7.5, 0.1% Triton X-100); extracts were cleared by centrifugation, and protein concentration was determined using the Bio-Rad Protein Assay (Bio-Rad Laboratories, Hercules, CA). Equal quantities of total proteins were loaded onto 10% sodium dodecyl sulfate-polyacrylamide gel electrophoresis (SDS-PAGE) gels using reducing conditions, transferred to nitrocellulose, and analyzed with a standard Western blotting technique using anti-SV40 large TAg antiserum (Pharmingen, Los Angeles, CA), antigranzyme B antiserum,16 or anti–β-actin antiserum (Sigma) followed by detection with chemiluminescense (Amersham, Arlington Heights, IL).
Production of cell lines.
Cell lines were generated by plating 1 or 10 spleen cell(s)/well in 96-well plates in K5 media with 1,000 U/mL rhIL-2. Plates were incubated at 37°C, in 5% CO2 for 4 to 5 weeks. All cell lines were maintained in K5 media with 500 U/mL rhIL-2 and passaged with a 1:10 split weekly.
Flow cytometry.
A total of 2 × 10⁶ cells per sample were washed twice in cold phosphate-buffered saline (PBS), resuspended in 100 μL fluorescence-activated cell sorting (FACS) buffer (1% bovine serum albumin [BSA], 0.1% NaN3 in PBS), and incubated with antibodies (see Table 1) directly conjugated to either phycoerythrin (PE) or fluorescein isothiocyanate (FITC) (Pharmingen) at 4°C, 45 minutes. Cells were then washed twice and resuspended in FACS buffer and scanned using a Becton Dickinson FACScan (San Jose, CA). To label cells with antimouse SV40 large TAg antibody (FITC), 2 × 10⁶ cells in 100 μL FACS buffer were first incubated with PE-conjugated monoclonal antibodies specific for cell surface antigens (CD4, CD8, CD16, NK1.1, γδ TCR) for 30 minutes on ice. Cells were washed twice with FACS buffer, and then permeabilized and fixed with 100 μL of Cytofix/Cytoperm solution (Pharmingen, San Diego, CA) for 20 minutes at 4°C. Cells were washed twice in 1 × Perm/wash solution (Pharmingen), resuspended in 50 μL of Perm/wash solution containing 0.25 μg of FITC-conjugated SV40 large TAg antibody (Pharmingen) and incubated at 4°C for 30 minutes. Cells were washed twice with Perm/wash solution, resuspended in FACS buffer, and analyzed using a Becton-Dickinson FACScan.
Direct cytolytic assays.
Six cell lines or AdLAK cells were incubated with the NK-sensitive YAC-1 (H-2a; a tissue culture cell line of a Moloney murine leukemia virus–induced lymphoma of A/Sn origin) target cells in standard 51Cr or Iododeoxyuridine [125I] (125IUdR) release assays, essentially as described.17
RESULTS
Vector design and production of transgenic mice.
We previously showed that 1.1 kb of 5′ flanking sequence from the human granzyme B gene was sufficient to target expression to activated CTL in transgenic mice.13 A sequence analysis comparing human and murine granzyme B 5′ flanking sequences showed extensive regions of homology within the first 500 bp upstream from the transcription initiation site.13 We performed dot matrix analyses comparing the 5′ flanking regions of human granzyme H, human granzyme B, and mouse granzymes C, D, and F. These results showed limited regions of homology between human granzymes H and B, with more extensive homology in the 5′ flanking regions of human granzyme H and murine granzymes C, D, and F (ref 3 and data not shown).
Therefore, we created a targeting vector containing 1.2 kb of 5′ genomic granzyme H sequence (−1212 to +20) driving a 2.7-kb fragment derived from SV40 containing large TAg (nucleotides +5156 to +2450). Transgenic mice were created using established methods.13 DNA samples derived from 39 potential founders were analyzed by Southern blotting using a 1.0-kb Nde1 fragment derived from the TAg gene. Six founders were identified (nos. 33, 36, 37, 153, 164, and 171) containing transgene copy numbers of 3, 2, 4, 7, 1, and 2 per haploid genome, respectively (data not shown).
Expression of the granzyme H-TAg construct in the LAK, but not CTL compartment.
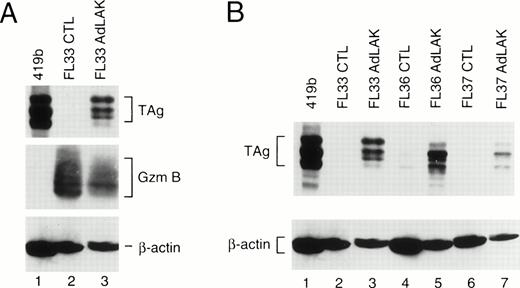
To determine whether these mouse lines expressed the transgene, each founder was bred with nontransgenic C57Bl/6 × C3H/He mice, and transgenic F1 mice from these matings were analyzed. Spleens from young mice (≤3 months) were harvested and divided into two equal portions. One portion was incubated in 50 U/mL rhIL-2 and 5 μg/mL ConA for 2 days to generate CTL. The other half of the spleen was incubated with 1,000 U/mL rhIL-2 for 10 days to generate AdLAK cells. Total proteins were extracted from the cultured cells, normalized for total protein contact, and analyzed by Western blotting (Fig 1). Blots were first hybridized with an anti-TAg antibody, and then stripped and rehybridized with an antimurine granzyme B antibody (as a measure of lymphocyte activation), and then an antimurine β-actin antibody (as a protein loading and transfer control). Large TAg (≈94 kD) is detected in the positive control cell line 419b18 (lane 1). In CTL derived from an F1 mouse from founder line 33, granzyme B is easily detected, showing that these cells are activated (resting CTL do not express granzyme B); however, no TAg is detected. In contrast, adherent LAK cells from the same spleen express granzyme B and TAg. In Fig 1B, an analysis is performed with three F1 mice derived from three independent founder lines (nos. 33, 36, and 37); TAg is easily detected in the AdLAK cells, but is minimally expressed in CTL derived from the same spleens. Granzyme B levels were similar for the CTL and AdLAK cells for all of these spleens (data not shown). Of the three additional founder lines (nos. 153, 164, and 171), only no. 153 showed expression of TAg in the LAK compartment, and levels were similar to that of line 37. Lines 164 and 171 had no detectable expression of TAg in AdLAK cells.
(A) Western analysis of total proteins obtained from CTL or AdLAK cells from a mouse derived from founder line 33. Total protein from the positive control cell line (419b, lane 1) or from CTL or AdLAK cells from the spleen of a single mouse were cultured as described, and whole cell extracts were made. Total protein content was normalized, and SDS-PAGE was performed followed by Western analysis. The blots were first hybridized with an anti-TAg antibody, stripped, and then rehybridized with antibodies against murine granzyme B and then β-actin. CTL from the spleen of this mouse contains abundant granzyme B, but no detectable TAg; AdLAK cells contain granzyme B and TAg. (B) An analysis similar to that performed in (A) is shown, but with mice from three independent founder lines, as designated.
(A) Western analysis of total proteins obtained from CTL or AdLAK cells from a mouse derived from founder line 33. Total protein from the positive control cell line (419b, lane 1) or from CTL or AdLAK cells from the spleen of a single mouse were cultured as described, and whole cell extracts were made. Total protein content was normalized, and SDS-PAGE was performed followed by Western analysis. The blots were first hybridized with an anti-TAg antibody, stripped, and then rehybridized with antibodies against murine granzyme B and then β-actin. CTL from the spleen of this mouse contains abundant granzyme B, but no detectable TAg; AdLAK cells contain granzyme B and TAg. (B) An analysis similar to that performed in (A) is shown, but with mice from three independent founder lines, as designated.
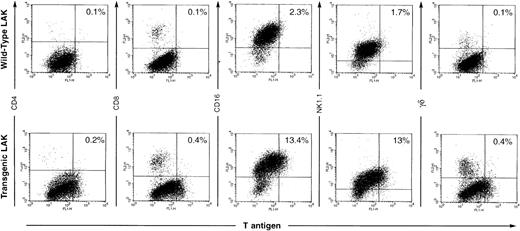
These results were confirmed and extended using two-color flow cytometric analysis (see Fig 2). Resting splenocytes derived from all three founder lines showed very few TAg+ cells by flow cytometric techniques (data not shown, and see Fig 7). Similarly, CTL generated by day 5 mixed lymphocyte reactions or day 2 conA/IL-2 treatment did not show TAg+cells by flow cytometric methods (data not shown). In contrast, day 10 AdLAK cells from all three founder lines showed 10% to 40% TAg+ cells (representative data from one such experiment is shown in Fig 2). Approximately 10% to 15% of the AdLAK cells from the spleen of this transgenic animal were TAg+, and virtually all of the TAg+ cells were CD16+ and/or NK1.1+. Importantly, CD8+ cells generated by high dose treatment with IL-2 were not TAg+. These data strongly suggest that the TAg+ cells within the AdLAK population are predominantly activated NK cells.
Flow cytometric analysis of LAK cells. Spleen cells were incubated in high dose IL-2 for 10 days, and AdLAK cells were harvested for flow cytometric analysis. TAg expression is detected on the x-axis and lymphoid markers on the y-axis. Approximately 10% to 15% of the cells derived from the day 10 adherant LAK preparation are TAg+ and are also CD16+ and/or NK1.1+. Note that the percentage of cells in each compartment is not altered by expression of the transgene.
Flow cytometric analysis of LAK cells. Spleen cells were incubated in high dose IL-2 for 10 days, and AdLAK cells were harvested for flow cytometric analysis. TAg expression is detected on the x-axis and lymphoid markers on the y-axis. Approximately 10% to 15% of the cells derived from the day 10 adherant LAK preparation are TAg+ and are also CD16+ and/or NK1.1+. Note that the percentage of cells in each compartment is not altered by expression of the transgene.
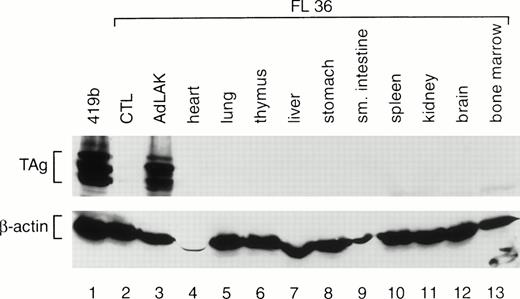
To determine whether TAg was expressed exclusively in AdLAK cells, total proteins were prepared from the organs of transgenic mice. A representative analysis is shown in Fig 3. Equal amounts of protein from the organs of an F1 mouse from founder line 36 were harvested and analyzed by Western blotting with TAg and anti–β-actin antibodies. Abundant TAg expression was detected in the AdLAK cells derived from the spleen of this mouse, but not in CTL or in any other organ, including the resting spleen. Similar results were obtained from the F1 progeny from lines 33 and 37.
Western analysis of total proteins extracted from the various tissues of an F1 mouse from founder line 36. CTL and AdLAK cells were generated as described in Fig 1. The same blot was probed with an anti-TAg antibody, stripped, and then rehybridized with an antimurine β-actin antibody. Note that TAg is expressed only in the AdLAK cells of this mouse.
Western analysis of total proteins extracted from the various tissues of an F1 mouse from founder line 36. CTL and AdLAK cells were generated as described in Fig 1. The same blot was probed with an anti-TAg antibody, stripped, and then rehybridized with an antimurine β-actin antibody. Note that TAg is expressed only in the AdLAK cells of this mouse.
Granzyme H-TAg mice develop fatal lymphomas.
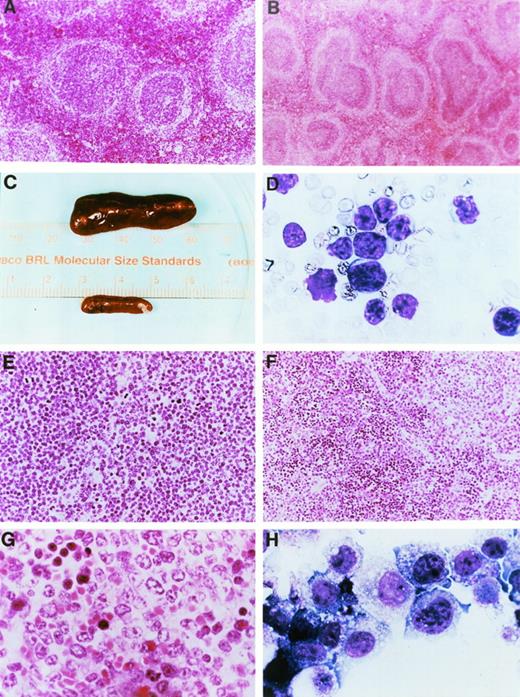
Young mice from founder lines 33, 36, and 37 had no observable phenotype. They displayed normal growth and development, and were fertile. Complete blood counts from these animals showed no abnormalities (data not shown). Gross examination of the spleens from these animals showed that they were not enlarged; however, pathologic evaluation of the spleens showed prominent mantle zones (Fig 4A v B) and prominent germinal centers.
Gross pathology and histopathology of transgenic mice. (A) Low power hematoxylin and eosin (H&E) stain of a spleen from a 2-month-old wild-type mouse. (B) Low power H&E stain of a spleen from a 2-month-old mouse derived from founder line 33. Note the prominent mantle zones and germinal centers in follicles. (C) Spleens from a healthy nontransgenic mouse (top) and a clinically ill transgenic mouse (bottom) from founder line 33 at the time of autopsy. Note massive enlargement of the transgenic spleen. (D) Wright’s-stained peripheral blood smear from a clinically ill mouse. At the time of autopsy, the mouse had massive hepatosplenomegaly and mesenteric lymphadenopathy. The white blood cell count at death was 156,600/μL, the hemoglobin level was 7.8 g/dL, the hematocrit was 17.7%, and the platelet count was 140,000/μL. Note the appearance of intermediate-sized, abnormal lymphocytes in the peripheral blood; ≥95% of peripheral blood cells had this appearance. (E) Low-power view of an H&E-stained section of a spleen from a mouse from founder line 33 dying with massive hepatosplenomegaly. Note the uniform appearance of large cleaved lymphocytes replacing the structure of the spleen. (F) Low-power view of a spleen from a mouse from founder line 37 dying with massive hepatosplenomegaly. Note that the tumor does not completely replace the spleen, in contrast to the spleen shown in (E). (G) High-power view of lymphocytes from a splenic tumor. Note the large cells with irregular cleaved nuclei and eosinophilic nucleoli. (H) Cell line 37.4. Note the appearance of large lymphocytes with multiple azurophilic granules, vacuolization, and large irregular nuclei. All cell lines had similar morphologic features.
Gross pathology and histopathology of transgenic mice. (A) Low power hematoxylin and eosin (H&E) stain of a spleen from a 2-month-old wild-type mouse. (B) Low power H&E stain of a spleen from a 2-month-old mouse derived from founder line 33. Note the prominent mantle zones and germinal centers in follicles. (C) Spleens from a healthy nontransgenic mouse (top) and a clinically ill transgenic mouse (bottom) from founder line 33 at the time of autopsy. Note massive enlargement of the transgenic spleen. (D) Wright’s-stained peripheral blood smear from a clinically ill mouse. At the time of autopsy, the mouse had massive hepatosplenomegaly and mesenteric lymphadenopathy. The white blood cell count at death was 156,600/μL, the hemoglobin level was 7.8 g/dL, the hematocrit was 17.7%, and the platelet count was 140,000/μL. Note the appearance of intermediate-sized, abnormal lymphocytes in the peripheral blood; ≥95% of peripheral blood cells had this appearance. (E) Low-power view of an H&E-stained section of a spleen from a mouse from founder line 33 dying with massive hepatosplenomegaly. Note the uniform appearance of large cleaved lymphocytes replacing the structure of the spleen. (F) Low-power view of a spleen from a mouse from founder line 37 dying with massive hepatosplenomegaly. Note that the tumor does not completely replace the spleen, in contrast to the spleen shown in (E). (G) High-power view of lymphocytes from a splenic tumor. Note the large cells with irregular cleaved nuclei and eosinophilic nucleoli. (H) Cell line 37.4. Note the appearance of large lymphocytes with multiple azurophilic granules, vacuolization, and large irregular nuclei. All cell lines had similar morphologic features.
Many mice from founder lines 33, 36, and 37 eventually developed a clinical illness consisting of weight loss, distention of the abdomen, difficulty with respiration, and hair loss. Mice developing this clinical syndrome were autopsied and analyzed using histopathological techniques. Virtually all of the autopsied mice (n = 30) with this syndrome exhibited massive splenomegaly (Fig 4C), and 21 of 30 exhibited massive hepatomegaly. Thirteen of 30 had grossly evident adenopathy in the mesenteric and/or thoracic lymph nodes. Other organs that were grossly involved at autopsy included the uterus, kidneys, thymus, and lungs in some of the animals. Complete blood counts obtained at the time of autopsy showed abnormalities in many mice. Nine of 30 mice analyzed at autopsy had an elevation in the total white blood cell count (16,000 to 150,000/μL); most of these mice had an elevated number of abnormal lymphocytes in the peripheral blood (Fig 4D). Twenty-one of 30 mice exhibited moderate to severe anemia, frequently associated with severe polychromasia on peripheral smears, suggesting the possibility of a hemolytic component. Twenty-six of 30 mice exhibited a mild to moderate reduction in the absolute platelet count.
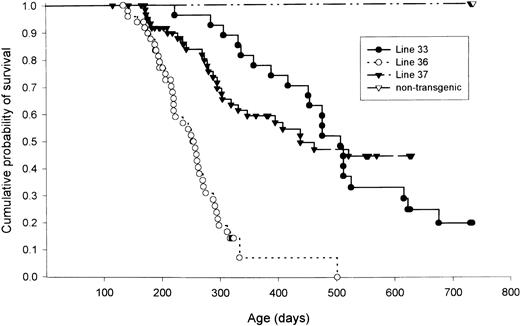
The cause of death for most of animals in all three founder lines was a fatal lymphoma-like illness (Fig 5). Transgenic mice from founder lines 36 and 37 began to die from this illness as early as 6 months of age. One hundred percent of mice from line 36 were dead at 500 days, while mice from lines 33 and 37 did not always develop fatal lymphoma-like illnesses. A small percentage (≈10%) of transgenic mice from all three founder lines developed a “head-tilt” syndrome associated with bilateral osteosarcomas originating from petrous portion of the temporal bones of the skull. These tumors have previously been described,19 and are presumably due to TAg expression from regulatory sequences within the TAg portion of this transgene, and not due to hybrid transcripts initiated from the granzyme H promoter. These mice were excluded from the analysis shown in Fig 5.
Kaplan-Meyer plot of lymphoma-free survival from founder lines 33, 36, 37, and nontransgenic lettermates. Mice that developed temporal bone osteosarcomas were not included in this analysis. n = 117 mice for nontransgenic littermates, n = 25 for line 33, n = 44 for line 36, and n = 48 for line 37.
Kaplan-Meyer plot of lymphoma-free survival from founder lines 33, 36, 37, and nontransgenic lettermates. Mice that developed temporal bone osteosarcomas were not included in this analysis. n = 117 mice for nontransgenic littermates, n = 25 for line 33, n = 44 for line 36, and n = 48 for line 37.
The splenic pathology of several tumors derived from these mice are shown in Fig 4E, F, and G. Although virtually all of the mice with the clinical illness exhibited massive splenomegaly, the tumor burden in these affected spleens was highly variable. Some mice exhibited complete replacement of the spleen with tumor cells, and others had smaller tumor burdens (with large numbers of reactive cells in the spleen and partially preserved follicular morphology). Regardless of the relative tumor burden, the morphology of the abnormal cells in the spleen was consistent in most of the tumors examined. The tumor cells were generally intermediate to large in size, containing nuclei that were oval, irregular, and occasionally frankly cleaved with vesicular chromatin. Many of the nuclei contained distinct (and often prominent) eosinophilic nucleoli. The cytoplasm was generally moderate in abundance and contained no obvious granules on H and E staining. The mitotic rate was brisk (≥80 mitotic figures per 10 high-power fields). In spleens in which the follicular architecture was not completely effaced, the tumors had a T-zone/red pulp distribution. In sum, the splenic tumors were best characterized morphologically as high-grade, diffuse, large cell lymphomas.
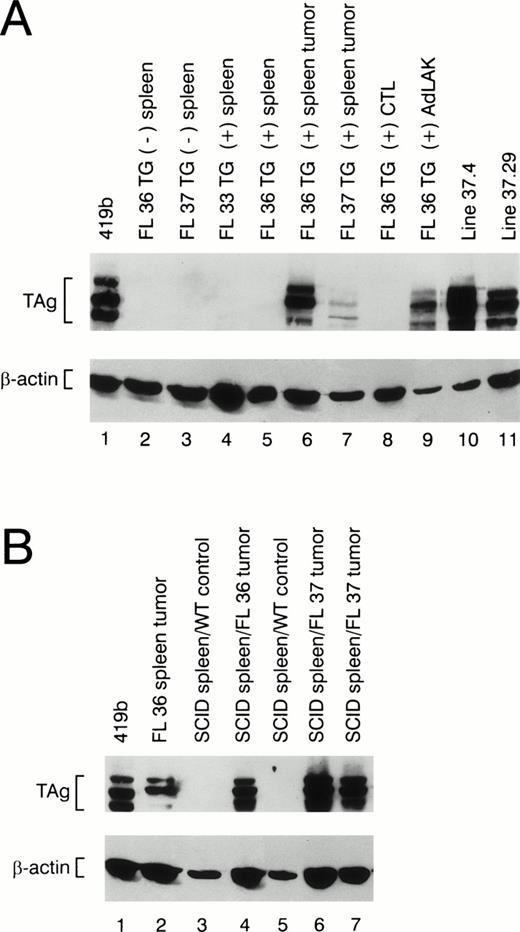
The splenic tumors from 30 mice displaying clinical illness were analyzed for TAg expression by flow cytometry and/or Western blotting. All tumors contained TAg+ cells, but the percentage of TAg+ spleen cells varied considerably from mouse to mouse. Ten of 30 spleen tumors had <2% TAg-expressing cells. Four of 30 tumors had 2% to 20% TAg+ cells, 6 had 20% to 40% TAg+ cells, 3 had 40% to 70% positive cells, and 7 had 70% to 93% TAg+ cells. Western blot analysis of protein extracts derived from spleen tumors also displayed considerable variability in the total TAg that was detected (see Fig 6A, lanes 6 and 7); no TAg was detected in nontransgenic spleens (Fig 6A, lanes 2 and 3) or in transgenic spleens from young healthy animals (Fig 6A, lanes 4 and 5).
Western blot analysis of protein extracts made from wild-type and transgenic mice. (A) Total protein extracts were made from nontransgenic spleens (lanes 2 and 3) or from the spleens of transgene positive mice at age 2 months (lanes 4 and 5). Extracts made from individual spleen tumors from founder lines 36 and 37 are shown in lanes 6 and 7. Extracts made from a young transgenic mouse spleen activated with ConA and 50 U/mL rhIL-2 (CTL) versus 1,000 U/mL rhIL-2 (AdLAK), are shown in lanes 8 and 9. Extracts made from tumor line 37.4 and 37.29 are shown in lanes 10 and 11. (B) Total protein extracts derived from transgenic spleens or SCID spleens injected with wild-type spleen cells or tumor spleen cells are shown. An extract obtained from a tumor spleen derived from founder line 36 is shown in lane 2. Extracts from a SCID spleens injected 8 weeks earlier with wild-type spleen cells are shown in lanes 3 and 5. An extract from a SCID spleen injected with 1 × 10⁸ cells from a line 36 tumor spleen is shown in lane 4, and SCID spleens injected with independent tumors from founder line 37 are shown in lanes 6 and 7. Note the presence of TAg in the SCID spleens from the animals injected with granzyme H-TAg splenic tumors.
Western blot analysis of protein extracts made from wild-type and transgenic mice. (A) Total protein extracts were made from nontransgenic spleens (lanes 2 and 3) or from the spleens of transgene positive mice at age 2 months (lanes 4 and 5). Extracts made from individual spleen tumors from founder lines 36 and 37 are shown in lanes 6 and 7. Extracts made from a young transgenic mouse spleen activated with ConA and 50 U/mL rhIL-2 (CTL) versus 1,000 U/mL rhIL-2 (AdLAK), are shown in lanes 8 and 9. Extracts made from tumor line 37.4 and 37.29 are shown in lanes 10 and 11. (B) Total protein extracts derived from transgenic spleens or SCID spleens injected with wild-type spleen cells or tumor spleen cells are shown. An extract obtained from a tumor spleen derived from founder line 36 is shown in lane 2. Extracts from a SCID spleens injected 8 weeks earlier with wild-type spleen cells are shown in lanes 3 and 5. An extract from a SCID spleen injected with 1 × 10⁸ cells from a line 36 tumor spleen is shown in lane 4, and SCID spleens injected with independent tumors from founder line 37 are shown in lanes 6 and 7. Note the presence of TAg in the SCID spleens from the animals injected with granzyme H-TAg splenic tumors.
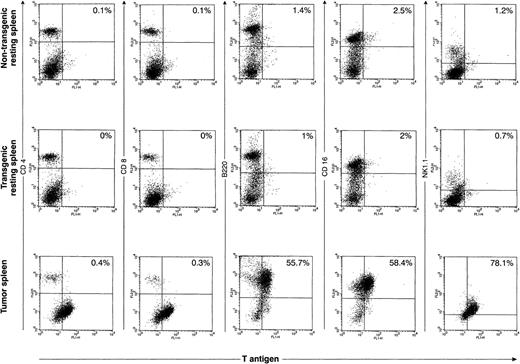
Although we were able to define TAg+ populations within most of the primary tumor spleens, we were not able to successfully perform two-color flow analysis for the primary tumors described above. Single-color flow analysis of these tumors showed that most of the tumors were comprised predominantly of either CD4+ cells or NK1.1+ cells; two tumors were predominantly CD8+. Histologic analysis suggested that many of these tumors contained large numbers of cells that were reactive; therefore, it is impossible to know which cells were the TAg+ tumor cells and which were the reactive cells. However, improved technology for detecting TAg with a novel permeabilization and fixation solution allowed us to perform accurate two-color analysis on two tumors. An example of one is shown in Fig 7. The top panel represents two-color flow analysis of spleen cells from a 16-week-old nontransgenic mouse; the middle set of flow diagrams is from a healthy 16-week-old mouse from founder line 37. The bottom panel represents the analysis from a massively enlarged spleen from a 20-week-old mouse from line 37. In the primary tumor, the TAg+ cells are B220+, CD16+, and NK1.1+. In the second tumor analyzed in this way (from founder line 33), the TAg+ cells were predominantly CD4+. Because of the heterogeneity in the cells in the tumor-bearing spleens, we decided to further analyze the origins of the primary tumor cells by cloning independent lines from several primary tumors.
Flow cytometric analysis of primary spleen cells. Spleen cells from a 4-month-old wild-type spleen (top row), a 4-month-old transgenic spleen from a founder line 37 (middle row), or a massively enlarged spleen from an ill, 5-month-old line 37 mouse were subjected to two-color flow cytometric analysis using an anti-TAg antibody and a variety of lymphoid markers. In the representative tumor shown in this figure, a significant proportion (≈60%) of the primary spleen cells are TAg+. The TAg+ cells are B220+, CD16+, and NK1.1+, but do not stain for CD4 or CD8.
Flow cytometric analysis of primary spleen cells. Spleen cells from a 4-month-old wild-type spleen (top row), a 4-month-old transgenic spleen from a founder line 37 (middle row), or a massively enlarged spleen from an ill, 5-month-old line 37 mouse were subjected to two-color flow cytometric analysis using an anti-TAg antibody and a variety of lymphoid markers. In the representative tumor shown in this figure, a significant proportion (≈60%) of the primary spleen cells are TAg+. The TAg+ cells are B220+, CD16+, and NK1.1+, but do not stain for CD4 or CD8.
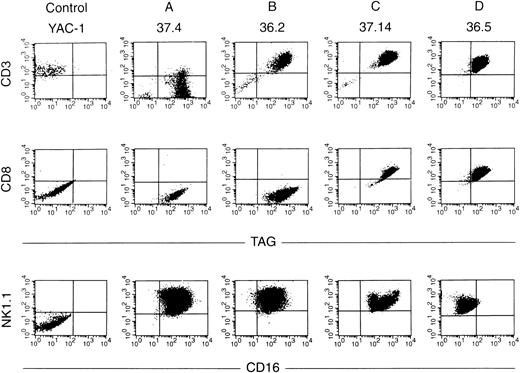
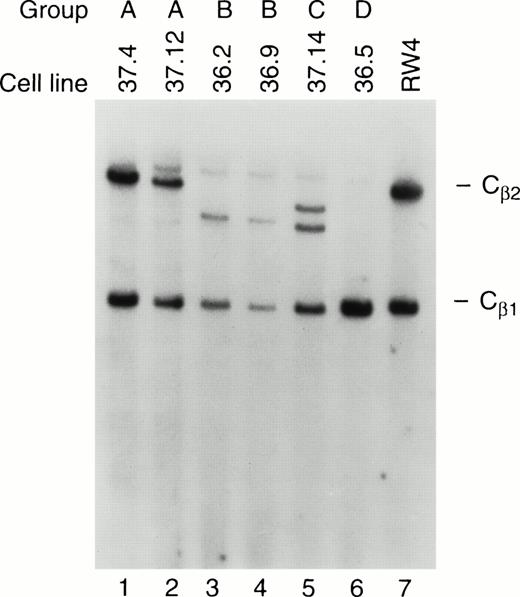
Ten independent tumors were placed into culture, but cell lines grew out from only two tumors, one from a mouse derived from founder line 36 and one from founder line 37. Seven cell lines were obtained from the line 36 tumor, and 11 from the line 37 tumor; the phenotypes of these cell lines have been stable for more than 100 passages. Protein extracts derived from all tumor cell lines contained abundant TAg by Western analysis (see Fig 6A, lanes 10 and 11); flow cytometric analysis also showed expression of TAg in all of the cell lines. Dual-color flow studies (Fig 8 and Table 1) showed that all of the cell lines fell into one of four basic categories, designated A, B, C, and D. All of the cell lines in all four categories were NK1.1+/TAg+. In group A (five lines), the cells were CD3- and CD8−. In group B (6 lines), the NK1.1/TAg+ cells were CD3+CD8−. In groups C (3 lines) and D (4 lines), the cells were CD3+ and CD8+. In categories A, B, and C, the NK1.1+ cells were CD16+; however, in category D, the NK1.1+ cells were CD16−. All of the cell lines were lymphocyte function-associated antigen (LFA)-1+ and IL-2 receptor α+, but were CD2, LY49A, and LY49C negative (Table 1). Cell lines in categories B and D exhibited 2B4 antigen positivity. All of the cell lines were examined for rearrangements of the β-subunit of the T-cell receptor (TCR, Fig 9). Four of five cell lines in group A (CD3−) showed a germline configuration of Cβ1 and Cβ2,20 while all cell lines derived from group B, C, and D (all of which are CD3+) demonstrated TCR Cβ2 rearrangements. Many individual clones from the same tumor displayed unique TCR rearrangements (see Fig 9, lane 3 v 6), suggesting that each spleen contained several independently transformed clones that contributed to the overall tumor phenotype.
Flow cytometric analyses of cell lines. Dual-color flow analysis was performed with an antibody directed against TAg versus CD3 or CD8 (top panels) or with an antibody directed against CD16 versus NK1.1 (bottom panel). Note that all four cell lines analyzed are TAg+ NK1.1+. Cell lines from group A are CD3− CD8−, those in group B are CD3+CD8−, those in groups C and D are CD3+ CD8+. Groups A, B, and C are CD16+, while the cells from group D are CD16−.
Flow cytometric analyses of cell lines. Dual-color flow analysis was performed with an antibody directed against TAg versus CD3 or CD8 (top panels) or with an antibody directed against CD16 versus NK1.1 (bottom panel). Note that all four cell lines analyzed are TAg+ NK1.1+. Cell lines from group A are CD3− CD8−, those in group B are CD3+CD8−, those in groups C and D are CD3+ CD8+. Groups A, B, and C are CD16+, while the cells from group D are CD16−.
Surface Antigens Present on Cell Lines Derived From Splenic Tumors
| Cell Marker . | Control YAC-1 . | Group A . | Group B . | Group C . | Group D . |
|---|---|---|---|---|---|
| CD3 | + | − | + | + | + |
| CD4 | − | − | − | − | − |
| CD8 | − | − | − | + | + |
| NK1.1 | − | + | + | + | + |
| CD16 | − | + | + | + | − |
| LFA-1 | + | + | + | + | + |
| CD2 | + | − | − | − | − |
| IL-2Rα | + | + | + | + | + |
| Ly49a | + | − | − | − | − |
| 5E6 (Ly49c) | − | − | − | − | − |
| 2B4 | − | − | + | − | + |
| TAg | − | + | + | + | + |
Flow cytometric analysis of multiple antigens using representative cell lines from each of the groups. YAC-1 is a CD−3+ control T-cell line. Group A lines included: 37.4, 37.12, 37.20, 37.31, and 37.41. Group B lines included: 36.2, 36.8, 36.9, 37.13, 37.16, and 37.22. Group C lines included: 36.4, 36.11, and 37.14. Group D lines included: 36.3, 36.5, 37.19, and 37.25.
TCR rearrangements in the tumor cell lines. Southern blot analysis of tumor cell lines from groups A, B, C, and D was performed. Genomic DNA from each of the cell lines was cut to completion withHindIII, and analyzed by Southern blotting using a probe specific for TCR Cβ1 and Cβ2. Note that the cell lines in group A have a germline configuration of Cβ2, while those in groups B, C, and D have an altered or absent Cβ2 band, indicating that clonal rearrangement of the TCR has occurred. RW-4 (lane 7) represents DNA from an embryonic stem cell line with germline configurations of Cβ1 and Cβ2.
TCR rearrangements in the tumor cell lines. Southern blot analysis of tumor cell lines from groups A, B, C, and D was performed. Genomic DNA from each of the cell lines was cut to completion withHindIII, and analyzed by Southern blotting using a probe specific for TCR Cβ1 and Cβ2. Note that the cell lines in group A have a germline configuration of Cβ2, while those in groups B, C, and D have an altered or absent Cβ2 band, indicating that clonal rearrangement of the TCR has occurred. RW-4 (lane 7) represents DNA from an embryonic stem cell line with germline configurations of Cβ1 and Cβ2.
The tumor phenotype could be transferred to secondary SCID recipients with primary splenic tumors, or with the tumor cell lines. When 1 × 10⁸ splenic tumor cells from founder lines 33, 36, or 37 were injected into C3H SCID recipients (n = 6), all of the recipients developed large cell lymphomas in 8 to 10 weeks, and died of these tumors. The spleens from SCID mice procured with these tumors were all TAg+ (see Fig 6B, lanes 4, 6, and 7). In addition, 1 × 10⁷ cells from each of six tumor cell lines were injected into secondary SCID recipients; all of the recipients developed fatal TAg+ lymphomas within 6 to 8 weeks.
Granzyme H-TAg tumor cell lines contain cytotoxic granules, but do not exhibit direct cytotoxicity.
The morphology of all of the cultured tumor cell lines was virtually identical. All of the cell lines consisted of large granular lymphocytes with prominent azurophil granules, abundant vacuolated cytoplasm, and large irregular nuclei (Fig 4H). RNA made from all 18 cell lines showed abundant expression of perforin and of granzymes A, B, C, D, and F, as previously described (see Pham et al,11Fig 2; cell line 3-1 is line 37.31); the pattern of granzyme gene expression was identical to that for mouse LAK cells. Western blots of protein extracts made from these cell lines also showed abundant perforin (that was capable of lysing sheep red blood cells [RBCs]; S. Shresta and T. Ley, unpublished) and granzyme B; granzyme B was localized immunohistochemically to the granules of the cells (D. Thomas and T. Ley, unpublished). Despite the fact that these cell lines displayed cell surface integrins (Table 1) and contained all of the same granular components as LAK cells, they were unable to kill in direct cytotoxicity assays using susceptible YAC-1 targets (data not shown). None of the cell lines tested showed antibody-directed cellular cytotoxicity against a variety of target cell lines, nor did they secrete detectable IL-2 or γ-interferon (IFN) (data not shown).
DISCUSSION
In this report, we have shown that the 5′ flanking region of human granzyme H contains cis-acting DNA sequences that allow it to specifically target expression of the SV40 TAg to the LAK cell compartment of transgenic mice. Young mice bearing this transgene were normal, but these mice developed a fatal lymphoma-like illness after 6 to 18 months of life. The tumors were apparently polyclonal, suggesting that multiple tumors may arise nearly simultaneously within individual spleens. The tumors were very aggressive and had morphologic features and cell surface markers that suggested that they were comprised of T and/or NK cells. Two IL-2–dependent cell lines derived from the tumor spleens of these animals were shown to be NK1.1+and variably expressed CD3, CD8, and CD16. Despite the fact that these cell lines contain cytotoxic granule proteins, they were unable to kill susceptible target cells.
Expression of human granzyme H is primarily restricted to LAK cells in humans, and this gene is located between granzyme B and cathepsin G on chromosome 14.3 Similarly, murine granzymes C, D, and F have an expression pattern that is restricted to the LAK cell compartment of mice, and these genes are also located between granzyme B and cathepsin G in a gene cluster that includes many more genes than its human counterpart.11 The 5′ flanking region from human granzyme H contain regions of homology with the 5′ flanking regions of murine granzymes C, D, F (and other NK-specific genes21), and this region contains cis-acting sequences that allow a reporter gene to be targeted specifically to the LAK compartment of transgenic animals. In sum, these data strongly suggest that granzyme H and murine granzymes C, D, and F are regulatory homologues of one another; however, these genes cannot be said to be truly orthologous because the functions of these LAK/NK restricted granzymes is not yet known.
Three independent founder lines bearing the granzyme H-TAg transgene showed similar patterns of transgene expression, and developed similar kinds of tumors. The tumors developed only after a long latency, suggesting that secondary genetic events contribute to tumorigenesis. The tumors were aggressive, large cell lymphomas, and tended to be extensively disseminated in the mice at the time of clinical illness. The percentage of TAg+ cells in the spleens of these animals was highly variable, as was the morphologic tumor burden. However, the morphology of the tumor cells in the spleens of these animals was similar from tumor to tumor. The tumor phenotypes could be transferred to SCID mouse recipients using primary tumors or the cloned cell lines; the resulting tumors in the SCID mice were TAg+and had the same morphology as the primary tumors.
Cell lines derived from two tumors contained several independent transformed clones, suggesting that multiple independent transformation events occurred within individual spleens. The cell lines derived from the tumors were IL-2–dependent, and all exhibited expression of TAg, NK1.1, and LFA-1. Expression of CD3, CD8, and CD16 was variable, so that four different types of NK1.1+ cells were identified; at least three of these types of cells existed within each of the tumors from which the cell lines were cloned. Analysis of TCR rearrangements from these cell lines showed that the CD3-cell lines had germline TCR configurations, while CD3+ cell lines uniformly had TCR rearrangements, again suggesting that multiple independent transformed clones existed within individual spleens. These data are similar to that reported by Hanahan et al,22-24 who have shown that TAg expressed under the control of the rat insulin promoter is capable of yielding multiple independent transformed islet cell tumors within a single pancreas. The ability of SV40 TAg to interfere with the functions of Rb and p5325-27 may allow multiple independent progenitor cells within a spleen to acquire second genetic hits that permit tumor progression within a relatively narrow time frame. The cells that are tumorigenic retain expression of TAg and express the cell surface NK1.1 marker after they are cloned in the presence of high-dose IL-2. In the two primary tumors that we could characterize by two-color flow, the TAg+ cells were NK1.1+/CD16+ in one case, and predominantly CD4+ in the other. Collectively, the results suggest that the granzyme H-TAg transgene must be expressed during an early phase of normal NK/T cell development, and then again in activated (but not resting) NK cells. The variable presence of CD3, CD4, and CD8 on the transformed cells or cell lines strongly suggest that the cell at risk for transformation is capable of T-cell development, a situation that has previously been observed in many human tumors bearing NK markers.28 29
The tumors that develop in granzyme H-TAg mice are similar to those that develop in human patients with NK-large granular lymphocyte (LGL) leukemia/lymphoma. These patients usually have systemic symptoms and frequently develop massive hepatosplenomegaly with dissemination of the lymphoma to multiple solid organs; frequently, these organs display angiocentric and/or angiodestructive infiltrates. Patients with NK leukemia/lymphoma usually display an aggressive clinical course, and most patients die of disseminated disease within a few months of presentation, despite therapy.28,30,31 NK-LGL leukemia/lymphoma cells are usually CD3−CD56+ and usually contain numerous azurophilic granules. Although normal human NK cells and many NK leukemia/lymphoma tumors are CD3−/CD56+/CD16+, some individual patients with NK leukemia/lymphoma have CD3+/CD56+ or CD3+/CD8+/CD56+ tumor cells,28-30 32-36 similar to that found in our cell lines from groups B, C, and D. Because patients with NK leukemia/lymphoma presumably have tumors that are derived from a single clone, usually only a single NK phenotype is present (although variability in CD16 expression can be observed). However, the cell surface phenotypes of NK cells in patients and in our mice are similar, suggesting that similar patterns of transformation during NK/T-cell development may occur in both species.
All of the cell lines derived from granzyme H-TAg tumors have a similar large granular lymphocyte morphology, with extensive vacuolization and numerous azurophil granules in the cytoplasm. These cells have abundant amounts of perforin and express very high levels of granzymes A, B, C, D, and F, like that of LAK cells derived from normal animals. All of the cell lines (regardless of the cell surface profile) display virtually identical patterns of perforin and granzyme gene expression. Despite the fact that these cells seem to be armed with cytotoxic granules, they display no direct cytotoxicity against the susceptible YAC-1 cell line. Similarly, they had no detectable antibody-directed cellular cytotoxicity (data not shown). All of the cell lines expressed LFA-1 (Table 1) so binding of these cell lines to susceptible target cells should be possible. While none of the cell lines expressed 5e6 (LY-49C), a molecule that is proposed to interact with a self-major histocompatability complex (MHC) class I receptor to initiate the inhibitory signal,37,38 all of the lines expressed NK1.1, which (in humans) is required for activation of the NK cytolytic pathway.32 Further experiments will be required to precisely define the nature of the cytotoxic defect in these cells.
In conclusion, the human granzyme H gene appears to have many features that are similar to that of murine granzymes C, D, and F; these genes, located between granzymes B and cathepsin G within their respective gene clusters, are preferentially expressed in the LAK/NK compartment. Although these genes are regulatory homologues, their roles in the normal function of NK/LAK cells has not yet been defined; selective loss-of-function mutations of these murine granzymes should further define their normal roles. In addition, regulatory sequences near these genes may be very useful for targeting novel genes of interest to the NK/LAK compartment to create more precise mouse models of NK-LGL leukemia/lymphoma.
ACKNOWLEDGMENT
The authors thank Drs John Russell, Wayne Yokoyama, and Bill Grossman for helpful suggestions and advice during the course of this project, and Dan Link for critically reading the manuscript. We thank Brian Rush and Koho Iizuka for measuring IL-2 and γ-IFN levels in the NK cell lines. Dr David Skalnik kindly provided the TAg fragment and 410b cell line. The authors thank Dr M.D. Kraus for expert assistance with interpretation of histopathology. We thank Robin Wesselschmidt and Pam Goda for the production and care of these animals, respectively. Nancy Reidelberger expertly prepared the manuscript.
Supported by Grants No. DK49786 and CA49712 from the National Institutes of Health and the Washington University/Monsanto Agreement.
The publication costs of this article were defrayed in part by page charge payment. This article must therefore be hereby marked “advertisement” in accordance with 18 U.S.C. section 1734 solely to indicate this fact.
REFERENCES
Author notes
Address reprint requests to Timothy J. Ley, MD, Washington University Medical School, 660 S Euclid, Box 8007, St Louis, MO 63110-1093.

This feature is available to Subscribers Only
Sign In or Create an Account Close Modal