Abstract
The zinc finger transcription factor GATA-2 is highly expressed in immature hematopoietic cells and declines with blood cell maturation. To investigate its role in normal adult hematopoiesis, a bicistronic retroviral vector encoding GATA-2 and the green fluorescent protein (GFP) was used to maintain the high levels of GATA-2 that are normally present in primitive hematopoietic cells. Coexpression of the GFP marker facilitated identification and quantitation of vector-expressing cells. Bone marrow cells transduced with the GATA-2 vector expressed GFP as judged by flow cytometry and GATA-2 as assessed by immunoblot analysis. A 50% to 80% reduction in hematopoietic progenitor-derived colony formation was observed with GATA-2/GFP-transduced marrow, compared with marrow transduced with a GFP-containing vector lacking the GATA-2 cDNA. Culture of purified populations of GATA-2/GFP-expressing and nonexpressing cells confirmed a specific ablation of the colony-forming ability of GATA-2/GFP-expressing progenitor cells. Similarly, loss of spleen colony-forming ability was observed for GATA-2/GFP-expressing bone marrow cells. Despite enforced GATA-2 expression, marrow cells remained viable and were negative in assays to evaluate apoptosis. Although efficient transduction of primitive Sca-1+Lin- cells was observed with the GATA-2/GFP vector, GATA-2/GFP-expressing stem cells failed to substantially contribute to the multilineage hematopoietic reconstitution of transplanted mice. Additionally, mice transplanted with purified, GATA-2/GFP-expressing cells showed post-transplant cytopenias and decreased numbers of total and gene-modified bone marrow Sca-1+ Lin−cells. Although Sca-1+ Lin− bone marrow cells expressing the GATA-2/GFP vector were detected after transplantation, no appreciable expansion in their numbers occurred. In contrast, control GFP-expressing Sca-1+Lin− cells expanded at least 40-fold after transplantation. Thus, enforced expression of GATA-2 in pluripotent hematopoietic cells blocked both their amplification and differentiation. There appears to be a critical dose-dependent effect of GATA-2 on blood cell differentiation in that downregulation of GATA-2 expression is necessary for stem cells to contribute to hematopoiesis in vivo.
THE MEMBERS OF THE GATA family of DNA-binding transcriptional regulatory proteins have distinct tissue distributions and developmentally regulated expression patterns.1,2 These factors bind to a DNA consensus sequence (T/A)GATA(A/G) using a highly conserved DNA binding domain composed of amino- and carboxy-terminal zinc fingers.3,4Three GATA family members have been identified as important regulators of gene expression in hematopoietic cells. GATA-1, the first member of the family to be isolated, is highly expressed in developing erythroid cells, mast cells, and megakaryocytes5,6 and its expression is required for primitive and definitive erythropoiesis.7,8Loss of GATA-1 causes fatal embryonic anemia in mice due to a block in erythroid maturation.9 GATA-2 is also expressed in early erythroid cells, mast cells, and megakaryocytes,10-13 but particularly high levels of expression have been observed in enriched populations of pluripotent hematopoietic stem cells.14Targeted disruption of the GATA-2 gene in mice causes lethality in utero due to anemia resulting from an early hematopoietic defect, implicating GATA-2 as being a key factor in the maintenance of stem cell function.15 Similarly, in vitro analysis of GATA-2–deficient embryonic stem cells suggests the necessity of GATA-2 for survival of early hematopoietic cells.16 GATA-3 expression is important during the onset of fetal liver hematopoiesis and is required for the development of T lymphocytes.17 18
In primary liquid cultures enriched for erythroid precursor cells as well as in developing human erythroid progenitors grown in growth factor-supplemented methylcellulose, the quantitative GATA-1/GATA-2 balance appears important in erythroid differentiation.10,19 In both systems, human erythroid progenitors are characterized by high levels of both GATA-1 and GATA-2, but on terminal differentiation GATA-2 levels are markedly lower although further increases in GATA-1 gene expression are observed. In other studies, ectopic expression of a conditionally active GATA-2 protein in transformed chicken erythroblasts and in primary erythroblast clones blocked erythroid differentiation in vitro.20 Consistent with these data, Orlic et al14 observed extremely high levels of GATA-2 expression in murine bone marrow cell fractions highly enriched for pluripotent hematopoietic stem cells. Lower levels of GATA-2 expression were present in the more mature cell subsets. Together, these data suggest that GATA-2 acts preferentially on more primitive hematopoietic cells and that downregulation of its expression may be necessary for differentiation to occur in vivo.
Based on these studies, we constitutively expressed GATA-2 in human CD34+ cell-derived erythroid bursts (BFU-E) in an attempt to influence erythroid differentiation and globin gene switching. Although no effect was noted on globin gene expression, erythroid colonies expressing a retrovirally-transferred human GATA-2 cDNA were consistently smaller in size than control colonies, without a noticeable effect on maturation (D. Persons and A. Nienhuis, unpublished observations). To further investigate these findings and to study the role of GATA-2 in primitive hematopoietic cells in an adult mouse model of normal hematopoiesis, a bicistronic retroviral vector was used to obtain enforced expression of GATA-2 in murine bone marrow cells. In this vector, the GATA-2 cDNA was transcriptionally linked by a viral internal ribosome entry site (ir) to the green fluorescent protein (GFP) gene. This configuration allows coordinate expression of the GATA-2 and GFP proteins, the latter of which facilitates the facile identification and precise quantitation of genetically modified cells cultured in vitro and blood cells of all hematopoietic lineages in vivo.21 Our experiments show that maintenance of the normally high levels of GATA-2 expression present in hematopoietic progenitors and stem cells blocks both their differentiation and amplification, suggesting that regulation of GATA-2 expression is a critical event in normal hematopoiesis.
MATERIALS AND METHODS
Cell lines and vector construction.
The ecotropic packaging cell line GP + E8622 was used for the generation of helper-free recombinant retroviruses. GP + E86, 293T23, and NIH 3T3 cells were maintained in Dulbecco’s modified Eagle’s medium (DMEM) supplemented with 10% heat-inactivated fetal calf serum (FCS), 2 mmol/L glutamine, 100 U/mL penicillin, and 100 μg/mL streptomycin at 37°C in a 5% CO2, humidified atmosphere.
The neomycin coding cassette in MSCVNEO2.124 was initially replaced with a DNA fragment containing an internal ribosome entry site (ir) from the encephalomyocarditis virus25 linked to a cDNA encoding a human dihydrofolate reductase (DHFR) variant containing a leucine to tyrosine substitution in codon 22 (termed L22Y).21 After removal of the L22Y coding sequences, the GFP cDNA from the EGFP-1 plasmid (Clontech Laboratories, Palo Alto, CA) was placed 3′ of the ir element. The human GATA-2 cDNA12 (kindly provided by Stuart Orkin, Howard Hughes Medical Institute, Harvard University, Boston, MA) was cloned into the translational position 5′ of the ir element to generate the plasmid GATA-2irGFP. To obtain a retroviral construct containing the GATA-2 and GFP cDNAs with the translational positions reversed, the L22Y coding sequences were removed from the plasmid MGirL22Y (which contains the MSCV LTR driving a GFPirL22YDHFR cassette)21and replaced with the GATA-2 cDNA coding sequence.
Generation of high titer, ecotropic virus producer cells.
Conditioned media containing high titer, amphotropic irGFP, GATA-2irGFP, and GFPirGATA-2 vector particles were derived by cotransfection of 293T cells with the respective retroviral vector plasmids and a helper plasmid containing the required gag, pol, and env retroviral genes driven by a Moloney leukemia virus LTR.26This media was used to transduce GP + E86 viral packaging cells and viral producer cells for each vector were derived as previously described.21 The viral titer of conditioned media from each of these producer populations was ∼106 particles/mL as assessed by transfer of the GFP marker to NIH 3T3 cells. These virus-producing cells were shown to be free of replication competent retrovirus by a previously described marker rescue assay.21
Retroviral transduction of bone marrow cells.
Retroviral transduction of murine bone marrow cells was performed as previously described.21 Briefly, bone marrow was harvested from 8- to 12-week-old female C57/Bl6 2 days after treatment with 150 mg/kg 5-fluoruracil (5-FU; Pharmacia, Kalimazoo, MI). Marrow cells were stimulated for 48 hours with 20 ng/mL mouse IL-3, 50 ng/mL human IL-6, and 50 ng/mL mouse stem cell factor (all obtained from R & D Systems, Minneapolis, MN) in DMEM supplemented with 15% heat-inactivated FCS (Hyclone, Logan, UT). Bone marrow cells were subsequently cocultured with irradiated (1200 cGy) viral producer cells using the above culture media supplemented with 6 μg/mL polybrene. Forty-eight hours later, nonadherent bone marrow cells were gently rinsed off the viral producer cell monolayers, pelleted, and resuspended in fresh culture medium with the above cytokines. Cells were cultured for an additional 24 to 48 hours before analysis for expression of GFP as described below, plated into methylcellulose media, or used immediately for transplantation.
Immunoblot analysis.
Cells were lysed by boiling in Laemmli buffer and proteins electrophoretically separated on 10% denaturing polyacrylamide gels. Separated proteins were transferred to nitrocellulose membranes that were probed using a mouse monoclonal antibody (MoAb), which we have found detects human GATA-2 well but mouse GATA-2 poorly (sc-267; Santa Cruz Biotechnology, Inc, Santa Cruz, CA). An ECL western blotting analysis system (Amersham Life Science, Amersham, UK) was used to develop immunoreactive signals.
Flow cytometric purification of GFP-expressing bone marrow cells.
Twenty-four hours after the completion of the viral transduction procedure, bone marrow cells were depleted of red blood cells and resuspended in phosphate-buffered saline (PBS) supplemented with 5% FCS. GFP+ and GFP− viable cells were sorted on a Turbo sort-equipped FACStar Plus cell sorter (Becton Dickinson, San Jose, CA). Alternatively, cells were stained for the Sca-1 and lineage-specific markers, as described below, and Sca-1+ lineage-marker negative (Lin−) cells that expressed the indicated GFP-containing retroviral vector were obtained. Sorted populations were reanalyzed for GFP expression and routinely showed purities ranging from 92% to 99%.
Reverse transcriptase-polymerase chain reaction (RT-PCR) assay.
Cellular RNA extraction, preparation of complementary DNA (cDNA), and PCR amplification of cDNA was performed using mouse GATA-2 and beta-2 microglobulin (β-2m) primer pairs as previously described.14 The mouse GATA-2 primer pair used detected both the endogenous mouse GATA-2 transcript and the retroviral GATA-2 transcript. In contrast, a retroviral-specific GATA-2 PCR primer pair (5′: CTCTAGGCGCCGGAATTCGT; 3′: CCTGCGAGTC GAGGTGATTG) was designed that used a 5′ primer located in the retroviral backbone, just upstream of the GATA-2 cDNA sequence. To determine the amount of input RNA for each sample that would result in a readout within the linear response range of the assay, limiting dilution aliquots of each RNA sample were assayed by RT-PCR for β-2m levels. Equivalent amounts of RNA, as assessed by the β-2m signals of the various samples, were then used in each subsequent RT-PCR assay.
In vitro clonogenic progenitor assays.
Unsorted and sorted bone marrow cell populations, in a volume not exceeding 150 μL, were suspended in 3 mL methylcellulose culture media (M3434; Stem Cell Technologies, Vancouver, British Columbia, Canada). After thorough mixing, cells were plated into 35 mm dishes. Cultures were incubated at 37°C in a 5% CO2, humidified atmosphere and colonies enumerated after 7 to 10 days.
Cell-cycle phase distribution analysis and evaluation of apoptosis in bone marrow cells.
Purified populations of bone marrow cells, as indicated, were analyzed for cell-cycle phase distribution according to standard methods.27 The same cell populations were evaluated for the presence of apoptotic cells, as previously described.28 29Specifically, flow cytometric analysis was used to detect fragmented DNA ends labeled by transfer of digoxygenin-conjugated dUTP in a terminal-transferase catalyzed reaction (TUNEL) as a function of the cellular DNA content of propidium iodide-stained nuclei.
Transplantation of retroviral vector-transduced bone marrow cells.
Transduced bone marrow cells were washed and resuspended in PBS containing 2% FCS. Two to 5 × 10⁶ cells were transplanted by tail vein injection into lethally irradiated, congenic HW80 recipient mice that differed in hemoglobin phenotype from the donor mice. Beginning 4 weeks post-transplantation, peripheral blood obtained by retroorbital sinus puncture was analyzed for expression of GFP. In addition, complete hematology parameters including hematocrit, platelet count, and total leukocyte counts were obtained by standard methods. Leukocyte differentials were obtained by scoring Wright-Giemsa stained blood films. Hemoglobin electrophoresis, to assess hematopoietic reconstitution by donor marrow, was performed by standard methods.30
Evaluation of GFP expression in bone marrow and peripheral blood cells.
In vitro cultured bone marrow cells and bone marrow cells freshly harvested from the hind limbs of animals were resuspended as single cells, after red blood cell depletion, for analysis by flow cytometry with a FACS Calibur (Becton Dickinson) using excitation at 488 nm and fluorescence detection at 530 ± 15 nm (for GFP), or 585 ± 21 nm (for phycoerythrin), or 670 nm or greater (for Red670). PI was added to samples in some instances to allow identification and elimination of dead cells from the analysis. Where indicated, bone marrow cells were stained with a phycoerythrin-conjugated MoAb against the Sca-1 antigen (PharMingen; San Diego, CA), in conjunction with staining using a biotinylated antibody cocktail directed to a panel of blood lineage markers (CD5, CD45R, CD11b, Gr-1, and TER119; Stem Cell Technologies, Inc) followed by incubation with a streptavidin-linked Red670 secondary reagent (Life Technologies, Gaithersburg, MD). The primitive fraction of hematopoietic cells staining positive for the Sca-1 antigen and negative for lineage markers (termed Sca-1+Lin-)31 was delineated by electronic gating, which was then used to determine the percentage of GFP+cells in this subpopulation. Less than 1% of cells fell within this gate when samples were stained with isotype-matched control antibodies. Peripheral blood cells were analyzed for GFP expression as previously described.21 Hematopoietic colonies were directly evaluated for GFP expression by visualization using a standard fluorescence microscope.
Statistics.
The Student’s paired t-test was used to determine statistically significant differences where indicated.
RESULTS
Bicistronic retroviral vectors express both GATA-2 and GFP in retroviral producer cells and transduced murine bone marrow.
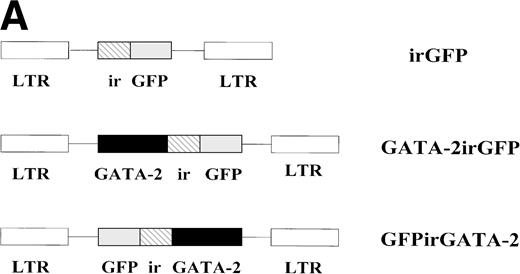
The murine stem cell virus (MSCV)-based retroviral vectors GATA-2irGFP and GFPirGATA-2 contain the GATA-2 and GFP cDNAs (in either the first or second translational position) linked by the encephalomyocarditis virus internal ribosome entry site (ir) (Fig 1A). GP + E86 retroviral producer cells were generated, as described in Materials and Methods, for each vector and a control vector, irGFP (Fig 1A), which lacked a coding sequence in the first translational position. All three producer cell populations efficiently expressed GFP as assessed by fluorescence-activated cell sorting (FACS) analysis and direct fluorescence microscopy (data not shown). The viral titers of conditioned media from the three producer cell populations were estimated to be approximately 106 infectious units/mL, based on transfer of the GFP marker to NIH 3T3 cells. Southern blot analysis of DNA from all three producer cell populations and from NIH 3T3 target cells transduced with each of the vectors confirmed the presence and transmission of an intact, unrearranged proviral genomic band of the correct molecular size (data not shown).
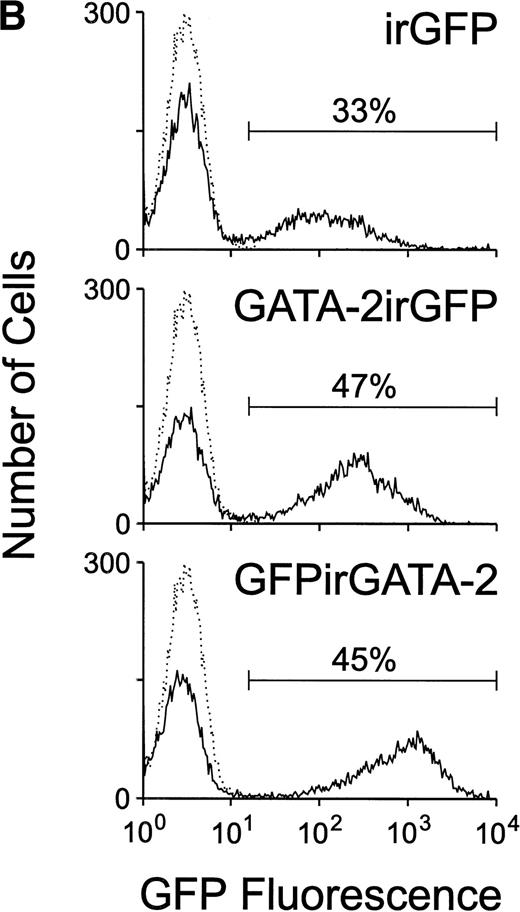
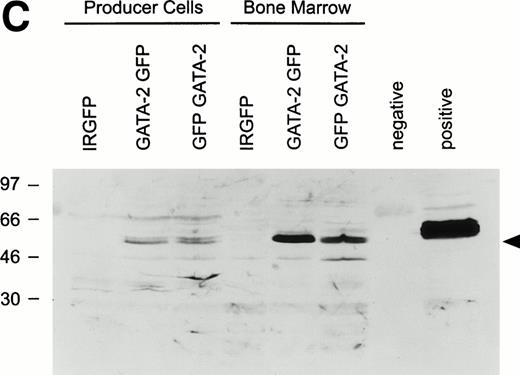
(A) Schematic of the MSCV-based irGFP, GATA-2irGFP, and GFPirGATA-2 retroviral vectors. All contain the internal ribosome entry site (ir) from the encephalomyocarditis virus that allows cap-independent translation of the coding sequence 3′ of the ir element. (B) Flow cytometric analysis of GFP expression in bone marrow cells 24 hours after transduction with the irGFP, GATA-2irGFP, and GFPirGATA-2 retroviral vectors. The solid line in each panel indicates the fluorescence profile of cells transduced with the indicated vector. The broken line in each panel represents the fluorescence profile of nontransduced bone marrow cells. In each case, the percentage of cells expressing GFP is indicated. (C) Immunoblot analysis for GATA-2 expression in retroviral producer and transduced bone marrow cells. Protein lysates of 2 × 10⁶ viral producer cells for each vector or 1 × 10⁶ bone marrow cells transduced with the indicated vectors were electrophoretically separated, blotted, and probed with an anti–GATA-2 MoAb. The positive control lane represents protein extracted from COS-7 cells transiently transfected with a GATA-2 expression plasmid, whereas the lane marked negative contained no protein.
(A) Schematic of the MSCV-based irGFP, GATA-2irGFP, and GFPirGATA-2 retroviral vectors. All contain the internal ribosome entry site (ir) from the encephalomyocarditis virus that allows cap-independent translation of the coding sequence 3′ of the ir element. (B) Flow cytometric analysis of GFP expression in bone marrow cells 24 hours after transduction with the irGFP, GATA-2irGFP, and GFPirGATA-2 retroviral vectors. The solid line in each panel indicates the fluorescence profile of cells transduced with the indicated vector. The broken line in each panel represents the fluorescence profile of nontransduced bone marrow cells. In each case, the percentage of cells expressing GFP is indicated. (C) Immunoblot analysis for GATA-2 expression in retroviral producer and transduced bone marrow cells. Protein lysates of 2 × 10⁶ viral producer cells for each vector or 1 × 10⁶ bone marrow cells transduced with the indicated vectors were electrophoretically separated, blotted, and probed with an anti–GATA-2 MoAb. The positive control lane represents protein extracted from COS-7 cells transiently transfected with a GATA-2 expression plasmid, whereas the lane marked negative contained no protein.
As shown in Fig 1B, approximately 33% to 50% of the marrow cells were positive for GFP expression after cocultivation with the respective viral producer cells, with the GFPirGATA-2 vector showing slightly higher GFP expression than the GATA-2irGFP and control irGFP vectors. These results were reproducible over many experiments, with similar transduction efficiencies observed. To assess expression of the GATA-2 protein, whole cell lysates from the control and GATA-2 viral producer cells, as well as from lysates of bone marrow cells transduced with each of the vectors, were examined for the presence of GATA-2 by immunoblot analysis. Low, but readily detectable levels of an immunoreactive band of the correct molecular size (∼55 kD) were present in the two GATA-2 retroviral producers, whereas much higher levels on a per cell basis were observed in transduced bone marrow cells (Fig 1C). The latter result is consistent with the previously noted high level of expression directed by the MSCV LTR in hematopoietic cells.32 Because the GATA-2irGFP vector gave somewhat higher expression of GATA-2 than the GFPirGATA-2 vector, this vector was used in subsequent experiments.
Bone marrow cells expressing the GATA-2irGFP vector showed no evidence of toxicity, compared with cells expressing the control vector, either during the 72-hour in vitro transduction culture period or at the time of FACS analysis when cells were counterstained with propidium iodide to identify dead cells. In three independent experiments, the percentage of viable bone marrow cells present 24-hours after completion of the transduction protocol with the GATA-2irGFP vector ranged from 45% to 67%, which was not different from that observed with the control GFP vector (range, 51% to 67%). In addition, GATA-2irGFP–expressing viable cells outnumbered nonviable expressing cells on average by a factor of seven to one (data from two experiments).
Enforced GATA-2 expression blocks hematopoietic progenitor-derived colony formation.
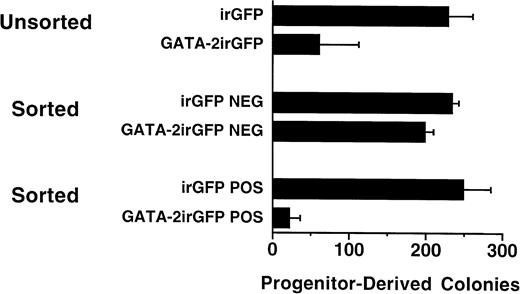
To evaluate the effect of enforced GATA-2 expression in primary clonogenic hematopoietic progenitor cells, murine bone marrow cells were transduced with either the GATA-2irGFP vector or the control irGFP vector and cultured in methylcellulose media supplemented with recombinant hematopoietic growth factors. The number of colonies was markedly diminished (27% of control) in cultures of cells transduced with the GATA-2irGFP vector in comparison to cultures of cells transduced with the control irGFP vector (Fig 2; Unsorted). In three separate experiments, few (range, 3% to 13%) of the colonies that grew from marrow transduced with the GATA-2irGFP vector expressed the GFP marker. In contrast, a substantial proportion (range, 50% to 70%) of the colonies derived from marrow transduced in parallel with the control irGFP vector expressed GFP.
Hematopoietic progenitor-derived colony formation of GATA-2irGFP- and control irGFP-expressing bone marrow cells. Unsorted irGFP- and GATA-2irGFP–transduced cells (n = 3) and flow cytometric sorted, GFP+ (POS) (n = 3) and GFP− (NEG) (n = 2) cells for each vector, as indicated, were cultured in duplicate in semisolid media and colonies enumerated as described in Materials and Methods. Data are expressed as the mean number (± standard error) of hematopoietic colonies per 104 cells. The values within both the unsorted and sorted positive groups were statistically significantly different (P < .03 and P< .02, respectively) from each other.
Hematopoietic progenitor-derived colony formation of GATA-2irGFP- and control irGFP-expressing bone marrow cells. Unsorted irGFP- and GATA-2irGFP–transduced cells (n = 3) and flow cytometric sorted, GFP+ (POS) (n = 3) and GFP− (NEG) (n = 2) cells for each vector, as indicated, were cultured in duplicate in semisolid media and colonies enumerated as described in Materials and Methods. Data are expressed as the mean number (± standard error) of hematopoietic colonies per 104 cells. The values within both the unsorted and sorted positive groups were statistically significantly different (P < .03 and P< .02, respectively) from each other.
After transduction, GATA-2irGFP–expressing (Fig 2; Sorted Pos) and nonexpressing (Fig 2; Sorted Neg) cell populations were isolated from the same culture by flow cytometric cell sorting according to GFP positivity. Purified cells expressing the GATA-2irGFP vector showed near complete loss of progenitor-derived colony-forming ability compared with purified cells expressing the control irGFP vector. In contrast, purified GATA-2irGFP nonexpressing cells formed colonies in numbers similar to both purified irGFP-expressing and nonexpressing control cells. These data suggested that enforced GATA-2 expression specifically blocked progenitor-derived colony formation.
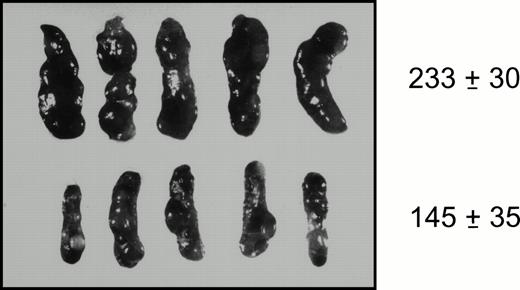
To investigate the effects of enforced GATA-2 expression in the spleen colony-forming cell (CFU-S), limiting numbers of purified bone marrow cells expressing the GATA-2irGFP and control irGFP vectors were transplanted into irradiated mice. Fourteen days later, animals were killed and spleens examined for growth of clonogenic CFU-S. The spleens from animals transplanted with bone marrow cells expressing the control irGFP vector contained multiple, large macroscopic colonies typical of CFU-S (Fig 3; top row). In contrast, the spleen colonies from animals transplanted with cells expressing the GATA-2irGFP vector were few in number; most were small and similar in size to the endogenously-derived colonies present in irradiated mice that received no transplanted cells (Fig 3; bottom row; data not shown). Correspondingly, the mean weight of spleens from animals that received cells expressing the control irGFP vector was significantly greater than that of the spleens from animals transplanted with GATA-2irGFP–expressing cells (Fig 3). Of the six larger macroscopic colonies typical for CFU-S that were obtained from GATA-2irGFP spleens and evaluated for vector expression, none were GFP+ as determined by FACS. In contrast, the majority of CFU-S (15 of 20) obtained from the control vector spleens were positive for GFP expression.
Gross appearance of spleens obtained from mice 14 days after transplantation with 3 × 10⁴ purified bone marrow cells expressing the GATA-2irGFP (bottom row) or control irGFP vectors (top row). The mean splenic weight (mg) ± standard error for each group is indicated at right and were statistically significantly different (P < .04). The weight of the spleens from animals transplanted with GATA-2irGFP–expressing cells did not differ from the weight of spleens from animals that did not receive cells (148 ± 2; n = 2).
Gross appearance of spleens obtained from mice 14 days after transplantation with 3 × 10⁴ purified bone marrow cells expressing the GATA-2irGFP (bottom row) or control irGFP vectors (top row). The mean splenic weight (mg) ± standard error for each group is indicated at right and were statistically significantly different (P < .04). The weight of the spleens from animals transplanted with GATA-2irGFP–expressing cells did not differ from the weight of spleens from animals that did not receive cells (148 ± 2; n = 2).
Enforced expression of GATA-2 in bone marrow cells does not alter cell-cycle distribution or induce apoptosis.
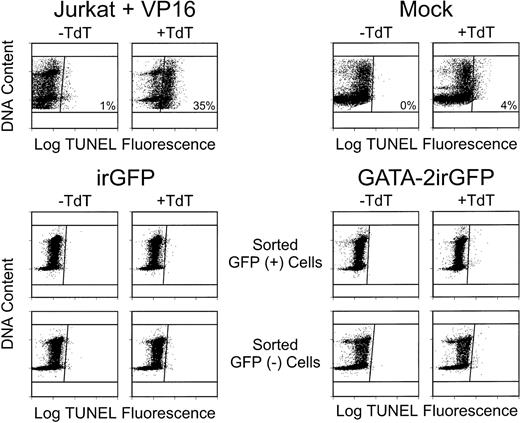
Possible explanations for the loss of the in vitro and spleen colony-forming activity of GATA-2–expressing progenitor cells could be the induction of altered cell-cycle progression or apoptosis in maturing hematopoietic cells. To investigate these possibilities, GATA-2irGFP- and control irGFP-expressing bone marrow cells were obtained by flow cytometry after gene transfer. No difference was observed in the cell-cycle phase distribution profile of bone marrow cells expressing the GATA-2irGFP vector compared with cells expressing the control irGFP vector or to nonexpressing cells derived from cultures with either vector (data not shown). These same cell populations, which are comprised of a spectrum of hematopoietic precursors and developing cells, were also evaluated for evidence of apoptosis by a flow cytometry-based assay that detects fragmented DNA ends (TUNEL). As shown in Fig 4, GATA-2–expressing cells showed extremely low levels of apoptosis (<1%), similar to levels observed in nonexpressing cells derived from the same transduction culture and both GFP-expressing and nonexpressing cells derived from the control irGFP vector transduction culture. Therefore, the loss of progenitor function associated with GATA-2 expression could not be attributed to a generalized effect on the cell-cycle machinery or apoptotic pathways in hematopoietic cells. Further evidence against these possibilities was the observation that purified GATA-2irGFP–expressing bone marrow cells proliferated in hematopoietic growth factor-supplemented liquid cultures while maintaining high viability. In two separate experiments, GATA-2irGFP–expressing cells from unfractionated bone marrow exhibited a 2.5-fold to 4-fold expansion over 3 to 4 days.
Flow cytometric analysis of fragmented DNA ends labeled with fluoresceinated digoxygenin-conjugated dUTP in a terminal transferase (TdT)-catalyzed reaction (TUNEL; abscissa) as a function of cellular DNA content (ordinate). One-half of each sample was labeled in the absence of TdT enzyme (−TdT) to determine the background level of FITC fluorescence; the remaining half of the sample was labeled in the presence of TdT (+TdT) to fluorescently tag fragmented DNA ends. Cells to the right of the vertical line in the (+TdT) plots have free DNA ends specifically labeled by TdT, indicating apoptotic cell death. In this analysis, Jurkat cells treated for 6 hours with the toxic chemotherapy drug VP-16 showed a substantial number of cells (35%) undergoing apoptosis. In contrast, bone marrow cells cultured on naive NIH 3T3 cells (Mock) had 4% apoptotic cells, whereas unsorted GATA-2irGFP–transduced cells had 3% apoptotic cells (data not shown). Both sorted GFP-expressing and nonexpressing cell populations for each vector, as indicated, contained less than 1% apoptotic cells. Similar results were obtained in another experiment.
Flow cytometric analysis of fragmented DNA ends labeled with fluoresceinated digoxygenin-conjugated dUTP in a terminal transferase (TdT)-catalyzed reaction (TUNEL; abscissa) as a function of cellular DNA content (ordinate). One-half of each sample was labeled in the absence of TdT enzyme (−TdT) to determine the background level of FITC fluorescence; the remaining half of the sample was labeled in the presence of TdT (+TdT) to fluorescently tag fragmented DNA ends. Cells to the right of the vertical line in the (+TdT) plots have free DNA ends specifically labeled by TdT, indicating apoptotic cell death. In this analysis, Jurkat cells treated for 6 hours with the toxic chemotherapy drug VP-16 showed a substantial number of cells (35%) undergoing apoptosis. In contrast, bone marrow cells cultured on naive NIH 3T3 cells (Mock) had 4% apoptotic cells, whereas unsorted GATA-2irGFP–transduced cells had 3% apoptotic cells (data not shown). Both sorted GFP-expressing and nonexpressing cell populations for each vector, as indicated, contained less than 1% apoptotic cells. Similar results were obtained in another experiment.
Enforced, physiologic levels of GATA-2 expression in primitive cells blocks their contribution to hematopoietic reconstitution in transplanted mice.
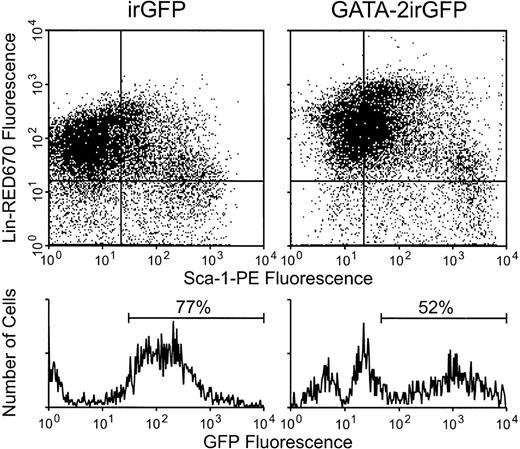
To show retroviral vector expression in primitive hematopoietic cells, GFP expression was evaluated in the Sca-1+, Lin− (CD5, CD45R, CD11b, Gr-1, and TER 119) primitive cell fraction of bone marrow after gene transfer with the GATA-2irGFP or control irGFP vector. Sca-1+ Lin−cells were efficiently transduced with, and expressed both vectors (Fig 5). In addition, there was no difference in the percentage of Sca-1+Lin− cells present in the two transduced cell populations despite vector expression for at least 24 hours (4.4% and 3.2% of gated viable cells were Sca-1+Lin− in the GATA-2irGFP and control irGFP-transduced populations, respectively).
Flow cytometric analysis for GATA-2irGFP or control irGFP vector expression in the Sca-1+ Lin−fraction of bone marrow cells. Twenty-four hours after completion of the transduction period with the indicated vectors, bone marrow cells were stained for expression of the Sca-1 and lineage-specific cell surface markers as described in Materials and Methods. The Sca-1+ Lin− cell subset (lower right quadrant of each dot plot) was gated on and GFP fluorescence in this cell subset is shown in the histogram below each dot plot. The percentages of GFP+ Sca-1+Lin− cells are indicated above each histogram. A separate experiment yielded similar results.
Flow cytometric analysis for GATA-2irGFP or control irGFP vector expression in the Sca-1+ Lin−fraction of bone marrow cells. Twenty-four hours after completion of the transduction period with the indicated vectors, bone marrow cells were stained for expression of the Sca-1 and lineage-specific cell surface markers as described in Materials and Methods. The Sca-1+ Lin− cell subset (lower right quadrant of each dot plot) was gated on and GFP fluorescence in this cell subset is shown in the histogram below each dot plot. The percentages of GFP+ Sca-1+Lin− cells are indicated above each histogram. A separate experiment yielded similar results.
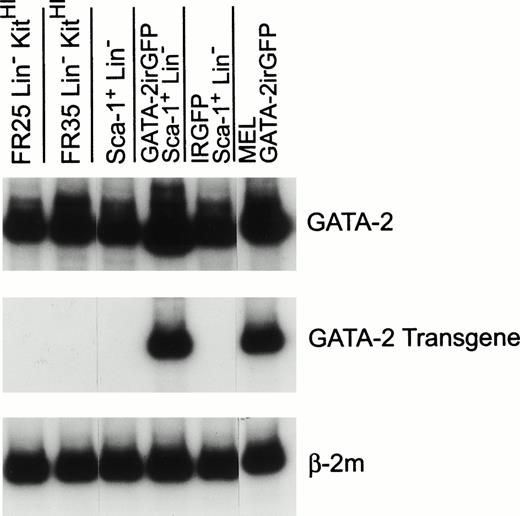
To obtain an estimate of the level of enforced GATA-2 expression in immature bone marrow cells, Sca-1+ Lin−cells expressing the GATA-2irGFP vector and the control irGFP vector were purified by flow cytometry after retroviral transduction and RNA was obtained for analysis using a previously described semiquantitative RT-PCR assay.14 Levels of total GATA-2 RNA (Fig 6, top panel; endogenous plus retroviral GATA-2) and retroviral transgene GATA-2 RNA (Fig 6, middle panel), relative to the level of the constitutively expressed β-2 microglobulin RNA (Fig 6, bottom panel), were then determined using equivalent amounts of input RNA predetermined to be in the linear range of the assay. In agreement with previous data,14 Fig 6 shows an abundant level of endogenous GATA-2 expression in several naive populations of hematopoietic cells enriched for immature cells (FR25 Lin− KitHI, FR35 Lin− KitHI, and Sca-1+Lin−). A similarly high level of endogenous GATA-2 RNA was observed in Sca-1+ Lin− cells expressing the control irGFP vector. The level of retroviral GATA-2 RNA present in purified Sca-1+ Lin−GATA-2irGFP–expressing cells was comparable to the level of endogenous GATA-2 RNA observed in the other cell populations (Fig 6, middle and top panels). Consistent with this, densitometric analysis showed that the total level of GATA-2 RNA (Fig 6, top panel) present in the GATA-2irGFP–expressing cells was approximately twofold that of the other cell populations. Therefore, primitive cells expressing the GATA-2irGFP vector should maintain physiologic high levels of GATA-2 due to the enforced expression of the transferred viral gene despite any external signals that might downregulate endogenous GATA-2.
RT-PCR analysis of total GATA-2, retroviral GATA-2, and β-2m RNA levels in naive and transduced immature bone marrow cells. RNAs from naive bone marrow cells fractionated by counterflow centrifugal elutriation at a flow rate of 25 mL/minute (FR 25) or 35 mL/minute (FR35) and expressing high levels of c-kit (KitHI) but lacking lineage-marker expression (Lin-)14 and from cells expressing the Sca-1 antigen but lacking lineage-marker expression were used as controls for high-level endogenous GATA-2 expression. RNAs from Sca-1+Lin− cells expressing the GATA-2irGFP and control irGFP vector, as indicated, were obtained as described in Materials and Methods. RNA from a murine erythroleukemia cell line expressing the GATA-2irGFP vector served as a positive control for the retroviral GATA-2 RNA. Predetermined amounts of each sample RNA that yielded approximately equal β-2m signals (bottom panel) within the linear range of the assay were used to assess the level of total GATA-2 RNA (top panel; endogenous plus retroviral) and retroviral GATA-2 RNA (middle panel).
RT-PCR analysis of total GATA-2, retroviral GATA-2, and β-2m RNA levels in naive and transduced immature bone marrow cells. RNAs from naive bone marrow cells fractionated by counterflow centrifugal elutriation at a flow rate of 25 mL/minute (FR 25) or 35 mL/minute (FR35) and expressing high levels of c-kit (KitHI) but lacking lineage-marker expression (Lin-)14 and from cells expressing the Sca-1 antigen but lacking lineage-marker expression were used as controls for high-level endogenous GATA-2 expression. RNAs from Sca-1+Lin− cells expressing the GATA-2irGFP and control irGFP vector, as indicated, were obtained as described in Materials and Methods. RNA from a murine erythroleukemia cell line expressing the GATA-2irGFP vector served as a positive control for the retroviral GATA-2 RNA. Predetermined amounts of each sample RNA that yielded approximately equal β-2m signals (bottom panel) within the linear range of the assay were used to assess the level of total GATA-2 RNA (top panel; endogenous plus retroviral) and retroviral GATA-2 RNA (middle panel).
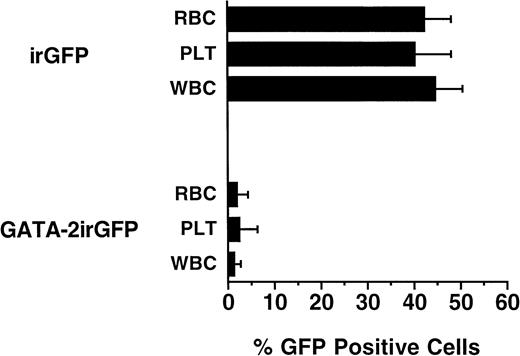
Lethally irradiated mice were transplanted with bone marrow cells transduced with either the GATA-2irGFP vector or the control irGFP vector to study the effect of enforced GATA-2 expression on hematopoietic differentiation in vivo. Six and 12 weeks post-transplantation, peripheral blood was obtained from the transplanted mice for hematologic analysis and for analysis of vector expression by FACS. All GATA-2irGFP transplanted mice (n = 10) displayed normal complete blood counts and blood cell morphology (data not shown). However, compared with control irGFP transplanted mice (n = 10) in which approximately 40% to 50% of erythrocytes (range, 38% to 41%), platelets (range, 38% to 45%), and leukocytes (range, 44% to 56%) expressed GFP at 6 weeks post-transplantation, much lower percentages of GFP-expressing cells in all peripheral blood lineages were observed in the mice transplanted with GATA-2irGFP–transduced bone marrow cells. In this latter group, the highest mean percentages of GFP+ cells were present in erythrocytes (12%; range, 7% to 14%) and platelets (6%; range, 0% to 15%), with leukocytes showing an even lower frequency of vector-expressing cells (3%; range, 0% to 8%). In addition, the absolute levels of vector expression, as judged by the mean fluorescence intensity of GFP+ cells, were lower in GATA-2irGFP–expressing cells compared with control irGFP-expressing peripheral blood cells (data not shown). At 12 weeks post-transplantation, the frequencies of GATA-2irGFP–expressing peripheral blood cells in these mice had decreased even further, with all lineages showing less than 5% positive cells (Fig 7). In contrast, animals transplanted with bone marrow cells transduced with the control irGFP vector maintained steady levels (40% to 45%) of vector-expressing cells in all lineages. Again, in the small percentage of GATA-2irGFP–expressing cells observed, the level of GFP expression was low (data not shown). Analysis of the hemoglobin phenotypes of transplanted animals (data not shown), coupled with the above FACS data, confirmed that GATA-2irGFP transplanted animals reconstituted hematopoiesis with donor stem cells that did not express the vector.
Levels of vector-expressing peripheral blood cells in animals 12 weeks after transplantation with GATA-2irGFP or control irGFP vector transduced bone marrow cells. The percentages of red blood cells (RBC), platelets (PLT), and leukocytes (WBC) expressing GFP in the peripheral blood of 10 animals transplanted with the indicated cells were determined by flow cytometry as described in Materials and Methods. The data represent the mean ± standard error of the percentage of GFP+ cells in each blood lineage for each group. The percentages of GFP+ cells in each cell subset in the two groups of animals were all statistically significantly different (P < .0004 or less) from each other.
Levels of vector-expressing peripheral blood cells in animals 12 weeks after transplantation with GATA-2irGFP or control irGFP vector transduced bone marrow cells. The percentages of red blood cells (RBC), platelets (PLT), and leukocytes (WBC) expressing GFP in the peripheral blood of 10 animals transplanted with the indicated cells were determined by flow cytometry as described in Materials and Methods. The data represent the mean ± standard error of the percentage of GFP+ cells in each blood lineage for each group. The percentages of GFP+ cells in each cell subset in the two groups of animals were all statistically significantly different (P < .0004 or less) from each other.
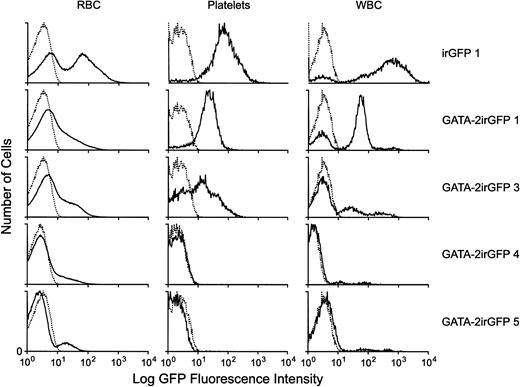
Lethally irradiated mice were also transplanted with purified populations of bone marrow cells expressing the GATA-2irGFP vector or the control irGFP vector. Analysis of the enriched cell populations before transplantation showed purities of 92% and 95% for control irGFP and GATA-2irGFP cells, respectively. There was a consistent delay in the hematopoietic reconstitution of GATA-2irGFP transplanted animals (n = 7), compared with animals transplanted with control irGFP cells (n = 5), which displayed normal blood counts at the 4-week time point. Particularly notable was prolonged thrombocytopenia and leukopenia in the GATA-2irGFP animals (data not shown). However, no deaths occurred and by 10 weeks post-transplantation blood counts in GATA-2irGFP animals had normalized. There were substantially lower percentages of GATA-2irGFP–expressing cells at 4, 6, and 10 weeks post-transplantation compared with animals transplanted with control cells that showed nearly complete marking of all peripheral blood lineages (Fig 8). As noted earlier in the mice transplanted with nonenriched GATA-2irGFP–transduced cells, peripheral blood cells from mice transplanted with purified GATA-2irGFP cells expressed the vector at a lower level than the peripheral blood cells from mice transplanted with cells expressing the control GFP vector (Fig 8). In fact, the level of GATA-2irGFP vector expression was nearly one log lower, as judged by GFP fluorescence intensity, than that observed in freshly transduced bone marrow cells (Fig 8 and Fig1B). This suggested the presence of a threshold level of GATA-2 expression in primitive repopulating cells above which differentiation into the different blood lineages was blocked. As observed in the mice transplanted with unsorted GATA-2irGFP–transduced cells, animals transplanted with purified GATA-2irGFP-expressing cells showed long-term (> 10 weeks) hematopoietic reconstitution almost exclusively with nonexpressing donor cells as assessed by FACS and hemoglobin phenotyping analysis (Fig 8 and data not shown).
Levels of GATA-2irGFP– or control-vector irGFP-expressing cells in the peripheral blood of animals selectively transplanted with vector-expressing bone marrow cells. Flow cytometric histograms of GFP fluorescence are shown for the RBC, PLT, and WBC subsets of peripheral blood from representative animals selectively transplanted with control irGFP- or GATA-2irGFP–expressing bone marrow cells. The top three panels represent analyses performed 4 weeks after transplantation. The GATA-2irGFP 4 and GATA-2GFP 5 panels were obtained at 6 and 10 weeks after transplantation, respectively. Two additional transplanted GATA-2irGFP animals had less than 10% GFP+cells in all blood lineages at the 10-week time point, whereas all control GFP animals (n = 4) displayed at least 80% GFP+ cells in all three lineages at all time points analyzed. The GATA-2irGFP 1 animal shown above had the highest level of vector-expressing cells in the cohort of six transplanted GATA-2irGFP animals at the 4-week time point, with the other GATA-2irGFP animals showing levels similar to or less than those of the GATA-2irGFP 3 animal.
Levels of GATA-2irGFP– or control-vector irGFP-expressing cells in the peripheral blood of animals selectively transplanted with vector-expressing bone marrow cells. Flow cytometric histograms of GFP fluorescence are shown for the RBC, PLT, and WBC subsets of peripheral blood from representative animals selectively transplanted with control irGFP- or GATA-2irGFP–expressing bone marrow cells. The top three panels represent analyses performed 4 weeks after transplantation. The GATA-2irGFP 4 and GATA-2GFP 5 panels were obtained at 6 and 10 weeks after transplantation, respectively. Two additional transplanted GATA-2irGFP animals had less than 10% GFP+cells in all blood lineages at the 10-week time point, whereas all control GFP animals (n = 4) displayed at least 80% GFP+ cells in all three lineages at all time points analyzed. The GATA-2irGFP 1 animal shown above had the highest level of vector-expressing cells in the cohort of six transplanted GATA-2irGFP animals at the 4-week time point, with the other GATA-2irGFP animals showing levels similar to or less than those of the GATA-2irGFP 3 animal.
GATA-2irGFP–expressing primitive cells are present in bone marrow after transplantation but fail to appreciably expand.
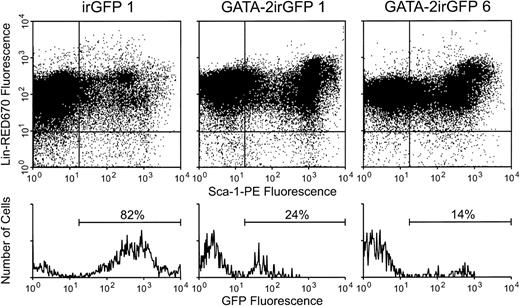
To determine the fate of GATA-2–expressing primitive cells after transplantation, mice transplanted with enriched cells expressing either the GATA-2irGFP vector (95% purity) or the control irGFP vector (92% purity) were killed 5 to 7 weeks post-transplant and bone marrow obtained. Compared with mice transplanted with control irGFP vector-expressing cells (n = 3) that always showed at least 75% of cells in the primitive Sca-1+Lin− fraction positive for vector expression, GATA-2irGFP–transplanted mice (n = 3) had much lower levels of vector-expressing Sca-1+ Lin– cells (Fig 9 and Table 1). These data indicated that the small fraction (5%) of transplanted marrow cells not expressing the GATA-2 vector greatly outcompeted the expressing cells (95%) in cell amplification. Consistent with these data, the total numbers of Sca-1+ Lin− cells present in the hind limb bones of animals transplanted with GATA-2irGFP cells were much lower than those present in animals transplanted with cells expressing the control irGFP vector (Table 1).
Levels of GATA-2irGFP- or control vector irGFP-expressing Sca-1+ Lin− cells in the bone marrow of animals transplanted with vector-expressing cells. Bone marrow cells were obtained 5 weeks after transplantation from animals transplanted with cells expressing the GATA-2irGFP or control irGFP vector. Staining for the Sca-1 and lineage marker antigens was performed as described in the Materials and Methods. The Sca-1+ Lin−cell subset in the lower right quadrant was gated on and expression of GFP fluorescence within this cell subset is shown in the histograms below each plot. The percentage of GFP+Sca-1+ Lin- cells is indicated above each histogram. Analysis of a representative control irGFP vector animal is shown.
Levels of GATA-2irGFP- or control vector irGFP-expressing Sca-1+ Lin− cells in the bone marrow of animals transplanted with vector-expressing cells. Bone marrow cells were obtained 5 weeks after transplantation from animals transplanted with cells expressing the GATA-2irGFP or control irGFP vector. Staining for the Sca-1 and lineage marker antigens was performed as described in the Materials and Methods. The Sca-1+ Lin−cell subset in the lower right quadrant was gated on and expression of GFP fluorescence within this cell subset is shown in the histograms below each plot. The percentage of GFP+Sca-1+ Lin- cells is indicated above each histogram. Analysis of a representative control irGFP vector animal is shown.
Analysis of GATA-2irGFP and Control irGFP Vector Expression in Bone Marrow Sca-1+ LIN− Cells of Transplanted Mice
| Mouse . | Total Sca+ Lin− Cells‡ (×105) . | % GFP + . | Total GFP+ Sca+ Lin− Cells (×103) . |
|---|---|---|---|
| irGFP 1* | 1.08 | 75 | 81 |
| irGFP 2* | 1.20 | 84 | 101 |
| irGFP 3† | 2.20 | 85 | 191 |
| GATA-2irGFP 1* | 0.17 | 14 | 2.38 |
| GATA-2irGFP 6* | 0.16 | 24 | 3.84 |
| GATA-2irGFP 3† | 0.38 | 3 | 1.15 |
Lethally irradiated mice were transplanted with purified populations of GATA-2irGFP vector- (3 × 10⁶ cells per mouse) and control irGFP vector-expressing marrow cells (2 × 10⁶ cells per mouse). Mice were killed and bone marrow from hind limb bones analyzed at the times indicated.
Analysis performed 5-weeks post-transplantation.
Analysis performed 7-weeks post-transplantation.
Number of cells contained in the two tibia and femur hind limb bones.
Given the known inoculum of Sca-1+ Lin−vector-expressing cells and the bone marrow seeding efficiency of hematopoietic cells,32 on the order of approximately 2000 to 3000 vector-expressing Sca-1+ Lin−cells were predicted to be present in the four hind limb bones of animals immediately after transplantation. Five to 7 weeks later, the four hind limb bones of animals that received cells expressing the GATA-2irGFP vector contained on average only 2500 Sca+Lin− cells that were positive for vector expression (Table 1). In contrast, animals that received bone marrow cells expressing the control irGFP vector contained on average 124,000 Sca-1+ Lin− cells that expressed GFP, representing at least a 40-fold expansion (Table 1). In addition, another GATA-2irGFP–transplanted animal displayed reconstitution with nonexpressing cells and a repopulating clone(s) expressing an altered provirus with rearranged GATA-2 sequences, as determined by Southern blot analysis (data not shown). The delayed engraftment and prolonged cytopenias initially observed in the GATA-2irGFP–transplanted mice are consistent with these data and suggest profound defects in both the proliferation and differentiation of primitive cells constitutively expressing GATA-2.
DISCUSSSION
The requirement for GATA-2 is critical during embryonic hematopoiesis, with loss of GATA-2 function causing fatal embryonic anemia due to a deficiency of primitive hematopoietic cells.15 However, defining the precise role of transcription factors like GATA-2 in normal adult hematopoiesis is not feasible in the case of lethal gene knock-out phenotypes. One approach to study the functional role of hematopoietic transcription factors like GATA-2 during adult hematopoiesis is through investigation of animals transplanted with stem cells genetically-modified to achieve dysregulated expression of the protein of interest. Using this strategy, our results show that retroviral-mediated, enforced expression of the GATA-2 transcription factor in a variety of primitive hematopoietic cells blocked their amplification and differentiation. The presence of the linked, coordinately expressed GFP marker in the GATA-2 vector facilitated the identification of vector-expressing cells and their progeny. This allowed the characteristics of GATA-2–expressing cells to be easily ascertained using a variety of assays. Not only was abrogation of in vitro and in vivo progenitor-derived colony formation observed, but the hematopoietic reconstituting activity of pluripotent repopulating cells was also significantly compromised by enforced GATA-2 expression. Using enriched populations of GATA-2–expressing and nonexpressing cells, these alterations in cell function were shown to not be associated with generalized cell-cycle perturbations, activation of apoptotic pathways, or coexpression of the GFP marker. Similarly, no evidence of nonspecific cell toxicity was observed on enforced GATA-2 expression. Furthermore, the effects observed are arguably attributable to the specific action of GATA-2 because others have previously shown that the enforced expression of other normal and mutant transcription factors led to specific hematopoietic phenotypes.34 35
The data presented in this report are consistent with previous studies suggesting the importance of downregulation of GATA-2 during blood cell differentiation. This phenomenon has been observed in primary human hematopoietic cell cultures, developing human BFU-E, and in human erythroleukemic cell lines induced to differentiate.10,19,36 Correspondingly, Briegel et al20 reported that transformed chicken erythroblasts fail to differentiate on activation of an ectopic, conditionally functional GATA-2 protein. In our studies, enforced expression of GATA-2 in primitive hematopoietic cells prevented clonogenic growth and differentiation both in vitro and in vivo. More importantly, GATA-2–expressing stem cells failed to substantially contribute to hematopoiesis as evidenced by transplantation experiments using both unfractionated and highly enriched populations of GATA-2–expressing cells. Our finding that the enforced GATA-2 viral RNA level was comparable to the endogenous GATA-2 levels in the Sca-1+Lin− immature cell population suggests a critical, tight regulation of GATA-2 during normal hematopoiesis. Thus, in the GATA-2–transduced immature cells, the overall level of GATA-2 remains high despite normal downregulation of the endogenous gene that likely occurs in response to signals triggering blood cell maturation. Notably, the low level of GATA-2 vector expression in those peripheral blood cells that were positive for vector expression also supports the likelihood of a strict dose-dependent effect of GATA-2 on blood cell differentiation. In addition, the observed decay with time post-transplantation in the numbers of blood cells with even low-level GATA-2 vector expression (because long-term repopulating cells replace short-term repopulating cells) suggests a gradient of sensitivity to GATA-2 levels that reflects the level of maturity of the repopulating cells active in hematopoiesis following transplantation.
In addition to their failure to differentiate in vivo, GATA-2–expressing primitive cells failed to substantially expand. In both sets of transplantation experiments, the fraction of cells present in the graft that did not express the GATA-2 vector markedly outcompeted the GATA-2–expressing cells in the reconstitution of lethally irradiated mice (Fig 7 to 9 and Table 1). In agreement with this, estimation of the total number of vector-expressing Sca-1+ Lin− cells present in animals, transplanted 5 to 7 weeks previously with purified populations of vector-expressing cells, showed the persistence of GATA-2–expressing primitive cells without substantial amplification. In contrast, primitive cells expressing the control irGFP vector showed a large expansion. The findings that enforced GATA-2 expression prevents stem cell participation in hematopoiesis indicate that constitutively high levels of GATA-2 have an overriding effect over other signals triggering stem cell activation. These observations lead us to hypothesize that the unusually high levels of GATA-2 normally present in primitive cells may function to preserve a quiescent stem cell population and that downregulation of GATA-2 expression during normal hematopoiesis is required for amplification, differentiation, and maturation of hematopoietic elements. These results extend previous work showing that GATA-2 is crucial in maintaining the pool of early hematopoietic cells.15 16 Potential regulators of GATA-2 levels, such as particular combinations or concentrations of multiple cytokines and/or adhesion molecules, may control both self-renewal divisions and the activation of quiescent stem cells to participate in hematopoiesis through their ability to lower GATA-2 levels.
The powerful block in hematopoiesis observed on enforced GATA-2 expression raises important questions regarding potential mechanisms of action. Our failure to observe a perturbation in the cell-cycle phase distribution of GATA-2–expressing bone marrow cells favors the lack of a nonspecific cell-cycle effect by GATA-2. However, a specific perturbation of the cell-cycle machinery in hematopoietic progenitors and stem cells cannot be ruled out because these cells comprised only a very small fraction of the cultured bone marrow cells analyzed. Although feasible, isolation of adequate numbers of primitive cells expressing GATA-2 for direct analysis may not be informative due to their normally relatively quiescent state.37-39 In this regard, studies to directly measure cycling of Sca-1+Lin− GATA-2–expressing cells in vivo may be both informative and preferable.
In summary, the experiments described here establish GATA-2 as an important regulator of stem cell proliferation and differentiation in normal adult hematopoiesis. The high level of expression of endogenous GATA-2 in stem cells previously observed,14 together with our data suggests that GATA-2 may act as one regulator of stem cell quiescence. In turn, the regulation of GATA-2 expression in response to a complex network of environmental signals may determine the dynamic state of activation of particular stem cell clones and their contribution to hematopoiesis. The delineation of GATA-2 target genes and the molecular mechanisms underlying different GATA factor-specific interactions with coactivators and particular target genes should yield important insight into the biology of hematopoietic stem cells and the process of hematopoiesis.
ACKNOWLEDGMENT
The authors thank Drs Richard Cross and Ann Marie Hamilton-Easton for their expertise in flow cytometric purification and analysis and Laurie J. Girard for expertise in the RT-PCR assay. We also wish to thank Jean K. Johnson for her assistance in the preparation of this manuscript.
Supported in part by National Heart, Lung, and Blood Institute Program Project Grant No. P01 HL 53749; Cancer Center Support CORE Grant No. P30 CA 21765; and American Lebanese Syrian Associated Charities (ALSAC, Memphis, TN).
The publication costs of this article were defrayed in part by page charge payment. This article must therefore be hereby marked “advertisement” in accordance with 18 U.S.C. section 1734 solely to indicate this fact.

This feature is available to Subscribers Only
Sign In or Create an Account Close Modal