Abstract
Coproporphyrinogen oxidase (CPO) catalyzes the sixth step of the heme biosynthetic pathway. To assess the tissue-specific regulation of the CPO gene promoter, mouse genomic DNA clones for CPO were isolated. Structural analysis demonstrated that the mouse CPO gene spans approximately 11 kb and consists of seven exons, just like its human counterpart. Functional analysis of the promoter by transient transfection assays indicated that synergistic action between an SP-1–like element at −21/−12, a GATA site at −59/−54, and a novel regulatory element, CPRE (-GGACTACAG-) at −49/−41, is essential for the promoter activity in murine erythroleukemia (MEL) cells. In nonerythroid NIH3T3 cells, however, the GATA site is not required. Gel mobility shift assays demonstrated that specific DNA-protein complexes can be formed with each element, and that there are cell-specific differences in factors, which bind to the SP-1–like element between MEL and NIH3T3 cells. These results provide evidence for differential regulation of the promoter function of CPO gene between erythroid and nonerythroid cells.
© 1998 by The American Society of Hematology.
THE BIOSYNTHESIS OF HEME is differently regulated between erythroid and nonerythroid cells.1 During erythroid differentiation, the expression of each enzyme increases sequentially, beginning with the first enzyme of the pathway, erythroid-specific δ-aminolevulinate synthase (ALAS-E).2-5 In liver, on the other hand, under conditions that increase the rate of heme synthesis, only the first enzyme, nonspecific (housekeeping) ALAS-N is upregulated, while the level of other enzymes remains unchanged.1 It is likely that this latter type of regulation may also take place in other nonerythroid tissues.
There are two principal reasons that account for the distinct tissue-specific regulation of heme synthesis. The first is the finding that the two ALAS isozymes6,7 are encoded by distinct genes, erythroid-specifically expressed, ALAS-E, and nonspecific, ALAS-N. The second is that both δ-aminolevulinate dehydratase and porphobilinogen deaminase (PBGD), the second and third enzymes in the pathway, respectively, are transcribed from two distinct promoters in a tissue-specific manner with 5′-alternative splicing.8-10 However, it is unclear whether there is distinct tissue-specific regulation of other enzymes in the heme biosynthetic pathway.
Coproporphyrinogen oxidase (CPO, EC 1.3.3.3), the sixth enzyme in the heme biosynthetic pathway, catalyzes the removal of the carboxyl group and two hydrogen atoms from the propionate groups at positions 2 and 4 of coproporphyrinogen III, resulting in the formation of vinyl groups at these positions.11 The mRNA level and activity of CPO have been shown to be significantly increased in murine erythroleukemia (MEL) cells during dimethyl sulfoxide (DMSO)-induced erythroid cell differentiation,12 while they are unchanged in mouse liver by treatment with 2-allyl-2-isopropylacetamide, despite a potent induction of ALAS-N by the chemical.13 These findings suggested that CPO expression might be regulated in a different manner between erythroid and nonerythroid cells. Furthermore, CPO has been reported to become rate-limiting for heme synthesis during erythroid differentiation.12 Thus, it is important to clarify the regulatory mechanism of CPO gene expression and its role in erythroid differentiation. Recently, mouse and human cDNA clones and a human genomic DNA clone of CPO were isolated.14,15Structural analysis of the human CPO gene showed that it consists of seven exons spanning approximately 14 kb, and that CPO mRNA is transcribed from a single promoter both in erythroid and in nonerythroid cells.14 Thus, it appears that a single promoter may regulate both inducible and constitutive expression of the CPO gene.
To examine the regulation of the CPO gene between erythroid and nonerythroid cells, we performed structural analysis of the mouse CPO gene and compared its promoter function in MEL and NIH3T3 cells. Our results indicate that CPRE, a novel regulatory element found at −49/−41, plays an essential role in CPO gene expression both in MEL and NIH3T3 cells, while interaction with GATA-1 and SP-1–like element-binding protein is additionally necessary for the maximal upregulation of the CPO gene in MEL cells.
MATERIALS AND METHODS
Isolation and characterization of mouse CPO genomic clones.
The 129 SVJ mouse genomic library in the λ FIXII vector (Stratagene, La Jolla, CA) was screened using a 1.4-kb EcoRI–digested fragment of the mouse CPO cDNA clone containing the entire coding region as a probe.15 Seven independent clones were obtained and mapped. Because two overlapping clones, B6 and B8, were found to cover the entire mouse CPO gene, they were used for further analysis. Nucleotide sequences were determined with a cycle sequencing system using ABI 377 sequencer (Perkin-Elmer Corp, Foster City, CA).
Identification of the first exon and the transcription initiation site.
The transcription start site was estimated by polymerase chain reaction (PCR) amplification of the 5′-end of cDNA. A total of 2 μg of poly (A)+ RNA prepared from mouse liver and MEL cells were used as starting materials, with 5′-rapid amplification of cDNA end (RACE) amplification kit (GIBCO-BRL, Rockville, MD).16 Oligonucleotide primers complementary to nucleotides −270/−251 and −273/−254 of the mouse CPO cDNA15 were used for the first strand cDNA synthesis and PCR amplification. PCR products were isolated and sequenced.
Cell culture.
MEL cells, clone 745A, and NIH3T3 cells were grown in Dulbecco’s Modified Eagle Medium (DMEM; Nissui, Tokyo, Japan), supplemented with 10% fetal bovine serum, and split every 3 days. For preparation of nuclear extracts, cells from 24- to 48-hour-old cultures were resuspended in the fresh medium at a density of 5 × 10⁴ cells/mL and incubated for 16 hours, to ascertain a logarithmic cell growth. Then DMSO was added at a concentration of 2% (vol/vol) and incubation was continued for 24 hours. While these cells did not show an increase in benzidine-positive cells at 24 hours, over 90% of cells became benzidine-positive when incubation was continued for 4 days.
Plasmids.
A series of deletion mutants of the mouse CPO gene promoter were constructed, which were also fused to a luciferase reporter gene. First, various DNA fragments of the mouse CPO gene promoter region were obtained by PCR using the following forward primers: 5′-CGTTGGTACCCTTCATTTATCACC-3′ (spanning positions −958 to −935), 5′-ACAGCCGGTACCGAAGCTTGTG-3′ (−660 to −639), 5′-TAGTTAAAGGGGTACCGAGCCC-3′ (−579 to −558), 5′-CTTTGGGTACCCCAAGCACAGG-3′ (−374 to −353), 5′-CCACAGGTACCACGAAGACAAG-3′ (−330 to −309), 5′-CTAACGGTACCTTTGCTCACTG-3′ (−262 to −241), 5′-AAGGGGTACCTGACTAAAGCGC-3′ (−217 to −196), 5′-GCAGCGGTACCCACCTCTGTGC-3′ (−135 to −114), 5′-TTTCCGGTACCGGTCAGGCGAG-3′ (−90 to −69), 5′-CGAGGGTACCAGGCGATAGGAC-3′ (−72 to −51), 5′-GGAGGGTACCGGACGGGACTAC-3′ (−64 to −43), 5′-GGACGGTACCACAGTTCCCAG-3′ (−54 to −34), 5′-GCCTGGTACCTACACTCGCAGC-3′ (−9 to +13), and the acceptor primer, 5′-ATCTCCAAGGTCCTCGAGGCCC-3′ (+50 to +71). The amplified DNA fragments were digested with Kpn I and Xho I and inserted into the Kpn I/Xho I site of the pGL3-Basic plasmid (Promega, Madison, WI), which yielded pGL946, pGL648, pGL563, pGL363, pGL319, pGL251, pGL207, pGL124, pGL79, pGL62, pGL54, pGL44, and pGL2. pGL79-Gm, -Sm, -GXm, -51m, -49m, -47m, -45m, and -42m were created with Transformer site-directed mutagenesis system (Clontech, Palo Alto, CA) using the following mutagenic primers, respectively, and nucleotide sequences of mutants were verified by sequencing: 5′-CGAGTGCAGGAGGCGTAAGGACGGGACTACAG-3′, 5′-CCTCCTCGGCTCCTTCCAGCAGCCTGCG-3′, 5′-CGAGTGCAGGAGGCGTAAGGACGGGTTTACAG-3′, 5′-GCAGGAGGCGATAGGATTGGACTACAGTTCCC-3′, 5′-GGAGGCGATAGGACGTTACTACAGTTCCCAGC-3′, 5′-GAGGCGATAGGACGGGTTTACAGTTCCCAGCAG-3′, 5′-GCGATAGGACGGGACACCAGTTCCCAGCAGCC-3′, and 5′-GATAGGACGGGACTACTATTCCCAGCAGCCTCC-3′.
Transfection and luciferase assays.
A total of 2 μg of each reporter plasmid and 1 μg of pENL17 (as an internal control) were cotransfected into MEL cells using DOTAP (N-[1-(2,3-dioleoyloxy)propyl]-N,N,N-trimethylammonium methylsulfate) (Boehringer Mannheim Corp, Indianapolis, IN) according to the manufacturer’s protocol. Briefly, a total of 5 × 10⁵cells were incubated with the plasmids and DOTAP in 1 mL of DMEM without serum for 6 hours. Then 2 mL of fresh DMEM with 10% fetal bovine serum was added. DMSO was added to cultures at a concentration of 2% (vol/vol) and incubation was continued for 20 hours. Cells were then harvested, rinsed with phosphate-buffered saline (PBS) once, and lysed in 75 μL of 1× Reporter Lysis Buffer (Toyo Ink, Ltd, Tokyo, Japan). Luciferase activities were determined using Luciferase Assay System (Promega) and normalized on the basis of β-galactosidase activities, which were determined using chlorophenol red-β-galactopyranoside as substrate.18 NIH3T3 cells were also transfected with the reporter plasmids similarly. NIH3T3 cells were seeded at a density of 2.5 × 10⁵ per 3 mL of DMEM in a 40-mm dish and incubated for 18 hours before transfection.
Preparation of nuclear extracts.
Nuclear extracts were prepared according to the method described by Lassar et al19 with minor modification. Briefly, 1 × 10⁷ cells were collected, washed once with PBS, pelleted, resuspended in 1 mL of the lysis buffer containing 10 mmol/L Tris-HCl (pH7.4), 10 mmol/L NaCl, 3 mmol/L MgCl2, and 0.5% Nonidet P-40 and placed on ice for 5 minutes. After centrifugation, nuclear pellets were resuspended in 100 μL of 20 mmol/L Tris-HCl (pH7.9), 420 mmol/L KCl, 0.2 mmol/L EDTA, 10% glycerol, 2 mmol/L dithiothreitol (DTT) and 0.1 mmol/L phenylmethylsulfonyl fluoride, placed on ice for 10 minutes, and centrifuged. The supernatants thus obtained were used as nuclear extracts for gel mobility shift assays. Protein concentration was determined by using a Protein Assay Kit (Bio-Rad, Hercules, CA).
DNA gel mobility shift assays.
The following oligomers were used as probes for gel mobility shift assays: CPRE, 5′-ATAGGACGGGACTACAGTTCC-3′; GATA, 5′-TGCAGGAGGCGATAGGACGGGACT-3′; SP-1-like, 5′-CTCCTCGGCTCCCGCCAGCAGCCTGC-3′, corresponding to nucleotides −57 to −36, −68 to −44 and −29 to −4 of the mouse CPO gene, respectively. For SP-1, 5′-GGACTTTATGGGGGCGGGGCTAAAGGAGGG-3′ was used, which included the consensus SP-1 binding site. Oligomers were end-labeled with [γ-32P] adenosine triphosphate (ATP) by T4 polynucleotide kinase (Boehringer Mannheim Corp). The antisense oligomer was then added to the 32P-end–labeled oligomer to yield a double-stranded probe. A total of 5 μg of nuclear extracts was incubated in a reaction mixture containing 20 mmol/L HEPES buffer (pH 7.8), 60 mmol/L KCl, 0.2 mmol/L EDTA, 6 mmol/L MgCl2, 0.5 mmol/L DTT, 10% (vol/vol) glycerol, and 1.5 μg of an equimolar mixture of poly (dI-dC) and poly (dA-dT) with a 32P-labeled oligomer for 15 minutes on ice. For competition assays, the following oligomers were used as double-stranded forms: AEGATA, 5′-TTTGGGTTTTATCTCTAGCAAGG-3′ (corresponding to nucleotides −135 to −113 of the human ALAS-E gene); AECACCC, 5′-CCGCAGAAGGCAGGGTGGGTGGG-3′ (corresponding to nucleotides −73 to −51 of the human ALAS-E gene); and CPREm, 5′-ATAGGACGAGTTAATAATTCC-3′ (mutated CPRE containing 6 transversions in −49/−41). For supershift assays, 3 μL of anti–GATA-1 (N6) (Santa Cruz Biotechnology, Inc, Santa Cruz, CA) was added to the reaction mixture after the addition of the probe. The mixture was then loaded onto a 4% polyacrylamide gel and electrophoresed at 150 V at 4°C.
RESULTS
Isolation of mouse CPO gene.
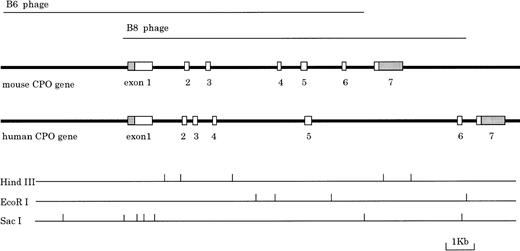
To clarify the regulatory mechanism of CPO gene expression, we first isolated genomic DNA clones, which encode mouse CPO protein from a mouse liver genomic DNA library. As shown in Fig 1, two overlapping clones, termed B6 and B8, were isolated, which contained the entire gene including approximately up to 4 kb of the 5′-upstream region. The organization of the mouse CPO gene was determined by Southern blot analysis using cDNA probes corresponding to various parts of the mouse CPO mRNA, and the sequence of each exon-intron junction was also determined. This analysis showed that the mouse CPO gene consists of a total of seven exons, which spans approximately 11 kb. The last exon (exon 7) includes a large 3′-untranslated region (Fig 1). The length of the introns varies from 652 bp to 2.4 kb, and all exon-intron boundaries conform completely to the GT/AG rule (Table 1). Genomic DNA blot hybridization analysis demonstrated that the mouse CPO is specified by a single genomic locus (data not shown).
Structure and organization of the mouse CPO gene. Two overlapping l phage clones (B6 and B8) were analyzed. The boxes show the relative sizes and positions of each exon in the mouse genome. Solid and shaded boxes indicate protein coding and untranslated regions, respectively. Recognition sites for enzymes HindIII,EcoRI, and SacI are shown. Lower lines show restriction endonuclease cleavage sites, as indicated.
Structure and organization of the mouse CPO gene. Two overlapping l phage clones (B6 and B8) were analyzed. The boxes show the relative sizes and positions of each exon in the mouse genome. Solid and shaded boxes indicate protein coding and untranslated regions, respectively. Recognition sites for enzymes HindIII,EcoRI, and SacI are shown. Lower lines show restriction endonuclease cleavage sites, as indicated.
Exon/Intron Boundary Sequences of the Mouse CPO Gene
| Exon No. . | Exon Size (bp) . | Exon-Intron Boundaries . | Intron Size (bp) . | Intron No. . | |||
|---|---|---|---|---|---|---|---|
| 1 | 636 | AGGAAAGAA | gtgaggagag | ∼1,700 | 1 | ||
| 2 | 145 | ctatggacag | GAGGAGGTGG | AGATAGTAA | gtccgataac | 652 | 2 |
| 3 | 111 | aattttccag | GTAATTGCCA | AAGCTGACG | gtaagctttg | ∼2,400 | 3 |
| 4 | 142 | gctttcatag | GTAACACACA | TAAAAAATG | gtgagctgtc | ∼700 | 4 |
| 5 | 219 | cccgttctag | GTGTGACGAC | GAGAGGGCG | gtgagtgaca | ∼1,400 | 5 |
| 6 | 105 | tttctgacag | GTATGTGGAG | GACAGCAAG | gtaagaagct | ∼1,000 | 6 |
| 7 | 1,534 | acatgcgtag | ATGGGAGTAC | CCAAATAAA | |||
Sequencing analysis of the upstream region of the mouse CPO gene.
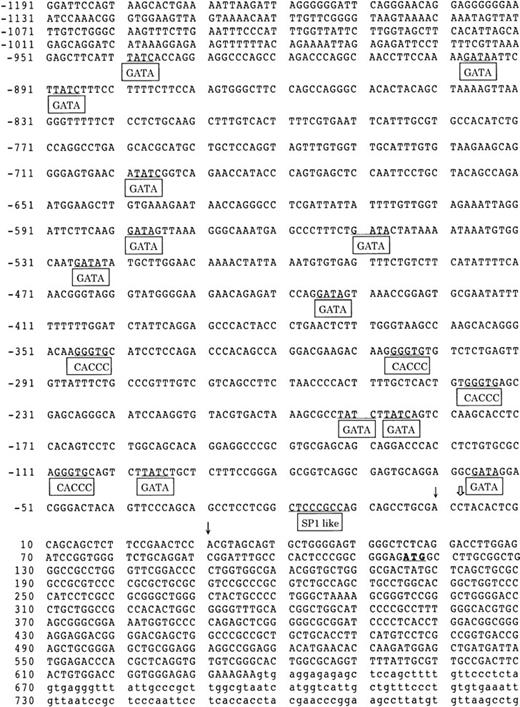
To investigate the regulatory mechanism of the mouse CPO gene, we determined the sequence of the 5′-upstream region up to ≈1,200 bp from the transcription start site (Fig2). Notable features in this region are 12 putative GATA motives that contain the sequence nGATAn, and four CACCC elements with no obvious TATA or CAAT boxes. An SP-1 consensus-like sequence, CTCCCGCCAG, was found near the transcription start site. The presence of these cis-elements as well as their spatial arrangement are similar to those observed in the promoter region of the human CPO gene,20which contains four GATA motives, six putative SP-1 binding sites, and two CACCC elements within a 786-bp region upstream from the transcription start site.
The 5′-upstream region of the mouse CPO gene. The nucleotide sequence of the first exon (uppercase letters) and 5′ -upstream regions (−1.2 kb) is demonstrated. White and black arrows indicate the major and the minor transcription initiation sites, respectively. The putative cis-acting GATA, CACCC, and SP-1–like elements are boxed and underlined. The initiating codon is shown in bold and underlined. The intronic sequence is expressed in lowercase letters.
The 5′-upstream region of the mouse CPO gene. The nucleotide sequence of the first exon (uppercase letters) and 5′ -upstream regions (−1.2 kb) is demonstrated. White and black arrows indicate the major and the minor transcription initiation sites, respectively. The putative cis-acting GATA, CACCC, and SP-1–like elements are boxed and underlined. The initiating codon is shown in bold and underlined. The intronic sequence is expressed in lowercase letters.
A novel regulatory element found at −49/−41 is critical for the mouse CPO promoter activity in NIH3T3 cells.
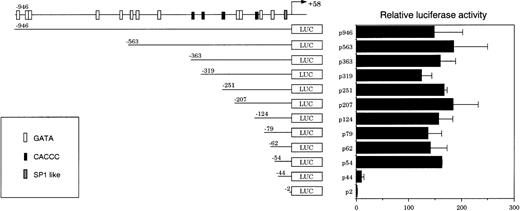
To clarify the regulatory elements for constitutive CPO gene expression in nonerythroid cells, transient transfection assays were performed in NIH3T3 cells using a nested series of promoter deletion constructs fused to a luciferase reporter gene. As shown in Fig 3, p946 demonstrated a high level of the reporter activity. The removal of the sequence between −946 and −54, where all GATA and CACCC sites are found, did not significantly change the activity. A further deletion of the promoter region from −54 to −44, however, caused a markedly decreased activity. Essentially similar results were obtained when H4IIE cells, a rat hepatocellular carcinoma-derived cell line, were used instead of NIH3T3 cells in the transfection assay (data not shown). These findings suggest that there may be a hitherto unrecognized regulatory element in the region between −54 and −44.
Transient mouse CPO gene promoter activity in NIH3T3 cells. A series of 5′-deletion mutants of the mouse CPO gene promoter were assayed for luciferase activity. The results are expressed as ratios to that obtained with a pGL3-Basic plasmid. Data are mean values from three separate experiments.
Transient mouse CPO gene promoter activity in NIH3T3 cells. A series of 5′-deletion mutants of the mouse CPO gene promoter were assayed for luciferase activity. The results are expressed as ratios to that obtained with a pGL3-Basic plasmid. Data are mean values from three separate experiments.
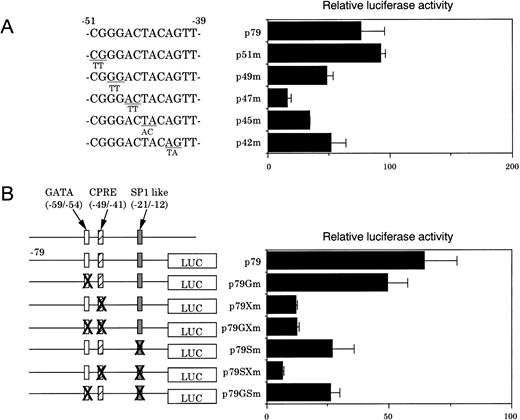
To investigate this question, various constructs in which point mutations were inserted into this region were generated and transfected into NIH3T3 cells. Nucleotide substitutions at −49 and −48 (p49m) and at −42 and −41 (p42m) resulted in a moderate decrease in the reporter activity (≈60% compared with that of p79) (Fig 4A). In contrast, mutation insertions at −47 and −46 (p47m) and at −45 and −44 (p45m) resulted in a marked decrease in the reporter activity (to ≈20% and ≈30% of that represented by p79, respectively), while mutations at −51 and −50 had no effect (Fig 4A). These results indicate that the nucleotide sequence, GGACTACAG, which we termed CPRE, is essential for the promoter function in NIH3T3 cells. The removal of a region between −44 and −2, which contained an SP-1–like element, CTCCCGCCAG, resulted in a further decrease in the promoter activity (Fig 3). The importance of the SP-1–like element for the promoter activity was substantiated by the finding that p79Sm, a mutated p79, had a significantly decreased reporter activity (≈60% compared with the wild-type p79) (Fig 4B). p79SXm, double mutations in the CPRE, and the SP-1–like element depressed the promoter activity more than did p79Xm, and p79Sm, a single mutation construct of CPRE and SP-1–like element, respectively (Fig 4B). These findings indicate that CPRE at −49/−41 is essential for the promoter activity, and that the SP-1–like element at −21/−12 also additionally contributes to the promoter function.
(A) Identification of CPRE by functional assays in NIH3T3 cells. The effects of nucleotide transversions in the region between −51 and −40 were examined. The results are expressed as the ratios of luciferase activities to that obtained with a pGL3-Basic plasmid. Data are the means of triplicate determinations. (B) Various constructs with the indicated mutations were transfected into NIH3T3 cells. Results are the means of three separate experiments.
(A) Identification of CPRE by functional assays in NIH3T3 cells. The effects of nucleotide transversions in the region between −51 and −40 were examined. The results are expressed as the ratios of luciferase activities to that obtained with a pGL3-Basic plasmid. Data are the means of triplicate determinations. (B) Various constructs with the indicated mutations were transfected into NIH3T3 cells. Results are the means of three separate experiments.
Functional studies of the mouse CPO gene promoter in MEL cells.
CPO gene expression has been reported to increase significantly during erythroid differentiation in MEL cells.20 As shown in Fig 5, p946 conferred a 70-fold higher transcription of the reporter gene compared with pGL3Basic, a promoter-less luciferase reporter construct. Treatment with DMSO, a potent inducer of erythroid differentiation of MEL cells, elicited a significant increase in luciferase activity (Fig 5), while the same treatment had no effect on the activity in NIH3T3 cells (data not shown). These findings indicate that the promoter activity is increased during erythroid differentiation of MEL cells, but not in nonerythroid cells such as NIH3T3 cells.
Transient mouse CPO gene promoter activity in MEL cells in the presence or absence of DMSO. MEL cells were transfected with the series of 5′-deletion mutants shown in Fig 3 and incubated in the presence or absence of 2% DMSO for 20 hours. The results are expressed as ratios to the luciferase activity of pGL3-Basic plasmid in the cells without DMSO treatment. Data are means of three separate experiments.
Transient mouse CPO gene promoter activity in MEL cells in the presence or absence of DMSO. MEL cells were transfected with the series of 5′-deletion mutants shown in Fig 3 and incubated in the presence or absence of 2% DMSO for 20 hours. The results are expressed as ratios to the luciferase activity of pGL3-Basic plasmid in the cells without DMSO treatment. Data are means of three separate experiments.
The levels of both basal and DMSO-induced luciferase activities remained unaffected by the removal of a sequence between −946 and −54, which contains 12 GATA sites and four CACCC elements. Further deletion from −54 to −44, however, resulted in a significant decrease both in the basal and in DMSO-induced luciferase activities, and the removal of a sequence between −44 and −2 caused a further loss of activity (Fig 5). These results suggest that CPRE at −49/−41 and the SP-1–like element at −21/−12 may also be important for the promoter activity in MEL cells.
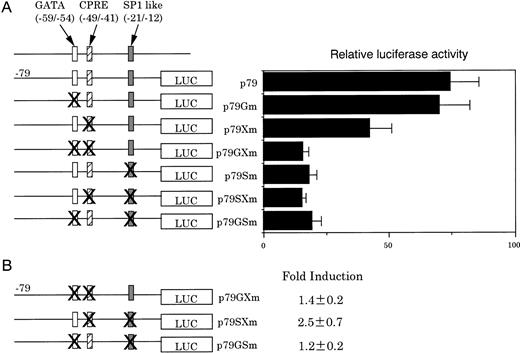
Because our previous studies showed that a GATA site near the SP-1–like element may be involved in the human CPO gene upregulation,20 this question was examined in detail. For this purpose, various mutated constructs containing nucleotide substitutions were generated from p79, transfected into MEL cells, and luciferase activities were determined (Fig6A). A mutation in the GATA site (p79Gm) had no effect on the promoter activity, although it abrogated formation of the specific DNA-protein complex (data not shown). In contrast, a mutation in the CPRE (p79Xm) decreased luciferase activity (≈60% of that generated by the wild-type p79), and inhibition was markedly pronounced when the GATA site was also mutated. p79Sm, a mutation in the SP-1–like element alone, significantly decreased the activity, which was similar to those observed with p79GSm and p79SXm, a second mutation in the GATA site, and CPRE, respectively. These results indicate that the SP-1–like element is essential for basic expression, but not sufficient for full activation of the promoter, and that there may be synergistic regulation of the promoter function among these elements in erythroid cells.
Effect of disruption of individual or paired cis-elements on luciferase activities. (A) MEL cells were transfected with various constructs with the indicated mutations and incubated for 20 hours in the absence of DMSO. Results are the means of three separate experiments. (B) MEL cells were transfected with various mutation constructs and incubated for 20 hours in the presence of DMSO. Fold induction is expressed as the ratio of luciferase activities of cells transfected with indicated constructs in the figure to that obtained with PGL3-Basic. Results are expressed as the means of three separate experiments.
Effect of disruption of individual or paired cis-elements on luciferase activities. (A) MEL cells were transfected with various constructs with the indicated mutations and incubated for 20 hours in the absence of DMSO. Results are the means of three separate experiments. (B) MEL cells were transfected with various mutation constructs and incubated for 20 hours in the presence of DMSO. Fold induction is expressed as the ratio of luciferase activities of cells transfected with indicated constructs in the figure to that obtained with PGL3-Basic. Results are expressed as the means of three separate experiments.
The role of the three regulatory elements was then examined during erythroid cell differentiation of MEL cells by DMSO treatment. p79GXm and p79GSm, which did not contain GATA, but contained the SP-1–like element and CPRE, respectively, demonstrated only a slight increase in luciferase activity after DMSO treatment. In contrast, p79SXm, which contained the GATA site, but not SP-1–like element and CPRE, showed a twofold increase in the luciferase activity as compared with that by p79 (Fig 6B). These results indicate that the GATA site at −59/−54 plays also a significant role in DMSO-mediated induction of the promoter activity, consistent with our earlier finding in human CPO gene promoter activity.20
A specific DNA-protein complex is formed at CPRE at −49/−41 in both MEL and NIH3T3 cells.
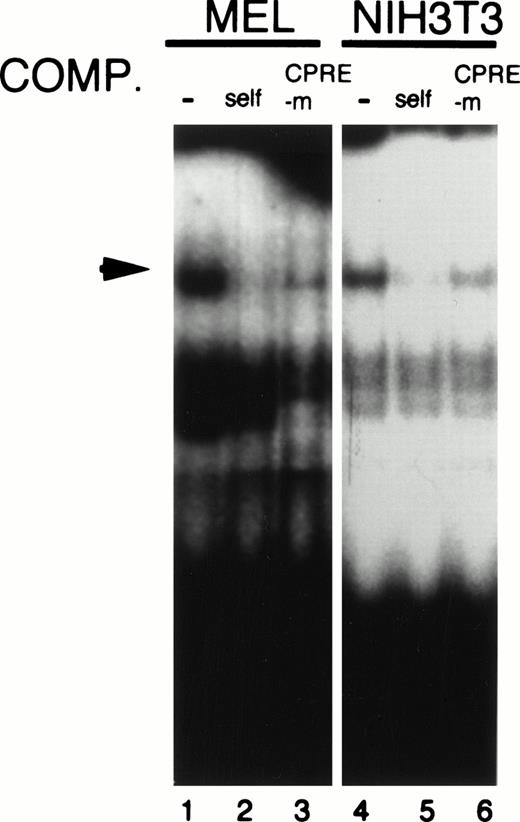
Our results demonstrated that CPRE plays a critical role in mouse CPO promoter function both in erythroid and in nonerythroid cells. To identify nuclear proteins that bind to this element, gel mobility shift assays were performed using a CPRE double-stranded oligomer. When the radiolabeled oligomer was incubated with nuclear extracts from MEL cells, a single major retarded band was found (Fig 7, lane 1). This band disappeared by the addition of a 125-fold molar excess of the unlabelled CPRE (Fig 7, lane 2), while the addition of CPREm, a mutated CPRE oligomer, had no effect (Fig 7, lane 3). A single band with a similar gel retardation property was also observed when nuclear extracts from NIH3T3 cells were used (Fig 7 lane 4 and 6), indicating that there may be a common element between erythroid and nonerythroid cells, which may be recognized by their nuclear proteins. The amount of DNA-protein complex at this site was unaffected by DMSO treatment of MEL cells (data not shown), however, suggesting that upregulation of the promoter activity by DMSO treatment is likely due to an increase in the transactivation activity of CPRE-binding protein.
Formation of a DNA-protein complex with CPRE of the mouse promoter. Five-microgram aliquots of nuclear extracts from MEL or NIH3T3 cells were incubated with the end-labeled oligomers corresponding to CPRE in the absence (−) or presence of a 125-fold (MEL) or 175-fold (NIH3T3) molar excess of the indicated oligonucleotides. The specific DNA-protein complex band is shown by the arrow.
Formation of a DNA-protein complex with CPRE of the mouse promoter. Five-microgram aliquots of nuclear extracts from MEL or NIH3T3 cells were incubated with the end-labeled oligomers corresponding to CPRE in the absence (−) or presence of a 125-fold (MEL) or 175-fold (NIH3T3) molar excess of the indicated oligonucleotides. The specific DNA-protein complex band is shown by the arrow.
The GATA site at −59/−54 is recognized by GATA-1 in MEL cells.
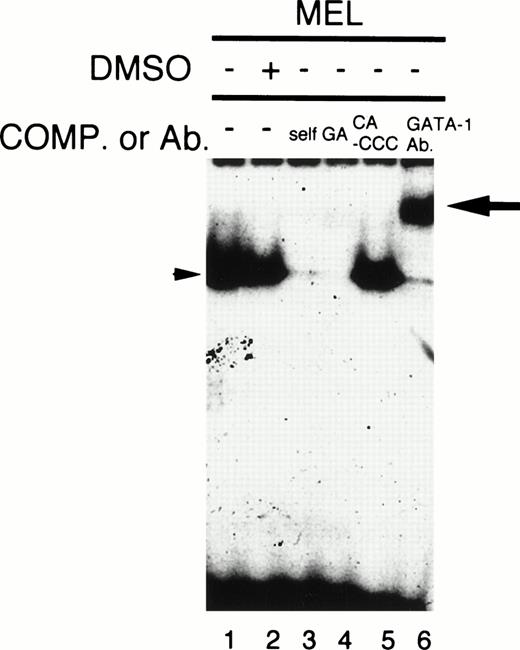
Our studies show that GATA site at −59/−54 is also important for the CPO promoter function (Fig 6A and B). Because GATA-1 is known to be abundantly expressed in MEL cells,21-23 it is possible that GATA-1 may contribute to the CPO promoter function via binding to GATA site(s). Gel retardation assays showed that there is a single major retardation band by the addition of an oligomer corresponding to the GATA site (−59/−54), and that it disappeared by the addition of a 250-fold molar excess of the unlabeled oligomer, or an oligomer containing the GATA consensus sequence (Fig 8, lane 3 and 4). Furthermore, addition of anti–GATA-1 antibody entirely supershifted this band (Fig8, lane 6). These results clearly indicate that GATA-1 specifically binds to this site in MEL cells. However, the amount of DNA-protein complex was less in DMSO-treated than in untreated cells (Fig 8, lane 1 and 2). While this finding seems paradoxical, it is consistent with a previous report, which showed that GATA-1 mRNA level was transiently decreased after DMSO treatment, but recovered with time.24Thus, it is possible that GATA-1 may become transiently either active, or an interaction between GATA-1 and other nuclear proteins may be induced by DMSO treatment.
Gel mobility shift/supershift assay of MEL cell extracts. Five-microgram aliquots of nuclear extracts from untreated (lanes 1, 3, 4, 5, 6) or DMSO-treated (lane 2) 745A cells were incubated with end-labeled oligomers corresponding to the GATA site (−59/−54) in the absence (lanes 1 and 2) or presence of a 250-fold molar excess of the indicated oligonucleotides (lanes 3, 4, 5) or anti–GATA-1 antibody (lane 6). The arrowhead indicates the complex of the probe and GATA-1, and the arrow represents the ternary complex of the probe, GATA-1, and the antibody.
Gel mobility shift/supershift assay of MEL cell extracts. Five-microgram aliquots of nuclear extracts from untreated (lanes 1, 3, 4, 5, 6) or DMSO-treated (lane 2) 745A cells were incubated with end-labeled oligomers corresponding to the GATA site (−59/−54) in the absence (lanes 1 and 2) or presence of a 250-fold molar excess of the indicated oligonucleotides (lanes 3, 4, 5) or anti–GATA-1 antibody (lane 6). The arrowhead indicates the complex of the probe and GATA-1, and the arrow represents the ternary complex of the probe, GATA-1, and the antibody.
SP-1 does not bind to the SP-1–like element (−21/−12) in MEL and NIH3T3 cells.
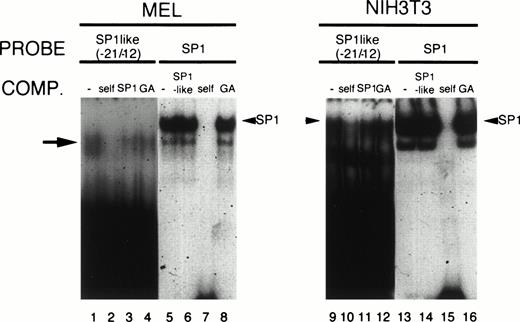
The SP-1–like element at −21/−12 was also shown to be important for the promoter function both in MEL and NIH3T3 cells, which also functions synergistically with GATA-1 and CPRE binding proteins in MEL cells (Fig 6A). As shown in Fig 9, when a nuclear extract prepared from MEL cells was incubated with the radiolabeled oligomer containing the SP-1–like element, a single retarded band that migrated faster than that with SP-1 was observed (Fig 9, lane 1). This band could not be competed by the addition of a cold oligomer containing SP-1 consensus sequence (Fig 9, lane 3). This was not due to a difference in the affinity of SP-1 for these elements, as the band representing SP-1 was not suppressed by the addition of an excess amount of the cold oligomer containing an SP-1–like element (Fig 9, lane 6). Furthermore, the addition of anti-SP–1 antibody had no effect on the migration of the band (data not shown), indicating that the nuclear protein(s), which forms a complex with SP-1 is different from that which forms a complex with the SP-1–like element. A specific DNA-protein complex was also formed when a nuclear extract from NIH3T3 cells was used. It migrated similarly as did the SP-1-DNA complex, but its formation was not inhibited by the addition of an excess amount of the cold oligomer corresponding to the SP-1 consensus sequence (Fig 9, lane 11). These results indicate, as in the case with MEL cells, that SP-1 also does not bind to this element in NIH3T3 cells. It should also be noted that there is difference in the migration of bands between MEL and NIH3T3 cells, suggesting that different factors may bind to the SP-1–like element in each type of cells. Alternatively, the same factor may bind with different affinities in a different cellular environment, eg, proteolytic modifications in MEL cells, and such a possibility requires further investigation.
Formation of a DNA-protein complex with the SP-1–like element of the mouse CPO promoter. Five-microgram aliquots of nuclear extracts from 745A (lanes 1 to 8) or NIH3T3 (lanes 9 to 16) cells were incubated with the end-labeled oligomers corresponding to the SP-1–like element (-21/-11) (lanes 1 to 4, 9 to 12) or the SP-1 consensus sequence (lanes 5 to 8, 13 to 16). Competition assays were performed with a 250-fold molar excess of unlabeled oligonucleotides containing the SP-1–like element (−21/−11) (lanes 2, 6, 10, 14), SP-1 consensus sequence (lanes 3, 7, 11, 15), and GATA consensus sequence from the human ALAS-E promoter (lanes 4, 8, 12, 16). The arrow and the arrowheads indicate the complexes of the probe and nuclear proteins.
Formation of a DNA-protein complex with the SP-1–like element of the mouse CPO promoter. Five-microgram aliquots of nuclear extracts from 745A (lanes 1 to 8) or NIH3T3 (lanes 9 to 16) cells were incubated with the end-labeled oligomers corresponding to the SP-1–like element (-21/-11) (lanes 1 to 4, 9 to 12) or the SP-1 consensus sequence (lanes 5 to 8, 13 to 16). Competition assays were performed with a 250-fold molar excess of unlabeled oligonucleotides containing the SP-1–like element (−21/−11) (lanes 2, 6, 10, 14), SP-1 consensus sequence (lanes 3, 7, 11, 15), and GATA consensus sequence from the human ALAS-E promoter (lanes 4, 8, 12, 16). The arrow and the arrowheads indicate the complexes of the probe and nuclear proteins.
DISCUSSION
In this study, we examined the regulatory mechanism of the mouse CPO gene expression in erythroid and nonerythroid cells. We first examined the structure of the mouse CPO gene and identified that the mouse CPO gene structure is highly similar to the human CPO gene. Namely, the 5′-upstream region of the mouse CPO gene contains several putative cis-regulatory elements including GATA sites, CACCC sites, and SP-1–like element, just like the human CPO gene. The spatial arrangement of these elements is also similar for both genes,14,20 suggesting that CPO gene expression may be regulated in a similar manner between mice and humans. By examining the mouse CPO gene promoter function, we identified a novel regulatory element (GGACTACAG, termed CPRE) that is involved in the induction of luciferase activity in NIH3T3 cells, whereas an SP-1–like element at −21/−12 was also required for maximal promoter activity in DMSO-induced MEL cells (Fig 4B and 6A). Disruption of CPRE resulted in a marked decrease in the promoter activity in NIH3T3 cells, while it decreased the promoter activity only moderately in MEL cells (Fig 4B and 6A), suggesting a different role of CPRE between erythroid and nonerythroid cells. Gel mobility shift assays demonstrated that a specific DNA-protein complex was formed at CPRE both in MEL and NIH3T3 cells (Fig 7). Our search in the GenBank database showed that CPRE is also present in the human β-globin gene promoter,25 and CPRE-related sequences are also found in genes of several heme biosynthetic enzymes, such as uroporphyrinogen decarboxylase,26 CPO,14,20 rat ALAS-N,27 and in the erythroid and nonerythroid mouse PBGD10 28 (Table 2). A CPRE-related sequence is also present in the human ALAS-E (our unpublished data). It is unclear at present whether these sequences are functional or not, but it is possible that CPRE-binding factor(s) may contribute to heme synthesis by exerting its effect on gene expression of these enzymes. Identification of the factor(s) that interacts with this element may therefore be important for better understanding of tissue-specific regulation of heme pathway genes.
CPRE-Like Sequences Found in the Other Gene Promoter Regions
| . | CPRE Related Sequences . | Localization* . |
|---|---|---|
| Mouse CPO | gacg GGACTACAG ttcc | −49 to −41 |
| Human ALAS-E | tctc TGACTATAG atct | −286 to −279 |
| Rat ALAS-N | ggtg TGACTACAT gaga | −689 to −681 |
| Mouse PBGD (erythroid promoter) | tttcGGACAACAG ggag | −744 to −736 |
| Mouse PBGD (non-erythroid promoter) | cagtGGACTTGAG cgaa | −70 to −62 |
| Human UROD | gatc GGACTCCAG cgac | −137 to −129 |
| Human CPO | atcc GGACTACAG ctcc | −97 to −89 |
*From the transcription initiation site.
Our previous studies showed that an SP-1 site adjacent to the GATA sequence in the human CPO gene contributes to basic gene expression in MEL cells.20 Therefore, we suspected that an SP-1–like element at −21/−12 in the mouse CPO gene may also be involved in the promoter function. Indeed, its disruption resulted in a moderate decrease in the promoter activity in NIH3T3 cells, indicating its contribution (Fig 4B). In MEL cells, the SP-1–like element alone, however, demonstrated only a very low activity, but its combination with CPRE or GATA site (−59/−54) markedly enhanced the promoter activity (Fig 6B). Gel mobility shift assays demonstrated that this element may be recognized by different nuclear factors between MEL and NIH3T3 cells (Fig 9), suggesting that transcriptional regulation by SP-1–like element may be different between erythroid and nonerythroid cells. A similar GC-rich element also exists in the proximal promoter region of human ferrochelatase gene.29 Thus, there may be a role of this element in the expression of other heme biosynthetic enzymes, and this question should be clarified.
The GATA site at −59/−54 was shown to bind to GATA-1, consistent with our previous findings for its role in human CPO gene expression (Fig 8).20 Because GATA factors are key contributors to the differentiation process of hematopoietic cells21-23,30 and because GATA binding sites have been widely found in the gene promoter of several heme synthetic pathway enzymes,31 GATA-1 may also be essential for upregulation of the CPO gene during erythroid differentiation. In the present study, the GATA site alone or in combination with CPRE, showed only a low reporter activity, while together with the SP-1–like element, it markedly stimulated the activity in MEL cells (Fig 6A). Synergistic effects of various combinations of transcription factors, including GATA-1, on TATA-less promoters have been reported.32-34 Our results also suggest that interaction between GATA-1 and SP-1–like element-binding proteins, as well as CPRE and SP-1–like element-binding–proteins may be important for CPO gene expression in erythroid cells.
GATA-1 significantly contributes to the DMSO-induced promoter activity in MEL cells (Fig 6B). On the other hand, the amount of GATA-1–DNA complex formed at the −59/−54 GATA site was slightly decreased by DMSO treatment of MEL cells (Fig 8). DMSO treatment also did not increase the formation of DNA-protein complexes at CPRE and SP-1–like element (data not shown). Thus, GATA-1–mediated increase in transactivation and a decrease in DNA binding in DMSO-treated MEL cells may seem paradoxical. However, our findings are consistent with an earlier report, which showed that MEL cells contain two distinct GATA-binding proteins that have different patterns of expression during erythroid differentiation, and that GATA-1 mRNA levels decreased transiently during DMSO-induced differentiation.24 One possible explanation may be that GATA-1 may become an active form by certain modification such as phosphorylation during erythroid differentiation.35 Alternatively, DMSO treatment may induce interaction among transcription factors, resulting in the activation of the promoter function.
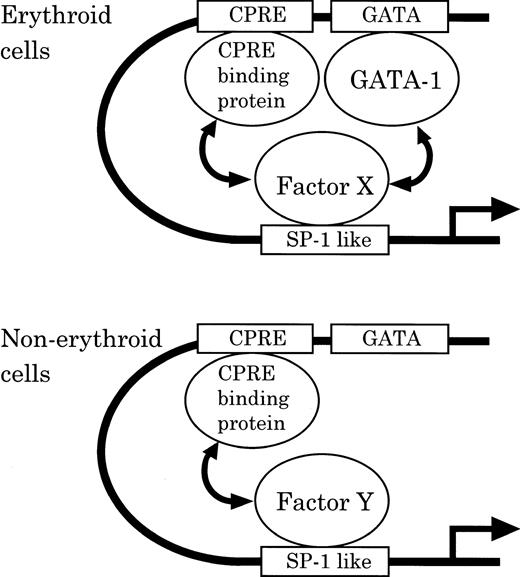
To account for tissue-specific regulation, we provide a hypothetical scheme for differential CPO regulation between erythroid and nonerythroid cells (Fig 10). Namely, in erythroid cells, binding proteins to the SP-1–like element, CPRE and GATA-1, cooperatively function in CPO gene expression. In contrast, in nonerythroid cells, CPRE-binding protein by itself plays a principal role in basic expression, while GATA-1 plays little role and the SP-1–like element may exert only a moderate activity. The tissue-specific regulation of CPO gene promoter function may also be influenced by differences in the affinity of tissue-specific factors to the SP-1–like element, Factor X and Y in MEL and NIH3T3 cells, respectively. While the exact nature of the regulatory mechanism of CPO gene expression is yet to be clarified, this model should serve as a useful hypothesis for evaluation for tissue-specific regulation of heme biosynthetic enzymes.
Model of the differential regulation of the mouse CPO gene promoter function in erythroid and nonerythroid cells.
Model of the differential regulation of the mouse CPO gene promoter function in erythroid and nonerythroid cells.
ACKNOWLEDGMENT
We thank Drs H. Motohashi, N. Minegishi, K. Furuyama, S. Suzuki, and H. Ohtsu for helpful discussions.
Supported in part by Grants-in-Aid from the Ministry of Education, Science, Sports and Culture, Japan (to N.H., M.Y., and T.N.), Grant-in-Aid for Scientific Research (to S.T.), and Research Grant from Sumitomo Chemicals Co (to S.T.).
Address reprint requests to Tadashi Nagai, MD, PhD, Department of Biochemistry, Tohoku University School of Medicine, 2-1 Seiryo-machi, Sendai, 980-77, Japan; e-mail: shintak@mail.cc.tohoku.ac.jp.
The publication costs of this article were defrayed in part by page charge payment. This article must therefore be hereby marked "advertisement" is accordance with 18 U.S.C. section 1734 solely to indicate this fact.


This feature is available to Subscribers Only
Sign In or Create an Account Close Modal